HAL Id: hal-03242636
https://hal.sorbonne-universite.fr/hal-03242636
Submitted on 31 May 2021
HAL is a multi-disciplinary open access archive for the deposit and dissemination of sci-entific research documents, whether they are pub-lished or not. The documents may come from teaching and research institutions in France or abroad, or from public or private research centers.
L’archive ouverte pluridisciplinaire HAL, est destinée au dépôt et à la diffusion de documents scientifiques de niveau recherche, publiés ou non, émanant des établissements d’enseignement et de recherche français ou étrangers, des laboratoires publics ou privés.
for patients with recurrent or metastatic head and neck
squamous cell carcinoma progressing after EXTREME
Thomas Chevalier, Amaury Daste, Esmaa Saada-bouzid, Anderson Loundou,
Florent Peyraud, Tiphaine Lambert, Christophe Le Tourneau, Frédéric
Peyrade, Charlotte Dupuis, Marc Alfonsi, et al.
To cite this version:
Thomas Chevalier, Amaury Daste, Esmaa Saada-bouzid, Anderson Loundou, Florent Peyraud, et al.. Cetuximab combined with paclitaxel or paclitaxel alone for patients with recurrent or metastatic head and neck squamous cell carcinoma progressing after EXTREME. Cancer Medicine, Wiley, 2021, �10.1002/cam4.3953�. �hal-03242636�
Cancer Medicine. 2021;00:1–12. wileyonlinelibrary.com/journal/cam4
|
1 O R I G I N A L R E S E A R C HCetuximab combined with paclitaxel or paclitaxel alone for
patients with recurrent or metastatic head and neck squamous
cell carcinoma progressing after EXTREME
Thomas Chevalier
1|
Amaury Daste
2|
Esmaa Saada- Bouzid
3|
Anderson Loundou
4|
Florent Peyraud
2|
Tiphaine Lambert
5|
Christophe Le Tourneau
5|
Frédéric Peyrade
3|
Charlotte Dupuis
1|
Marc Alfonsi
6|
Jérôme Fayette
7|
Juliette Reure
7|
Florence Huguet
8|
Nicolas Fakhry
9|
Clémence Toullec
10|
Sébastien Salas
11Department of Medical Oncology, CHU la Timone, AP- HM, Marseille, France
2Department of Medical Oncology, Hôpital Saint- André, Bordeaux University Hospital- CHU, Bordeaux, France 3Department of Medical Oncology, Centre Antoine Lacassagne, Nice, France
4EA3279, Self- Perceived Health Assessment Research Unit, Aix- Marseille University, Marseille, France
5Department of Drug Development and Innovation (D3i), Paris- Saclay University, Institut Curie, Paris & Saint- Cloud, France 6Department of Radiation Oncology, Clinique Sainte Catherine, Avignon, France
7Department of Medical Oncology, Léon Bérard Center, University of Lyon, Lyon, France
8Department of Radiation Oncology, Tenon Hospital, Paris Sorbonne Université, Assistance Publique- Hôpitaux de Paris, Paris, France 9Department of Otorhinolaryngology - Head and Neck Surgery, AP- HM, Aix- Marseille University, France
10Department of Medical Oncology, Clinique Sainte Catherine, Avignon, France
This is an open access article under the terms of the Creative Commons Attribution License, which permits use, distribution and reproduction in any medium, provided the original work is properly cited.
© 2021 The Authors. Cancer Medicine published by John Wiley & Sons Ltd.
Correspondence
Thomas Chevalier, Department of medical oncology, AP- HM, Hôpital de la Timone, 264 Rue Saint- Pierre, 13385, Marseille Cedex 5, France.
Email: thomas.chevalier@ap-hm.fr
Funding information
None declared.
Abstract
BACKGROUND: Prognosis of recurrent or metastatic (R/M) head and neck
squa-mous cell carcinoma (HNSCC) remains poor. The addition of cetuximab, to platinum and fluorouracil chemotherapy (EXTREME regimen) has been shown to improve patients’ outcomes in first- line settings.
METHODS: We conducted a retrospective, multicenter study, including HNSCC
that progressed after a first line of platinum- based chemotherapy and cetuximab, treated either by paclitaxel + cetuximab (PC) or paclitaxel alone (P), between January 2010 and April 2018. The end points were overall survival (OS), progression- free survival (PFS), and overall response rates (ORR). Patients were matched according to their propensity scores, estimated with a logistic regression model. The secondary objectives were to study the safety profile and to look for prognostic and predictive factors of effectiveness.
RESULTS: Of the 340 identified patients, 262 were included in the analysis, 165
1
|
INTRODUCTION
Head and neck squamous cell carcinoma (HNSCC) is the fifth most frequent and the sixth most common cause of death by cancer. Most patients are diagnosed at a locally advanced stage. Despite progress in primary treatment by combin-ing surgery, radiation therapy, chemotherapy, and support-ive care, the recurrence rate is about 40% for all stages.1
Prognosis remains poor for patients who are ineligible for salvage therapy. Cetuximab, an epidermal growth factor re-ceptor (EGFR)- targeting monoclonal antibody, was the first targeted therapy to show a significant benefit in HNSCC. In a single- agent trial, it showed 13% overall response rate (ORR) and a median time to progression of 70 days in patients with R/M HNSCC who failed to respond to platinum- based ther-apy.2 Cetuximab combined with platinum- based
chemo-therapy followed by cetuximab maintenance (EXTREME) improved progression- free survival (PFS), overall survival (OS), and ORR compared to platinum- based chemotherapy alone as the first- line therapy.3
Weekly paclitaxel (P) monotherapy was evaluated in a non- randomized phase II and showed an objective response in 43.3% of patients with 5.2 months median OS in a first- line platinum- refractory setting or as a second line after platinum- based chemotherapy.4 One retrospective study showed similar
results,5 so it is an option for platin- resistant R/M HNSCC.6
Taxanes and Cetuximab have been shown to have synergistic activity in in vitro studies.7 Two non- randomized phase II
tri-als have evaluated paclitaxel and cetuximab (PC) as first- line treatment. They showed a 52%– 54% response rate and 4.2– 7.0 median PFS and 8.1– 16.3 median OS.8,9 In retrospective
studies, PC showed high activity with a 48%– 55% response rate, and a median OS of 7.6– 9.2 months. However, in these retrospective studies, a significant proportion of patients were treated in a first- line setting because of their ineligibility for platinum chemotherapy.10,11 To the best of our knowledge,
continuation of cetuximab after platinum- based chemother-apy in combination with taxanes has not yet been evaluated.
We conducted a multicenter retrospective study to eval-uate the value of continuing cetuximab in association with P beyond progression after an EXTREME chemotherapy regimen +/- cetuximab as maintenance in R/M HNSCC. Secondary objectives were to identify the prognostic factors and predictive factors for response to the PC combination and evaluate safety.
2
|
MATERIALS AND METHODS
2.1
|
Study design and data source
We retrospectively collected the medical files of all patients treated with paclitaxel +/- cetuximab in seven French centers between January 2010 and April 2018. Patients who met the following criteria were included: histologically confirmed R/M HNSCC, were not eligible for salvage therapy (i.e., radiation therapy and/or surgery) according to local multi-disciplinary concertation and had disease progression after first- line chemotherapy containing platinum and cetuximab +/- fluorouracil and +/- cetuximab in maintenance. Patients were excluded if they had naso- sinusal, cutaneous, or parot-idean carcinomas, if they had received taxane- based chemo-therapy in a first- line setting or if they had received more than one previous line of treatment. Patients could have re-ceived docetaxel in a neoadjuvant or induction chemotherapy regimen.
We analyzed the following parameters: gender; age; lo-cation of primary tumor; initial TNM classifilo-cation (7th
UICC edition); p16 status if available; treatment for local-ized disease, that is, induction chemotherapy, surgery, chemo radiotherapy (RT- CT); site of recurrence (locoregional vs. metastatic); first- line chemotherapy regimen; time to PC and 6.2% for P. Median PFS was 2.9 months [95% Confidence Interval 2.7– 3.0] for PC versus 2.5 months [2.2– 2.7] for P, hazard ratio (HR) = 0.770 [0.596– 0.996]. Median OS was 5.5 months [4.4– 6.9] for PC versus 4.2 months [3.4– 4.8] for P, HR = 0.774 [0.590– 1.015]. In multivariate analysis, PC was associated with better PFS and OS. These results were consistent in matched- paired population. Previous cetuximab maintenance for more than 3 months was predictive of better OS with PC.
CONCLUSION: Although the continuation of cetuximab in combination with
pa-clitaxel after EXTREME provides moderate benefit, it could be an interesting option for selected patients.
K E Y W O R D S
cetuximab, chemotherapy, EXTREME, paclitaxel, Recurrent/metastatic head and neck squamous cell carcinoma
progression after first- line chemotherapy (TTP1) defined as the time between first injection of platinum +cetuximab +/- fluorouracil and clinical or radiological progression; and best response to first- line chemotherapy according to RECIST 1.112 and World Health Organization (WHO) Performance
Status (PS). We considered that patients received cetux-imab maintenance if they received an injection more than 21 days after the last platinum injection and had a stable or objective response to the EXTREME regimen. Duration of cetuximab maintenance was defined as the time between the beginning of maintenance and the last infusion of cetuximab. Chemotherapy- free interval (CFI) was defined as the time between last infusion of chemotherapy with platinum and progression. The study was authorized by the review board of the Groupe d’Oncologie et Radiothérapie Tête et Cou (GORTEC).
2.2
|
Statistical analysis
Characteristics of patients who received PC were compared with those who received P alone using Chi2 or Fisher's exact tests for categorical variables, and the Wilcoxon test for con-tinuous variables.
The objectives were to assess PFS defined as the time from first injection of PC or P to disease progression, as-sessed clinically or radiologically, or death, OS defined as the time from first injection of PC or P to death, and over-all response rate, assessed by CT scan and/or MRI when CT scan was not sufficient to evaluate response according to RECIST 1.1. Patients without events were censored at the time of last follow- up. Survival curves were generated using the Kaplan– Meier method and compared using the log- rank test. Hazard ratio (HR) estimations are provided along with their bilateral confidence intervals. A propensity score for re-ceiving PC was estimated using a logistic regression. Patients who received PC were matched on this score to patients who received P alone. The impact of cetuximab on PFS and OS was assessed on this matched population by log- rank tests stratified on the pairs.
The prognostic impact of the different clinical factors was tested in univariate analysis. Factors that showed individual prognostic value in univariate models with a p value of less than 0.2 were used to examine their joint prognostic value in a multivariate model. Patients with missing data were not included in the multivariate analysis for prognostic factors and predictive factors. Tests to determine interactions be-tween treatment and covariates were used in the Cox model to identify predictive factors by assessing whether there was a significant difference in the treatment effect on OS and PFS. Patients were categorized as responders if they had an objective response (i.e., partial or complete response) and non- responders if they had stable disease or progression.
Predictive factors for response to PC were assessed using a logistic regression.
The level of statistical significance was set at α = 0.05. All p values are two- sided. Statistical analyses were carried out with SPS software and Addinsoft (2019) XLSTAT statis-tical and data analysis solution, version 10.13, Paris France https://www.xlstat.com.
3
|
RESULTS
3.1
|
Characteristics of population
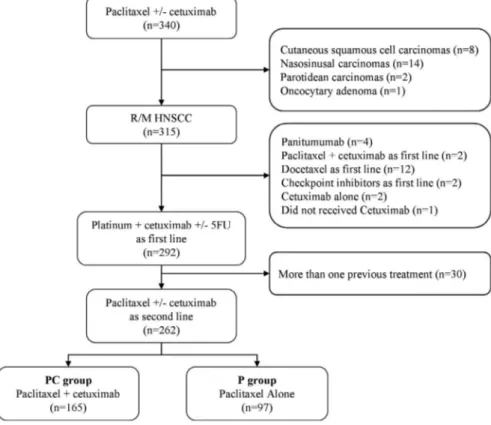
Of 340 patients who received paclitaxel +/- cetuximab, a total of 315 patients with R/M HNSCC were identified, including 262 who received EXTREME. Thirty patients were excluded because they had received more than one previous line of treatment. Of the 262 patients who received paclitaxel +/- cetuximab, 165 (63%) received PC, and 97 (37%) received P alone (Figure 1). Patients received either P 60 to 80 mg/m2
per week, 3 weeks/4, and weekly cetuximab 250 mg/m2, or P
alone as described above.
As of September 2018, the median follow- up of patients was 42.1 months (CI 95% 19.1- NR). PS was not available for 26 patients, 11 in PC, and 15 in P. PS was 0– 1 or 2 for the 236 other patients. Ninety percent of patients who received paclitaxel + cetuximab or paclitaxel alone had progressed within 1 month after the last cetuximab injection. The main reasons for stopping cetuximab during maintenance was the occurrence of serious adverse event, or patient's refusal. All of these patients had achieved disease control at the time of the interruption. Baseline characteristics differed by sub-group (Table 1).
3.2
|
Unmatched population
A total of 253 PFS events (96.6%, 159/165 and 94/97 in pa-tients treated with PC and P, respectively), were observed. Unadjusted median PFS was 2.9 months [95% CI 2.8– 3.0] and 2.5 months [95% CI 2.2– 2.7], in PC and P, respectively, HR= 0.770 [95% CI 0.596– 0.996]; p = 0.046 (Figure 2). Death oc-curred in 230 of 262 patients (87.8%), 145/165 (87.9%) in the PC group versus 85/97 (87.6%), in the P group. Unadjusted median OS was 5.5 months [95% CI 4.4– 6.9] in the PC group versus 4.2 months [95% CI 3.4– 4.8] in the P group. OS was not significantly longer in the PC group in univariate analy-sis, HR = 0.774 [95% CI 0.590– 1.015]; p = 0.064 (Figure 3). In the PC group, 27 of 165 patients (16.4%) achieved an objective response versus 6 of 97 (6.2%), in the P group (OR = 2.97 [95% CI 1.18– 7.47]; p=0.021). Two patients in the PC group had complete response. However, disease control rates (i.e., objective response and stable disease) did
not significantly differ between the two groups with 32% and 24% in the PC and P groups, respectively (p = 0.147). Median duration of response was 7.7 months [95% CI 6.7– 12.8] for PC and 5.5 months [95% CI 5.1– 17.6] for P alone (log- rank test, p = 0.391).
Adjusting for the baseline factors (tumor location, cetux-imab maintenance, CFI, TTP1, WHO PS, second- line chemo-therapy, and response to EXTREME for OS or age for PFS) in multivariate analysis, revealed a significant difference in terms of PFS (HR = 0.708, 95% CI 0.529– 0.948, p = 0.021) and OS (HR = 0.712, 95% CI 0.519– 0.980, p = 0.037) for PC. In this multivariate analysis, TTP1 ≥ 6 months was as-sociated with better OS (p = 0.032) and WHO PS with bet-ter PFS and OS (p = 0.001 and p < 0.0001, respectively) (Table 2).
3.3
|
Predictive factors
We then searched for clinical predictive factors of PC effi-cacy in the whole population. There was no significant dif-ference in OS between PC and P alone regarding gender, age, tumor location, site of recurrence, response to EXTREME, cetuximab maintenance, and CFI, p > 0.05. Patients who had cetuximab maintenance for more than 3 months (n = 52) were more likely to benefit from the association, HR for OS with PC versus P alone was 0.397 [95% CI 0.204– 0.774];
p = 0.007, whereas it was 1.126 [95% CI 0.570– 2.223]; p = 0.733, for patients who had cetuximab maintenance for
less than 3 months (n = 60) in PC versus P alone. p value for interaction between treatment group and duration of ce-tuximab maintenance on OS was 0.033. For patients with TTP1 ≥ 6 months and CFI ≥3 months, median OS was higher with PC than P (HR = 0.663 [0.439– 1.000] and HR = 0.605 [0.375– 0.976]), whereas there was no significant difference for patients with TTP1 < 6 months (HR = 0.937 [0.450– 1.130]) or CFI <3 months (HR = 0.932 [0.670– 1.296]). p value for the interaction test was 0.216 for TTP1 and 0.146 for CFI,. Regarding PFS, a hypopharyngeal localization was less likely to benefit from the cetuximab continuation compared to other locations, HR for progression was 1.833 [0.959– 3.506]; p = 0.067, in PC versus P alone, p value for interaction was 0.002. Patients with WHO PS 0– 1 had a bet-ter prognosis than PS 2– 4 (cf. above), but there was no differ-ence in OS between PC and P alone (p = 0.251). In contrast, patients with PS 2– 4 had better OS (HR = 0.566 [0.359– 0.894], p = 0.015) and PFS (HR=0.467, [95% CI 0.298– 0.730]; p = 0.001) with PC than with P, but p values for the interaction were not significant, p = 0.260 and p = 0.069. All results are summarized in the forest plot (Tables S1 and S2). OS Kaplan– Meier curves for TTP1, WHO PS, duration of cetuximab maintenance and CFI in both groups are shown in Figure S2.
We then looked for predictive factors of response to PC using a logistic regression model. Male sex, age <65 years old, non- responders to EXTREME, TTP1 < 6 months, and CFI <3 months were more likely to have an objective re-sponse with PC than with P alone (p < 0.05). However, we
FIGURE 1 Patient flow diagram showing selection of patients with R/M HNSCC who received Paclitaxel +/- Cetuximab as second line. Abbreviations: HNSCC, Head and Neck Squamous Cell Carcinoma, R/M, Recurrent or Metastatic, 5FU, Fluorouracil; PC, Paclitaxel + Cetuximab; P, Paclitaxel
TABLE 1
Characteristics of patients at baseline in the whole population and in the
paired population Unmatched population paired population PC (n = 165) P (n = 97) p value PC (n = 70) P (n = 70) p value No. % No. % No. % No. % Gender Male 136 82% 85 88% 0.263 57 81% 59 84% 0.654 Female 29 18% 12 12% 13 19% 11 16% Age Median [min– max] 61.5 [40– 80] 61.7 [34– 86] 0.151 62.0 [42– 85] 62.2 [34– 86] 0.065 <65 years 98 59% 63 65% 0.372 39 56% 46 66% 0.226 ≥65 years 67 41% 34 35% 31 44% 24 34% Site HM– – Marseille 116 70% 5 5% <0.0001 40 57% 4 6% <0.0001 CHU Bordeaux 6 4% 49 51% 5 7% 38 54% ISC– – Avignon 22 13% 15 15% 21 30% 14 20% CAL– – Nice 20 12% 12 12% 3 4% 12 17% Curie– – Paris 0 0% 12 12% 0 0% 0 0% Tenon 1 1% 2 2% 1 1% 2 3% CLB– – Lyon 0 0% 2 2% 0 0% 0 0%
Location Oral cavity
43 25% 21 21% 0.422 12 17% 15 21% 0.520 Hypopharynx 37 22% 14 14% 0.057 10 14% 10 14% 1.000 Larynx 29 18% 10 10% 0.111 8 11% 6 9% 0.573 Oropharynx 52 31% 50 51% <0.001 38 54% 35 50% 0.612 Unknown Primary 8 5% 4 4% 0.786 2 3% 4 6% 0.404
Initial TNM classification (7th UICC) Stage I
7 4% 7 7% 0.189 2 3% 5 7% 0.145 Stage II 23 14% 6 6% 8 11% 4 6% Stage III 25 16% 18 19% 11 16% 12 17% Stage IV 105 66% 66 68% 45 64% 49 70% (Continues)
Unmatched population paired population PC (n = 165) P (n = 97) p value PC (n = 70) P (n = 70) p value No. % No. % No. % No. % P16 Status Positive 5 3% 3 3% 0.110 3 4% 2 3% <0.0001 Negative 25 15% 57 59% 13 19% 41 59% Missing 135 82% 37 38% 54 77% 27 39%
Primary treatment Induction CT
42 25% 14 14% 0.036 19 27% 11 16% 0.099 Surgery 57 33% 38 39% 0.452 21 30% 29 41% 0.158 CT 149 90% 70 72% <0.001 57 81% 54 77% 0.532
Site of recurrence Locoregional
79 48% 41 43% 0.419 35 50% 31 44% 0.505 Metastatic 86 52% 55 57% 35 50% 38 54% line chemotherapy Cisplatin 69 42% 41 42% 0.943 27 39% 32 46% 0.392 Carboplatin 125 76% 77 79% 0.500 53 76% 55 79% 0.687 Fluorouracil 130 79% 64 66% 0.022 55 79% 51 73% 0.430
Response to EXTREME Yes
64 39% 35 36% 0.664 27 39% 30 43% 0.606 No 101 61% 62 64% 43 61% 40 57% TTP1 <6 months 88 53% 54 56% 0.714 40 57% 38 54% 0.734 ≥6 months 77 47% 43 44% 30 43% 32 46% free Interval <3 months 104 63% 65 67% 0.516 45 64% 43 61% 0.726 ≥3 months 61 37% 32 33% 25 36% 27 39% TABLE 1 (Continued) (Continues)
Unmatched population paired population PC (n = 165) P (n = 97) p value PC (n = 70) P (n = 70) p value No. % No. % No. % No. %
Cetuximab maintenance No maintenance
84 51% 66 68% 0.025 41 59% 42 60% 0.910 <3 months 43 26% 17 18% 14 20% 15 21% ≥3 months 38 23% 14 14% 15 21% 13 19% Performance Status 0– 1 106 64% 45 46% 0.008 41 59% 39 56% 0.733 2 48 29% 37 38% 29 41% 31 44% Missing 11 7% 15 16% Note:
Chi2 was used to generate
p values.
Bold values indicate values that are statistically different. Abbreviations: CT, Chemotherapy; No, Number, NS, Non significative; P, Paclitaxel;PC, Paclitaxel +cetuximab; RT, Radiation Ther
apy; TTP1, Time to progression under EXTREME
line chemotherapy; UICC, Union for
International Cancer Control.
TABLE 1
did not find any predictive factors of response, as p value for the interaction was >0.05.
3.4
|
Propensity score analysis
We used the covariates that were significantly associated with PC use (p < 0.05) in multivariate analysis, namely, oropharyngeal localization, RTCT, cetuximab maintenance and PS, to which we added TTP1, for which a prognostic impact was found on survival, to calculate the propensity
scores. Site was not taken into account for the calculation of the propensity score because the choice of treatment by PC or P was strongly linked to the habit of the center, neither P16 status, we have chosen not to take into account due to the number of missing data. Patients were then matched on these propensity scores (based on a calliper width of 0.50 of the log odds of the propensity score). The model exhibited acceptable discrimination capability, with an area under the curve equal to 0.7336 (Figure S1) and good calibration, with a p value for the Hosmer- Lemeshow goodness of fit test equal to 0.9199.
FIGURE 2 Kaplan– Meier for PFS in overall population (A) and in matched- paired population (B). p value calculated with log- rank test. Abbreviations: HR, Hazard Ratio; CI, Confidence interval
FIGURE 3 Kaplan– Meier for OS in overall population (A) and in matched- paired population (B). p value calculated with log- rank test. Abbreviations: HR, Hazard Ratio; CI, Confidence interval
3.5
|
Matched- paired population
After propensity score matching 140 patients with a 1:1 ratio, 70 in each group, baseline characteristics did not differ be-tween PC and P alone groups with the exception of site and P16 status (Table 1). In the 1:1 matched- paired population, PC showed significantly longer PFS (median, 2.8 months;
95% CI 2.5– 3.0) in comparison with P alone (median, 2.4 months; 95% CI 2.1– 2.7), HR for progression was 0.704 [95% CI 0.498– 0.994], p = 0.046 (Figure 2). Six months progression- free survival rates were 21% (95% CI 11%– 31%) and 7% (95% CI 1%– 14%) for PC and P, respectively. The estimated median OS was longer with PC (5.4 months; 95% CI 4.1– 6.7) than with P alone (4.1 months; 95% CI 3.2– 4.7),
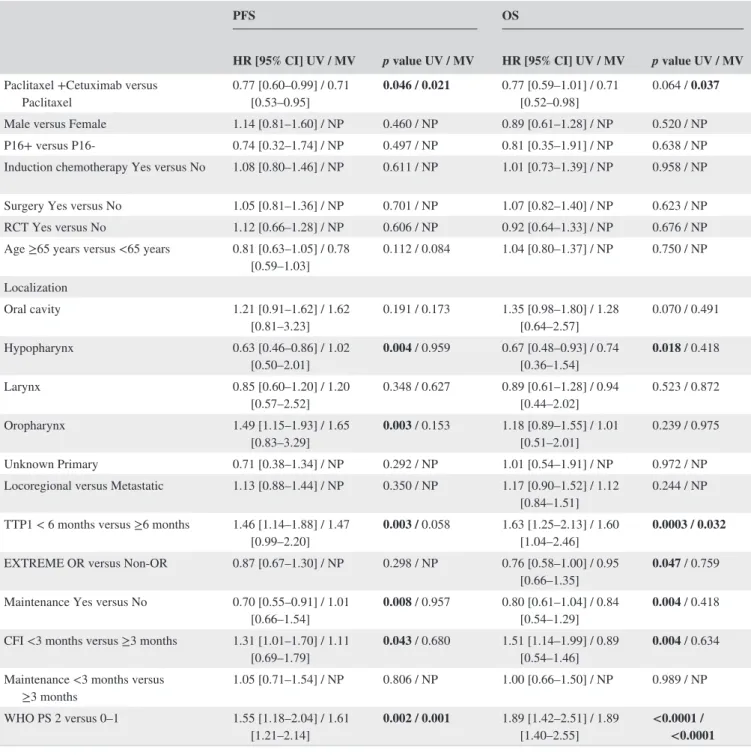
TABLE 2 Multivariate analysis for Overall Survival (OS) and Progression- Free Survival (PFS) using Cox model including location of primary, Time to progression under EXTREME first- line chemotherapy (TTP1), cetuximab maintenance, second- line chemotherapy, World Health Organization Performance Status (WHO PS), age for PFS, objective response to EXTREME for OS
PFS OS
HR [95% CI] UV / MV p value UV / MV HR [95% CI] UV / MV p value UV / MV
Paclitaxel +Cetuximab versus
Paclitaxel 0.77 [0.60– 0.99] / 0.71 [0.53– 0.95] 0.046 / 0.021 0.77 [0.59– 1.01] / 0.71 [0.52– 0.98] 0.064 / 0.037 Male versus Female 1.14 [0.81– 1.60] / NP 0.460 / NP 0.89 [0.61– 1.28] / NP 0.520 / NP P16+ versus P16- 0.74 [0.32– 1.74] / NP 0.497 / NP 0.81 [0.35– 1.91] / NP 0.638 / NP Induction chemotherapy Yes versus No 1.08 [0.80– 1.46] / NP 0.611 / NP 1.01 [0.73– 1.39] / NP 0.958 / NP Surgery Yes versus No 1.05 [0.81– 1.36] / NP 0.701 / NP 1.07 [0.82– 1.40] / NP 0.623 / NP RCT Yes versus No 1.12 [0.66– 1.28] / NP 0.606 / NP 0.92 [0.64– 1.33] / NP 0.676 / NP Age ≥65 years versus <65 years 0.81 [0.63– 1.05] / 0.78
[0.59– 1.03] 0.112 / 0.084 1.04 [0.80– 1.37] / NP 0.750 / NP Localization Oral cavity 1.21 [0.91– 1.62] / 1.62 [0.81– 3.23] 0.191 / 0.173 1.35 [0.98– 1.80] / 1.28 [0.64– 2.57] 0.070 / 0.491 Hypopharynx 0.63 [0.46– 0.86] / 1.02 [0.50– 2.01] 0.004 / 0.959 0.67 [0.48– 0.93] / 0.74 [0.36– 1.54] 0.018 / 0.418 Larynx 0.85 [0.60– 1.20] / 1.20 [0.57– 2.52] 0.348 / 0.627 0.89 [0.61– 1.28] / 0.94 [0.44– 2.02] 0.523 / 0.872 Oropharynx 1.49 [1.15– 1.93] / 1.65 [0.83– 3.29] 0.003 / 0.153 1.18 [0.89– 1.55] / 1.01 [0.51– 2.01] 0.239 / 0.975 Unknown Primary 0.71 [0.38– 1.34] / NP 0.292 / NP 1.01 [0.54– 1.91] / NP 0.972 / NP Locoregional versus Metastatic 1.13 [0.88– 1.44] / NP 0.350 / NP 1.17 [0.90– 1.52] / 1.12
[0.84– 1.51] 0.244 / NP TTP1 < 6 months versus ≥6 months 1.46 [1.14– 1.88] / 1.47
[0.99– 2.20] 0.003 / 0.058 1.63 [1.25– 2.13] / 1.60 [1.04– 2.46] 0.0003 / 0.032 EXTREME OR versus Non- OR 0.87 [0.67– 1.30] / NP 0.298 / NP 0.76 [0.58– 1.00] / 0.95
[0.66– 1.35] 0.047 / 0.759 Maintenance Yes versus No 0.70 [0.55– 0.91] / 1.01
[0.66– 1.54] 0.008 / 0.957 0.80 [0.61– 1.04] / 0.84 [0.54– 1.29] 0.004 / 0.418 CFI <3 months versus ≥3 months 1.31 [1.01– 1.70] / 1.11
[0.69– 1.79] 0.043 / 0.680 1.51 [1.14– 1.99] / 0.89 [0.54– 1.46] 0.004 / 0.634 Maintenance <3 months versus
≥3 months 1.05 [0.71– 1.54] / NP 0.806 / NP 1.00 [0.66– 1.50] / NP 0.989 / NP WHO PS 2 versus 0– 1 1.55 [1.18– 2.04] / 1.61
[1.21– 2.14] 0.002 / 0.001 1.89 [1.42– 2.51] / 1.89 [1.40– 2.55] <0.0001 / <0.0001
Bold values indicate differences that are statistically significant.
Abbreviations: 95% CI, 95% Confidence interval; CFI, Chemotherapy- Free Interval; HR, Hazard Ratios; MV, Multivariate analysis; NP, Not performed; OR, Objective Response; RCT, Radiation +/- Chemotherapy; TTP, Time to Progression with first- line chemotherapy; UV, Univariate Analysis; WHO PS, World Health Organization Performance status; WHO PS, World Health Organization Performance Status.
HR for death was 0.675 [95% CI 0.463– 0.984]; p = 0.041 (Figure 3). The estimated 1- year survival was 27% [95% CI 16%– 38%] and 9% [95% CI 1%– 16%] in the PC and the P groups, respectively.
There was no difference in ORR with 11.4% and 8.6% for PC and P, respectively, OR = 1.376 [95% CI 0.451– 4.196];
p = 0.576.
3.6
|
Safety
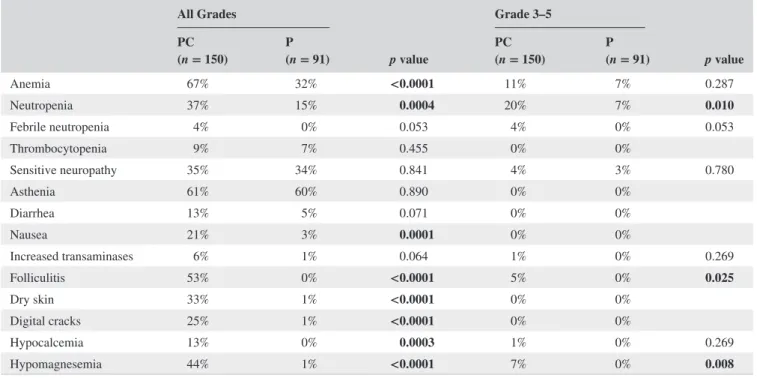
Safety data were available for 148 patients in the PC group and 89 patients in the P group. The main toxicities observed are summarized in Table 3. We found that neutropenia, ane-mia, and nausea, were more frequent inpatients receiving PC. Hematotoxicity often occurred within the first cycle of treatment, probably because of reminiscent effect of plati-num chemotherapy. Specific toxicities of cetuximab such as skin toxicities, hypomagnesemia, or hypocalcemia occurred as expected and was manageable with doxycycline and local treatments. Treatment discontinuation for toxicity was simi-lar in both groups: 9.7% and 12.1% in the PC and P groups, respectively, p = 0.672.
3.7
|
Subsequent lines
Finally, we sought to study what had been the subsequent treatments received. Forty- five percent and 28% of patients
in the PC group and in the P group received a subsequent therapy (p = 0.018). Subsequent lines mainly consisted in monotherapy with methotrexate, vinorelbine, gemcitabine, polychemotherapy rechallenging platinum- based chemother-apy with cetuximab, targeted therchemother-apy such as Pi3 K inhibitors or immune checkpoints inhibitors. Although more patients received subsequent therapy in the PC group, among the pa-tients who did, 15% and 19% received immune checkpoints inhibitors in the PC and P groups, respectively (p = 0.637).
4
|
DISCUSSION
We evaluated the outcome of patients with R/M HNSCC who received paclitaxel +/- cetuximab after progression under the EXTREME regimen in a large multicenter ret-rospective cohort. In the matched- paired population and in multivariate analysis, PC was associated with better PFS and OS than P alone. Our findings should be interpreted within the limitations of the study design. First, the retrospective na-ture of this investigation inherently introduces selection bias. We attempted to minimize this with propensity score- based matching. Although propensity matching may be effective in minimizing the impact of observable confounders, it may not address unobservable confounders that could influence survival.
The observed benefit was low with an improvement of 0.4 months and 1.3 months in median PFS and OS. Given the low benefit and the greater occurrence of side effects such as
TABLE 3 Safety All Grades p value Grade 3– 5 p value PC (n = 150) P(n = 91) PC(n = 150) P(n = 91) Anemia 67% 32% <0.0001 11% 7% 0.287 Neutropenia 37% 15% 0.0004 20% 7% 0.010 Febrile neutropenia 4% 0% 0.053 4% 0% 0.053 Thrombocytopenia 9% 7% 0.455 0% 0% Sensitive neuropathy 35% 34% 0.841 4% 3% 0.780 Asthenia 61% 60% 0.890 0% 0% Diarrhea 13% 5% 0.071 0% 0% Nausea 21% 3% 0.0001 0% 0% Increased transaminases 6% 1% 0.064 1% 0% 0.269 Folliculitis 53% 0% <0.0001 5% 0% 0.025 Dry skin 33% 1% <0.0001 0% 0% Digital cracks 25% 1% <0.0001 0% 0% Hypocalcemia 13% 0% 0.0003 1% 0% 0.269 Hypomagnesemia 44% 1% <0.0001 7% 0% 0.008
Bold values indicate differences that are statistically significant. Abbreviations: P, Paclitaxel; PC, Paclitaxel + cetuximab.
anemia, neutropenia, and cetuximab- related skin toxicities, it would be interesting to assess the impact on the quality of life of patients. In exploratory analysis, we found that patients who had TTP1 ≥6 months and cetuximab mainte-nance ≥3 months could benefit from cetuximab continuation in association with P. Duration of maintenance was the only predictive factor of survival for cetuximab maintenance. We hypothesized that patients who received the most cetuximab in first line could also benefit from the maintenance of thera-peutic pressure on EGFR. The fact that patients in poor gen-eral condition may benefit more from the association may be partly explained by the 2.6- fold higher response rate. Toxicity was as expected and manageable.
To the best of our knowledge, this is the largest cohort evaluating PC and the first to investigate whether the cetux-imab maintenance beyond the first line in HNSCC.
Median PFS, OS, and response rates were significantly lower than in studies that have already studied this associa-tion.8– 11 However, in the publications of Enokida et al. and
Hitt et al., all patients were treated in a first- line setting and no patient had already been exposed to cetuximab,8,9 which
could explain the difference. In the two retrospective stud-ies published by Péron and Fayette, patients could have been treated either in first or second line. P could also have been associated with other treatments such as carboplatin,5,10
which makes comparison with our study difficult in terms of efficacy. Borel et al. showed interesting results rechal-lenging with platinum +cetuximab chemotherapy regimens for patients progressing after at least 3 months of cetuximab maintenance, with a third of patients having an objective response and median PFS and OS of 6.5 and 11.2 months, respectively,13 suggesting that rechallenge with platinum
+cetuximab could be an option in this population. However, this study did not only study cetuximab continuation but re-challenge with platinum.
In the P + placebo arm in the BERIL- 1 phase II trial and in our study, median PFS was similar (3.5 months [95% CI 2.2– 3.7]). Median OS and response rate were slightly higher: 6.5 months [95% CI 5.3– 8.8] and 14%, but patients were se-lected for phase II (PS 0– 1) and PS is known to be a major prognostic factor, as shown in the present study.14
The mechanisms of anti- EGFR resistance are now bet-ter understood. Even though EGFR expression does not seem to be a predictive marker in HNSCC,15 the presence
of an EGFR variant, EGFRvIII, which is a truncated form of EGFR, is present in approximately 40% of cetuximab- resistant HNSCC.16,17 H- RAS mutations, overexpression of
RAS, amphiregulin, or TGF- β proteins are also escape routes and causes of resistance to EGFR inhibitors.16– 18 Further
studies are needed to evaluate the predictive role of these biomarkers.
Immune checkpoints inhibitors are becoming increasingly important in the management of R/M HNSCC. Nivolumab and
pembrolizumab, two programmed cell death- 1 (PD- 1) inhibi-tors, have become new options for patients who have progressed after EXTREME, leading to better OS and ORR than chemo-therapy, be it docetaxel, methotrexate, or cetuximab monother-apy.19,20 More recently, the Keynote 048 study showed that
first- line immunotherapy with pembrolizumab in monotherapy or in combination with platinum- based chemotherapy pro-vided better OS than EXTREME regimen.21 However, most
patients will experience progression after immunotherapy +/- chemotherapy and the question of subsequent therapy remains unsolved. Some studies suggest that chemotherapy after immu-notherapy is more efficient in lung cancers22 and HNSCC,23 the
latter having objective response rates of up to 30%, that is, well above historical cohorts as a third or fourth line of treatment.
In conclusion, our study suggests that the continuation of cetuximab beyond the first line could provide moderate but significant benefit in OS, PFS, and ORR when combined with paclitaxel. While immunotherapy has become the new standard of care in second line and will probably become the first line, most patients will experience progression, and some will need a subsequent line. PC could fill that gap for selected patients.
ACKNOWLEDGMENTS
Mr. Ray Cooke
CONFLICT OF INTEREST
C. Le Tourneau has participated in advisory boards of MSD, BMS, Astra Zeneca, Roche, Nanobiotix, Rakuten, GSK, Merck Serono. A. Daste has participated advisory boards of BMS, and Merck Serono. E. Saada- Bouzid has participated in advisory boards for BMS, Merck Serono, Astra Zeneca. The other authors have no conflict of interest to declare.
ORCID
Thomas Chevalier https://orcid.org/0000-0002-9536-3482
Amaury Daste https://orcid.org/0000-0001-5621-812X
Florence Huguet https://orcid.org/0000-0002-5302-5784
REFERENCES
1. Argiris A, Karamouzis MV, Raben D, et al. Head and neck cancer.
The Lancet. 2008;371:1695- 1709.
2. Vermorken JB, Trigo J, Hitt R, et al. Open- label, uncontrolled, multicenter phase II study to evaluate the efficacy and toxicity of cetuximab as a single agent in patients with recurrent and/ or metastatic squamous cell carcinoma of the head and neck who failed to respond to platinum- based therapy. J Clin Oncol. 2007;25:2171- 2177.
3. Vermorken JB, Mesia R, Rivera F, et al. Platinum- based chemo-therapy plus cetuximab in head and neck cancer. N Engl J Med. 2008;359:1116- 1127.
4. Grau JJ, Caballero M, Verger E, Monzó M, Blanch JL. Weekly pa-clitaxel for platin- resistant stage IV head and neck cancer patients.
5. Fayette J, Montella A, Chabaud S, et al. Paclitaxel is effective in relapsed head and neck squamous cell carcinoma: a retrospec-tive study of 66 patients at a single institution. Anticancer Drugs. 2010;21:553- 558.
6. Colevas AD, Yom SS, Pfister DG, et al. NCCN guidelines insights: head and neck cancers, version 1.2018. J Natl Compr Canc Netw. 2018;16:479- 490.
7. Rose WC. Therapeutic synergy of oral taxane BMS- 275183 and cetuximab versus human tumor xenografts. Clin Cancer Res. 2004;10:7413- 7417.
8. Hitt R, Irigoyen A, Cortes- Funes H, et al. Phase II study of the combination of cetuximab and weekly paclitaxel in the first- line treatment of patients with recurrent and/or metastatic squa-mous cell carcinoma of head and neck. Ann Oncol. 2012;23: 1016- 1022.
9. Enokida T, Okano S, Fujisawa T, et al. Paclitaxel plus cetuximab as 1st line chemotherapy in platinum- based chemoradiotherapy- refractory patients with squamous cell carcinoma of the head and neck. Front Oncol. 2018;8:339.
10. Péron J, Ceruse P, Lavergne E, et al. Paclitaxel and cetuximab combination efficiency after the failure of a platinum- based che-motherapy in recurrent/metastatic head and neck squamous cell carcinoma. Anticancer Drugs. 2012;23(9):996- 1001.
11. Jiménez B, Trigo JM, Pajares BI, et al. Efficacy and safety of weekly paclitaxel combined with cetuximab in the treatment of pretreated recurrent/metastatic head and neck cancer patients. Oral
Oncol. 2013;49:182- 185.
12. Therasse P, Arbuck SG, Eisenhauer EA, et al. New guidelines to evaluate the response to treatment in solid tumors. JNCI J Natl
Cancer Inst. 2000;92:205- 216.
13. Borel C, Regnier- Gavier O, Carinato H, et al. Interest to con-sider re- challenging by cetuximab and platinum containing reg-imen in recurrent head and neck cancer. Oncotarget. 2018;9: 37581- 37588.
14. Soulières D, Faivre S, Mesía R, et al. Buparlisib and paclitaxel in patients with platinum- pretreated recurrent or metastatic squa-mous cell carcinoma of the head and neck (BERIL- 1): a ran-domised, double- blind, placebo- controlled phase 2 trial. Lancet
Oncol. 2017;18:323- 335.
15. Licitra L, Störkel S, Kerr KM, et al. Predictive value of epidermal growth factor receptor expression for first- line chemotherapy plus cetuximab in patients with head and neck and colorectal cancer: Analysis of data from the EXTREME and CRYSTAL studies. Eur
J Cancer. 2013;49:1161- 1168.
16. Sok JC. Mutant epidermal growth factor receptor (EGFRvIII) con-tributes to head and neck cancer growth and resistance to egfr tar-geting. Clin Cancer Res. 2006;12:5064- 5073.
17. Tinhofer I, Klinghammer K, Weichert W, et al. Expression of Amphiregulin and EGFRvIII affect outcome of patients with squa-mous cell carcinoma of the head and neck receiving cetuximab- docetaxel treatment. Clin Cancer Res. 2011;17:5197- 5204. 18. The Cancer Genome Atlas Network. Comprehensive genomic
characterization of head and neck squamous cell carcinomas.
Nature. 2015;517:576- 582.
19. Ferris RL, Blumenschein G, Fayette J, et al. Nivolumab for recur-rent squamous- cell carcinoma of the head and neck. N Engl J Med. 2016;375:1856- 1867.
20. Mehra R, Seiwert TY, Gupta S, et al. Efficacy and safety of pembrolizumab in recurrent/metastatic head and neck squamous cell carcinoma: pooled analyses after long- term follow- up in KEYNOTE- 012. Br J Cancer. 2018;119:153- 159.
21. Burtness B, Harrington KJ, Greil R, et al. LBA8_PRKEYNOTE- 048: Phase III study of first- line pembrolizumab (P) for recurrent/meta-static head and neck squamous cell carcinoma (R/M HNSCC). Ann
Oncol. 2018;29: https://doi.org/10.1093/annon c/mdy424.045.
22. Park SE, Lee SH, Ahn JS, et al. Increased response rates to sal-vage chemotherapy administered after PD- 1/PD- L1 inhibitors in patients with non- small cell lung cancer. J Thorac Oncol. 2018;13: 106- 111.
23. Saleh K, Daste A, Martin N, et al. Response to salvage chemother-apy after progression on immune checkpoint inhibitors in patients with squamous cell carcinoma of the head and neck. J Clin Oncol. 2018;36:6015.
SUPPORTING INFORMATION
Additional supporting information may be found online in the Supporting Information section.
How to cite this article: Chevalier T, Daste A,
Saada- Bouzid E, et al. Cetuximab combined with paclitaxel or paclitaxel alone for patients with recurrent or metastatic head and neck squamous cell carcinoma progressing after EXTREME. Cancer Med. 2021;00:1–12. https://doi.org/10.1002/cam4.3953