HAL Id: hal-00330331
https://hal.archives-ouvertes.fr/hal-00330331
Submitted on 8 Nov 2007
HAL is a multi-disciplinary open access
archive for the deposit and dissemination of
sci-entific research documents, whether they are
pub-lished or not. The documents may come from
teaching and research institutions in France or
abroad, or from public or private research centers.
L’archive ouverte pluridisciplinaire HAL, est
destinée au dépôt et à la diffusion de documents
scientifiques de niveau recherche, publiés ou non,
émanant des établissements d’enseignement et de
recherche français ou étrangers, des laboratoires
publics ou privés.
phytoplanktonic communities in the Southeast Pacific
(BIOSOPE cruise)
S. Duhamel, T. Moutin, France van Wambeke, B. van Mooy, P. Rimmelin,
Patrick Raimbault, Hervé Claustre
To cite this version:
S. Duhamel, T. Moutin, France van Wambeke, B. van Mooy, P. Rimmelin, et al.. Growth and specific
P-uptake rates of bacterial and phytoplanktonic communities in the Southeast Pacific (BIOSOPE
cruise). Biogeosciences, European Geosciences Union, 2007, 4 (6), pp.941-956. �hal-00330331�
© Author(s) 2007. This work is licensed under a Creative Commons License.
Growth and specific P-uptake rates of bacterial and phytoplanktonic
communities in the Southeast Pacific (BIOSOPE cruise)
S. Duhamel1,2, T. Moutin1, F. Van Wambeke2, B. Van Mooy3, P. Rimmelin1, P. Raimbault1, and H. Claustre4
1Aix-Marseille Universit´e, Laboratoire d’Oc´eanographie et de Biog´eochimie, LOB-UMR 6535 CNRS, OSU/Centre
d’Oc´eanologie de Marseille, 13288 Marseille, Cedex 09, France
2Aix-Marseille Universit´e, Laboratoire de Microbiologie, G´eochimie et Ecologie Marines, LMGEM-UMR 6117 CNRS,
OSU/Centre d’Oc´eanologie de Marseille, 13288 Marseille, Cedex 09, France
3Department of Marine Chemistry and Geochemistry, Wood Hole Oceanographic Institution, MS #4, Wood Hole, MA 02543,
USA
4CNRS, Laboratoire d’oc´eanographie de Villefranche, 06230 Villefranche-sur-Mer, France; Universit´e Pierre et Marie
Curie-Paris 6, Laboratoire d’oc´eanographie de Villefranche, 06230 Villefranche-sur-mer, France Received: 15 June 2007 – Published in Biogeosciences Discuss.: 27 June 2007
Revised: 18 September 2007 – Accepted: 18 October 2007 – Published: 8 November 2007
Abstract. Predicting heterotrophic bacteria and
phytoplank-ton specific growth rates (µ) is of great scientific interest. Many methods have been developed in order to assess bac-terial or phytoplankton µ. One widely used method is to estimate µ from data obtained on biomass or cell abundance and rates of biomass or cell production. According to Kirch-man (2002), the most appropriate approach for estimating µ is simply to divide the production rate by the biomass or cell abundance estimate. Most methods using this approach to estimate µ are based on carbon (C) incorporation rates and C biomass measurements. Nevertheless it is also possible to estimate µ using phosphate (P) data. We showed that par-ticulate phosphate (PartP) can be used to estimate biomass and that the P uptake rate to PartP ratio can be employed to assess µ. Contrary to other methods using C, this estimator does not need conversion factors and provides an evaluation of µ for both autotrophic and heterotrophic organisms. We report values of P-based µ in three size fractions (0.2–0.6; 0.6–2 and >2 µm) along a Southeast Pacific transect, over a wide range of P-replete trophic status. P-based µ values were higher in the 0.6–2 µm fraction than in the >2 µm fraction, suggesting that picoplankton-sized cells grew faster than the larger cells, whatever the trophic regime encountered. Picoplankton-sized cells grew significantly faster in the deep chlorophyll maximum layer than in the upper part of the photic zone in the oligotrophic gyre area, suggesting that pi-coplankton might outcompete >2 µm cells in this particular high-nutrient, low-light environment. P-based µ attributed to free-living bacteria (0.2-0.6 µm) and picoplankton (0.6– 2 µm) size-fractions were relatively low (0.11±0.07 d−1and Correspondence to: S. Duhamel
(solange.duhamel@univmed.fr)
0.14±0.04 d−1, respectively) in the Southeast Pacific gyre,
suggesting that the microbial community turns over very slowly.
1 Introduction
A fundamental aim in ecology and hence, biological oceanography and limnology, is to understand and pre-dict the abundance of organisms and their temporal change (Banse, 2002). An assessment of the ecological role of both autotrophic and heterotrophic marine micro-organisms depends, to a significant extent, on estimates of their spe-cific growth rate (µ) (Azam et al., 1983). Bacterial or primary production is the synthesis of bacteria or phy-toplankton biomass, respectively. Production can be ex-pressed as the rate of synthesis of cells or cell mass: production=µ×biomass, where µ is the specific growth rate of the population expressed in units of inverse time t−1 (Ducklow, 2000). Phytoplankton µ estimates vary widely from values of around 0.1–0.3 d−1 (Letelier et al., 1996; Mara˜non et al., 2000, 2005) to 1–2 d−1(Laws et al., 1987; Quevedo and Anadon, 2001). Bacterial µ estimates also vary widely, from very low values 0.004–0.25 d−1 (Sherr et al., 2001; Van Wambeke, 2007b) to higher values of around 2– 10 d−1 (Ducklow, 1983; Jones et al., 1996). Studies
com-paring bacterial and phytoplankton µ are scarce and show significant differences between bacterial and phytoplankton
µ(Jones et al., 1996).
Numerous methods have been developed to measure µ (Brock, 1971). Direct and indirect methodologies of vary-ing accuracy have been used to estimate phytoplankton and
heterotrophic bacterial µ. The two most common direct methods, applicable to both heterotrophic bacteria and phy-toplankton, are (1) to observe the frequency of dividing cells (Hagstrom et al., 1979) and (2) the dilution technique (Landry and Hassett, 1982; Quevedo and Anadon, 2001). Direct methods are difficult to set up on board so microbial growth rates are commonly calculated from production and standing stock data (Ducklow, 2000). According to Kirch-man (2002), the most appropriate approach for estimating µ of microbial assemblages is the simplest, that is, dividing the production rate by the biomass estimate (B). This ratio called the “specific uptake rate” (Vsp)is a carbon (C), nitrogen (N) or phosphate (P)-based measurement of µ corresponding to the cell specific or biomass specific uptake of C, N or P (Lip-schultz, 1995; Dickson and Wheeler, 1995; Ducklow, 2000). Vspis an expression of the µ. These two parameters are not necessarily equal and Vspmust be considered as an estimator of µ. Both µ and Vspare determined by resource limitation, temperature and predation (Brock, 1971; Thingstad, 2000). The most common indirect methods for measuring phyto-plankton µ are 14C-pigment labelling (Redalje and Laws, 1981; Welschmeyer et al., 1991; Jones et al., 1996; Cail-liau et al., 1996), cell cycle analysis (Vaulot, 1992; Liu et al., 1999) and the use of equations linking autotrophic produc-tion (AP) and autotrophic cell abundance or biomass (AB) (Smith et al., 2000; Mara˜non, 2005). In such equations, AP is deduced from NaH14CO3incorporation rate
measure-ments (Steemann-Nielsen, 1951) in the particulate fraction (i.e. biomass production) which does not include significant losses from respiration or excretion, when short term incu-bations are processed. The most common indirect method for studying heterotrophic bacterial µ is the use of equa-tions linking heterotrophic bacterial production (HBP) and heterotrophic bacterial cell abundance or biomass (HBB). In such equations, HBP is generally deduced from the incor-poration of3H-thymidine (Fuhrman and Azam, 1980, 1982) and3H-leucine (Kirchman et al., 1985) into DNA and pro-teins, respectively, with appropriate conversion factors for biomass production. More recently, measurements of the in-corporation rates of33PO4 into phospholipids (particularly
phosphatidylglycerol: PG and phosphatidylethanolamine: PE) specific to bacterioplankton have been used (Van Mooy et al., 2006).
Phytoplankton µ is frequently estimated by dividing AP (measured using the 14C method) by various AB estima-tors such as Chlorophyll a (Chla), particulate organic car-bon (POC) and C content using microscopy or flow cytome-try measurements (Eppley, 1972; Vadstein et al., 1988; Mal-one et al., 1993; Mara˜non et al., 2000, 2005; Moreira-Turcq, 2001). The use of Chla and POC as AB proxies is debat-able (Le Floc’h et al., 2002; Sobczak et al., 2002; Huot et al., 2007) and C content estimates are dependant on con-version factors. These concon-version factors can vary greatly between studies. Similarly, the evaluation of bacterial µ based on the HBP to HBB ratio requires the use of
sev-eral conversion factors (to convert the incorporation of3 H-leucine or3H-thymidine to C equivalents and to convert cell number to biomass equivalents). These conversion factors vary with different studies (Riemann et al., 1990). Further-more, method comparisons can show significant differences between µ estimates (Laws et al., 1984).
If µ=production/biomass, then there is a direct relation-ship between incorporation rate per cell and µ (Kirchman, 2002). Although biomass and production estimators are usu-ally expressed in terms of C, it is also possible to express them in terms of N or P as C, N and P are major cellular constituents linked via the “Redfield ratio” (Redfield, 1963; Berman, 1980; Laws et al., 1984). PartP is released from decaying material more efficiently than C and N (Loh and Bauer, 2000) and seems to be decomposed or remineralized essentially at the same rate as chlorophyll (Menzel and Ry-ther, 1964). As a consequence, in the open ocean, the propor-tion of detrital P in PartP is low (Faul et al., 2005). Phosphate uptake rates are commonly measured using the 32P or 33P method, which quantifies the amount of P that is taken up by both heterotrophic and autotrophic cells. Measuring the dis-solved inorganic P (DIP) uptake rates provides an estimate for planktonic production, assuming DIP is the sole source of P and there is no, or negligible luxury uptake (Thingstad et al., 1996). Thus, particulate P (PartP) and P uptake rate can be used as estimators of planktonic biomass and production, respectively.
We estimated µ from production to biomass ratios ex-pressed in terms of P and discussed the bias associated with using C and P-based µ estimations. Combining P uptake rates and PartP measurements with size fractionations, we determined the DIP specific uptake rate (VspDIP)in three size fractions corresponding to heterotrophic bacteria, picophyto-plankton and nano-microphytopicophyto-plankton (0.2–0.6; 0.6–2 and
>2 µm, respectively), following an East-West transect along the Southeast Pacific ocean. This area presents a gradient in trophic conditions, from the extremely oligotrophic South-east Pacific gyre, the largest and most poorly investigated province of the world ocean (Claustre and Maritorena, 2003; Claustre et al., 20071), to the highly productive Chilean up-welling region. The measurement of VspDIP in the different fractions enabled us to compare bacterial to phytoplankton µ using the same method and enabled us to study the variation in dynamics between 2 major groups of phytoplankton.
1Claustre, H., Sciandra, A., and Vaulot, D.: Introduction to the
special section: bio-optical and biogeochemical conditions in the South East Pacific in late 2004 – the BIOSOPE cruise, Biogeo-sciences, in preparation, 2007.
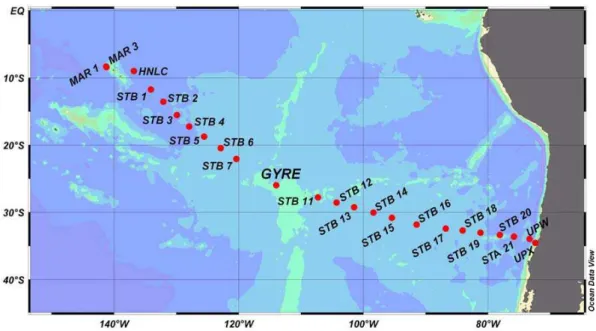
Fig. 1. Station names and locations of the BIOSOPE cruise transect in the South East Pacific Ocean (October–December 2004). MAR 1 and MAR 3 (in the vicinity of Marquesas Islands), HNLC (High Nutrient Low Chlorophyll area), GYRE (the central part of the Southeast Pacific gyre), and UPW and UPX (the Chilean upwelling) are long stations (3–4 days) abbreviated according their location; STB1-STA21 are short stations (1 day).
2 Materials and methods
2.1 Station locations, sample collection and hydrological characteristics
This work was conducted during the BIOSOPE (BIogeo-chemistry and Optics SOuth Pacific Experiment) cruise in the Southeast Pacific Ocean (between 146.36◦W and 72.49◦W; Fig. 1). The cruise was carried out aboard “l’Atalante” from October to December 2004. High resolution profiles of temperature, conductivity, salinity, oxygen and fluores-cence were obtained using a CTDO profiler (Seabird 911 Plus) from a depth of 0 to 500 m (See Claustre et al. and Ras et al., 2007, for hydrodynamical entities, hydrographic conditions and pigment distribution). Seawater samples were collected at 6 different depths corresponding to 50, 25, 15, 7, 3 and 1% surface irradiance, respectively. Samples were collected in 12 l Niskin bottles attached to a rosette CTD sys-tem, at 09:00 a.m. (local time). Subsamples were collected without pre-filtration, into clean, sample-rinsed polycarbon-ate bottles.
2.2 Analytical methods
Particulate phosphate (PartP) was measured using the Strick-land and Parsons procedure (1972) for standard DIP, follow-ing high-temperature persulfate wet-oxidation at 120◦C and 1 bar (Pujo-Pay and Raimbault, 1994). Sequential filtration was carried out on 1 to 1.2 l samples through different poros-ity polycarbonate filters (0.2, 0.6, and 2 µm; 47 mm) using Sartorius systems and very low vacuum (drop by drop). The
0.2 and 0.6 µm filters in the lower Sartorius system were sep-arated by a nylon separator (NY8H04700, Millipore) previ-ously treated using persulfate wet-oxidation to lower blank values. Immediately after filtration, the filters (and the sepa-rator for the 0.2 µm filter) were put into 20 ml Teflon bottles. 2.5 ml of reagent (140 ml of NaOH 1.5 M, 30 g of H3BO3,
360 ml of demineralised water) was added and the mineral-ization processed (autoclave 30 min, 1 bar). After cooling down to ambient temperature, DIP was measured in the same bottles. All reagents were prepared with pro analysis Mer-ckTM Reagent Grade chemicals and with Milli-QTM high purity demineralised water. All utensils were washed with 10% hydrochloric acid and rinsed three times with deminer-alised water.
Particulate organic carbon concentration was determined by the wet-oxidation procedure (Raimbault et al., 1999), following the filtration of 1.2 l of seawater through 0.2 µm teflon membranes.
Chlorophyll a (Chl a) concentration was determined by the serial filtration of 1 to 1.2 l samples following the same filtra-tion method as for PartP. Immediately after filtrafiltra-tion, the fil-ters were put in cryotubes with 5 ml of methanol for pigment extraction (30 min, 4◦C) (Herbland et al., 1985). The
fluo-rescence was measured using a Turner designs 10-AU-005-CE fluorimeter equipped with a chlorophyll a Kit (F4T45.B2 lamp) according to Welschmeyer (1994).
Picophytoplankton (Prochlorococcus, Synechococcus and picophytoeukaryotes) and bacterial abundance were deter-mined according to Grob et al. (2007) using a FACSCal-ibur (Becton Dickinson) flow cytometer. Picophytoplankton
abundance was determined in situ on fresh samples while bacterioplankton samples were fixed with a final concentra-tion of either 1% paraformaldehyde or 0.1% glutaraldehyde and frozen in liquid nitrogen. Samples were then processed according to Marie et al. (2000a,b). At each sampling depth, defined by the Chla and P and C uptake rates measurements, 2 mL samples were filtered through 0.6 µm polycarbonate filters. The filtrate was then analysed using flow cytometry and compared to the total in the corresponding sample.
Carbon and phosphate uptakes were determined using the 33P/14C dual labelling method (Duhamel et al., 2006). Duplicate samples (300 ml) were collected into sample-rinsed, polycarbonate bottles (Nalgene) for each sampling depth. An additional duplicate sample (300 ml) of surface water was incubated with 300 µl of HgCl2 (20 g l−1) to
act as a control for non-biological assimilation (Kirkwood 1992). The samples were inoculated with 1080 kBq carrier-free33P (<40 pmol l−1final concentration – orthophosphate
in dilute hydrochloric acid; Amersham BF 1003; half-life 25.383±0.040 days; Duhamel et al., 2006), and 3.7 MBq14C (bicarbonate aqueous solution; Amersham CFA3; half-life 5700±30 years; Duhamel et al., 2006). Samples were in-cubated under simulated conditions for 4 to 5 h. Incuba-tion boxes equipped with light filters (nickel screens) were used to reproduce the light level at the sample depths (50 – 25 – 15 – 7 – 3 – 1% of transmitted light). Following incubation, 600 µl of KH2PO4(10 mmol l−1)was added to
each flask in order to stop labelled DIP assimilation. Sam-ples were kept in the dark to stop DIC uptake. Fractions of 50 ml were filtered through 25 mm polycarbonate mem-branes (0.2, 0.6 and 2 µm) which had been placed on GF/F filters soaked with saturated KH2PO4, using a low-pressure
suction (<0.2 bars). When all samples were filtered, the pres-sure was increased to 0.6 bars for 5 s in order to eliminate un-incorporated33P. Filters were placed into scintillation vials (Wheaton low-potassium 6 ml glass-clear vials with screw-cap foil liner) with 150 µl of HCl (0.5 mol l−1)in order to eliminate any un-incorporated14C. After 12 h, 6 ml of scin-tillation liquid (Ultimagold MV scinscin-tillation liquid, Packard) was added to each vial before the first count. Counting (count per minute - cpm) was carried out on a Packard Tri-Carb® 2100TR scintillation counter. In order to separate the activity due to33P from that of14C, we applied the method using the different half-lives of the two isotopes (For more details, see Duhamel et al., 2006). A second count was made a year later, samples having been preserved in the dark at room tempera-ture. C and P uptake rate measurements in each size fraction (0.2–0.6; 0.6–2 and >2 µm) were obtained using difference calculations.
Bacterial production was determined by [3H]-leucine in-corporation using the centrifugation method (Smith and Azam, 1992) according to Van Wambeke et al. (2007b). A factor of 1.5 kg C mol leucine−1was used to convert the in-corporation of leucine to carbon equivalents, assuming no isotopic dilution (Kirchman, 1993).
2.3 Daily rates
The daily C uptake rates have been calculated using the method of Moutin et al. (1999). The model enables a con-version factor to be calculated which permits net hourly DIC uptake rates (nmol l−1h−1)to be transformed into net daily
rates (nmol l−1d−1). The model takes into account the ge-ographical position (latitude and longitude), the sampling date, the time of dawn, incubation start time and the time the incubation ended (GMT). The model of Moutin et al. (1999) that previously took theoretical solar radiation into account has been modified to take into account the surface irradiance measured on board.
Daily P uptake rates have been calculated simply by multi-plying the hourly rate by 24. Indeed, in several studies (Perry and Eppley, 1981; Moutin et al., 2002), P uptake was shown to be constant over 24 h.
2.4 Specific uptake rate estimates
Specific uptake rates (Vsp)have been calculated by divid-ing heterotrophic bacterial production (HBP), C uptake rates (VDIC)or P uptake rates (VDIP)by heterotrophic bacterial
biomass (HBB), phytoplankton biomass (AB) and particu-late P (PartP), respectively. VspDIP corresponds to the VDIP
to PartP ratio, VspDIC corresponds to the VDIC to AB ratio,
HBP:HBB corresponds to the HBP to HBB ratio. A conver-sion factor of 10 fgC cell−1(Christian and Karl, 1994; Caron
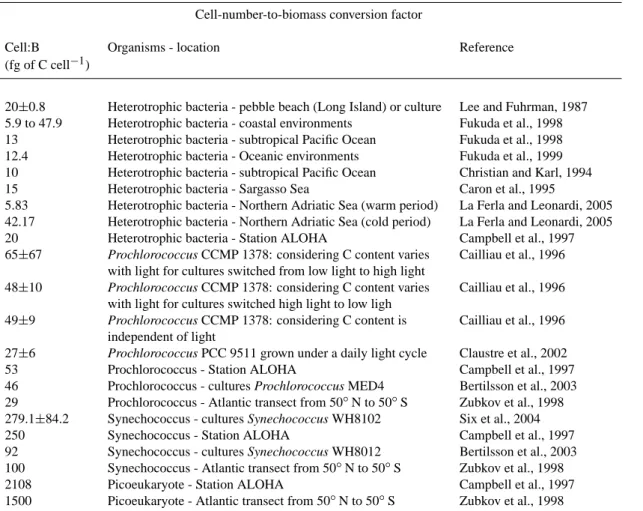
et al., 1995) has been used to convert heterotrophic bacte-rial abundance (counted by flow cytometry) to C equivalent. AB has been calculated using two methods. The first one uses a cell-number-to-biomass conversion factor. We chose the Campbell et al. (1997) estimates for Prochlorococcus,
Synechococcus and Picoeukaryotes (Table 1). The second
method uses a Chla-to-biomass conversion factor. For sta-tions outside the gyre, we chose 70 gC gChla−1, the average value found for subtropical Atlantic Ocean total phytoplank-ton (Veldhuis and Kraay, 2004). For stations inside the gyre, we used a Chla-to-biomass conversion factor varying with PAR (Photosynthetically Active irradiance): 185, 120, 90, and 20 gC gChla−1for 50 and 25%, 15%, 7%, and 3 and 1%
of PAR, respectively. These factors were chosen in accor-dance with the results obtained by Veldhuis and Kraay (2004) at their most oligotrophic station in the Atlantic tropical gyre. The VspDIP have been calculated for four size fractions: 0.2-0.6; 0.6-2; >2 and >0.6 µm. We will develop ar-guments to show that they correspond to heterotrophic bacteria (VspDIP<0.6), picophytoplankton (VspDIP 0.6−2), nano-micophytoplankton (VspDIP >2) and total phytoplankton (VspDIP >0.6), repectively. Vsp are expressed as daily rates (d−1) so are comparable with the values found in the literature.
Table 1. Review of values of biovolume-to-biomass and cell-number-to-biomass conversion factors. Biovolume-to-biomass conversion factor
Biovolume:B Organisms - location Reference
(g of C cm−3)
0.121 Bacteria seawater or cultures Watson et al., 1977
0.38±0.05 Heterotrophic bacteria - pebble beach (Long Island) or culture Lee and Fuhrman, 1987 Cell-number-to-biomass conversion factor
Cell:B Organisms - location Reference
(fg of C cell−1)
20±0.8 Heterotrophic bacteria - pebble beach (Long Island) or culture Lee and Fuhrman, 1987 5.9 to 47.9 Heterotrophic bacteria - coastal environments Fukuda et al., 1998 13 Heterotrophic bacteria - subtropical Pacific Ocean Fukuda et al., 1998 12.4 Heterotrophic bacteria - Oceanic environments Fukuda et al., 1999 10 Heterotrophic bacteria - subtropical Pacific Ocean Christian and Karl, 1994
15 Heterotrophic bacteria - Sargasso Sea Caron et al., 1995
5.83 Heterotrophic bacteria - Northern Adriatic Sea (warm period) La Ferla and Leonardi, 2005 42.17 Heterotrophic bacteria - Northern Adriatic Sea (cold period) La Ferla and Leonardi, 2005
20 Heterotrophic bacteria - Station ALOHA Campbell et al., 1997
65±67 Prochlorococcus CCMP 1378: considering C content varies Cailliau et al., 1996 with light for cultures switched from low light to high light
48±10 Prochlorococcus CCMP 1378: considering C content varies Cailliau et al., 1996 with light for cultures switched high light to low ligh
49±9 Prochlorococcus CCMP 1378: considering C content is Cailliau et al., 1996 independent of light
27±6 Prochlorococcus PCC 9511 grown under a daily light cycle Claustre et al., 2002
53 Prochlorococcus - Station ALOHA Campbell et al., 1997
46 Prochlorococcus - cultures Prochlorococcus MED4 Bertilsson et al., 2003 29 Prochlorococcus - Atlantic transect from 50◦N to 50◦S Zubkov et al., 1998 279.1±84.2 Synechococcus - cultures Synechococcus WH8102 Six et al., 2004
250 Synechococcus - Station ALOHA Campbell et al., 1997
92 Synechococcus - cultures Synechococcus WH8012 Bertilsson et al., 2003 100 Synechococcus - Atlantic transect from 50◦N to 50◦S Zubkov et al., 1998
2108 Picoeukaryote - Station ALOHA Campbell et al., 1997
1500 Picoeukaryote - Atlantic transect from 50◦N to 50◦S Zubkov et al., 1998
3 Results
3.1 Cytometry data
Bacteria were separated from phytoplankton by filtering through 0.6 µm filters so as to determine bacterial VspDIP in the 0.2–0.6 µm fraction. The percentages of bacterial cells passing through a 0.6-µm-filter were counted using flow cytometry in order to assess the accuracy of the re-sults. On comparing total and <0.6 µm sample counts, we found that on average, 91±10% of the heterotrophic bac-teria passed through the 0.6-µm-filter whatever the trophic regime (n=90; all euphotic-layer depths included). This value was in the same range as those obtained in other stud-ies (∼80%; Obernosterer et al., 2003). Flow cytometry
mea-surements revealed that Prochlorococcus (when detectable),
Synechococcus and Picoeucaryotes cells had an average size
of 0.68±0.08 µm; 0.86±0.1 µm and 1.74±0.13 µm, respec-tively over the entire transect (Results from Grob et al., 2007). The average cell size of Synechococcus found at the upwelling stations was 1.16±0.02 µm. Despite of this, cy-tometry counts showed that 34±24% of the Prochlorococcus cells and 3±5% of the Synechococcus cells were found in the
<0.6 µm fraction.
3.2 Evaluating the use of particulate phosphate as an esti-mator of living biomass
Figure 2 shows a typical example of the vertical distribution of PartP and Chla concentrations compared to the vertical
Fig. 2. Example of vertical distribution of biological properties at station STB4 (127.97◦W; 17.23◦S): particulate phosphate (PartP), chlorophyll a (Chla), total phytoplankton counted by flow cytom-etry: Prochlorococcus + Synechococcus + picoeucaryotes (phyto), total cells (heterotrophic bacteria + phytoplankton) counted by flow cytometry (Total cells) and total C biomass estimates based on cell counts (AB+HBB).
distribution of cell counts by flow cytometry and total C biomass estimate based on cell counts (AB+HBB). In the up-per 80 m, PartP concentrations were fairly constant, varying between 10.0 and 10.4 nmol l−1from the surface to a depth of 7% PAR. PartP concentrations decreased to 5.3 nmol l−1 at the depth of 1% PAR while Chla concentrations increased from 0.05 to 0.19 µg l−1 from the surface waters down to 1% of PAR, respectively. In contrast to Chla, PartP did not show a deep concentration maximum (Fig. 2). Phytoplankton cell counts using flow cytometry showed an increase from 1.1×10⁵ to 2.8×10⁵ cells ml−1 from surface water to the depth of 3% of PAR and a decrease to 1.3×10⁵ cells ml−1 at the depth of 1% of PAR. In the same way, total cytometric counts (bacteria + phytoplankton) showed an increase from 6.8×10⁵to 8.5×10⁵cells ml−1from the surface water to the
depth of 15% of PAR and a decrease to 6.5×10⁵cells ml−1
at the depth of 1 % of PAR. The total C biomass (AB+HBB) estimated from cell counts using flow cytometry and con-version factors from Campbell et al. (1997) for the different groups of organisms (heterotrophic bacteria,
Prochlorococ-cus, Synechococcus and picoeukaryotes) increased between
50 and 3% of PAR, ranging from 1.68 to 2.64 µmol C l−1, be-fore decreasing to 1.81 µmol C l−1. Variations in PartP con-centration throughout the euphotic zone are closer to that of
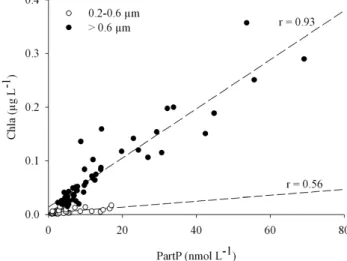
Fig. 3. Relations between Chlorophyll a (Chla) and particulate phosphate (PartP) at depth corresponding to a range of PAR lev-els between 50% and 15%, for two size fractions: 0.2–0.6 µm and
>0.6 µm.
cell concentration and total C biomass, estimate based on cell counts, than to Chla concentration.
Chla is largely used to estimate phytoplankton biomass (Trembaly and Legendre, 1994; Uitz et al., 2006). How-ever, as illustrated in Fig. 2, the C:Chla ratio varies with light (Taylor et al., 1997). In comparing biomass estimates to Chla concentration only data between 50 and 15% of transmitted light have been considered to avoid any bias associated with photoacclimatation. PartP and Chla data were compared in the <0.6 and >0.6 µm fractions (Fig. 3) in order to verify that the PartP in these fractions was representative of the bac-teria and phytoplankton biomasses, respectively. Most of the PartP in the >0.6 µm fraction correlated to Chla, supporting the hypothesis that it is essentially made up of phytoplankton biomass (Fig. 3). The relationship between Chla and PartP in the 0.2–0.6 µm fraction was less significant than in the
>0.6 µm fraction (r=0.56, P<0.001; and r=0.93, P<0.001, respectively; Fig. 3), indicating that PartP variability (69% and 14%, respectively) is not related to Chla variability in the 0.2–0.6 µm fraction. Indeed, the Prochlorococcus cells that passed through the 0.6 µm filter contributed to PartP and Chla concentrations in the 0.2–0.6 µm fraction, but the cor-relation between these two parameters is comparatively weak and indicates that it is mainly free-living bacteria (i.e. organ-isms that do not contain Chla) that contribute to PartP in this
<0.6 µm fraction.
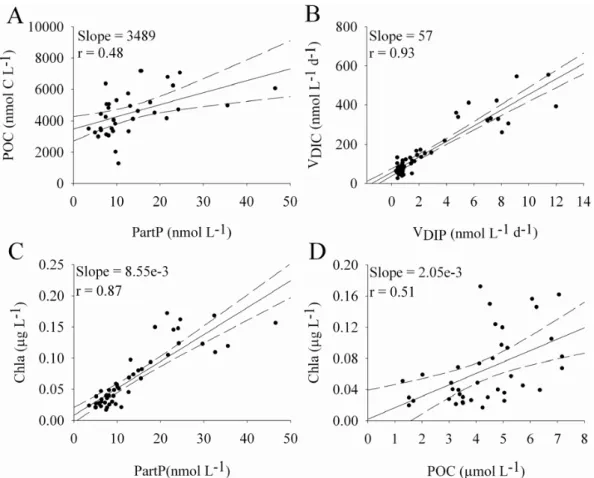
Menzel and Ryther (1964) determined the detrital propor-tion of PartP using a regression between PartP, particulate C and Chla, for the same group of samples. We made such comparisons (Fig. 4a, c, d; eutrophic stations have been omit-ted to avoid regressions being drawn by high values.). The correlation between Chla and PartP concentration data was better (r=0.87, p<0.001, Fig. 4c) than that between Chla and
Fig. 4. Relations between particulate carbon (POC) and phosphate (PartP) (A), between carbon (VDIC)and phosphate (VDIP)uptake rates
(B) between chlorophyll a (Chla) and PartP (C) and between Chla and POC (D). Data from 50 to 15% of PAR and between HNLC and STB18 stations. “slope” and “r” corresponds to the slope and the regression coefficient, respectively. The dotted lines correspond to the 95% confident range of the regression line (full line).
POC (r=0.51, p<0.05, Fig. 4d), supporting the hypothesis that PartP is a better indicator of living biomass than POC. As found by Menzel and Ryther (1964), the regressions be-tween PartP and POC, when extrapolated toward the origin, indicated significant amounts of C in the absence of P whilst the regression between PartP and Chla intercepted at the ori-gin, indicating that Chla and PartP were decomposed or min-eralized at essentially the same rate, whilst POC was more refractory. The comparison of the regression slope between POC and PartP concentration and between VDICand VDIP
(Fig. 4a, b) also supports the hypothesis that P is more rapidly mineralized from dead material than C. Indeed, if POC and PartP are representative of C and P living biomass, then the C to P incorporation rate ratio should be in the same range as the POC to PartP ratio. The regression slope between POC and PartP concentration was 3489 (Fig. 4a) and 57 between VDICand VDIP (Fig. 4b). This difference can be explained
by the longer turnover rates of POC than those of PartP.
3.3 Evaluation of the use of VspDIPas an estimator of bacteria and phytoplankton growth rates
We compared euphotic-layer averaged values of Vsp ob-tained from different methods (Fig. 5). For bacteria, we compared the values of VspDIP <0.6and of HBP:HBB (Fig. 5a). VspDIP <0.6values were 1.2 to 9.5 times higher than HBP:HBB values in productive areas (MAR-STB6 and STB15-UPX, re-spectively) while in the centre of the gyre (STB7-STB14), VspDIP <0.6values were 1.2 to 2.2 times lower than HBP:HBB values. Between MAR and STA21 stations, HBP:HBB values were quite low and constant (0.11±0.04 d−1) while
VspDIP <0.6values varied widely from 0.04 to 1.11 d−1
depend-ing the trophic regime encountered. As a consequence, the correlation between HBP:HBB ratio and VspDIP <0.6 values, even excluding the “original” upwelling sites, was not sig-nificant (r2=0.08, p>0.05). For phytoplankton, we compared the values of VspDIC >0.6 and of VspDIP >0.6. VspDIC >0.6 can be obtained using a Chla-to-biomass or cell-number-to-biomass conversion factor. Using cell-number-to-biomass conversion factors according to Campbell et al. (1994, 1997) we found
Fig. 5. (A) Bacterial specific uptake rates calculated from HBP:HBB ratio and VspDIP in the fraction <0.6 µm. (B) Phyto-plankton specific uptake rates calculates from VspDIC and VspDIP in the fraction >0.6 µm. Average specific uptake rates values on the photic zone. Autotrophic biomass calculated from Chla using a C:Chla conversion factors as describe in the Materials and Methods section. Heterotrophic bacterial biomass calculated from bacterial cells abundance converted to C equivalent using a conversion factor of 10 fgC cell−1.
VspDIC values on average 2 and 12 times higher than using a Chla-to-biomass conversion factors. Greatest differences were found in meso- and eutrophic areas. Using the Chla-to-biomass conversion factors from Veldhuis and Kraay (2004), VspDIC >0.6values were 1 to 4 and 0.6 to 1.8 times higher than VspDIP >0.6in the gyre and in the meso- and eutrophic areas, respectively (Fig. 5b). The major bias linked with the de-termination of VspDICis the choice of conversion factor. In-deed, when considering the extreme values of the C:Chla ra-tio in the surface layer in the equatorial Pacific ocean (40 and 200 g C Chla−1, Chavez et al., 1996), values of VspDICcan vary up to a factor 5. In the same way, we calculated VspDICusing different cell-number-to-biomass conversion factors. Using conversion factors provided by Campbell et al. (1997) or by
Fig. 6. Vertical and longitudinal distribution of the daily specific uptake of DIP (VspDIP)along the BIOSOPE transect for four size classes: 0.2–0.6; 0.6–2; >0.6 and >2 µm.
Bertilsson et al. (2003) for Prochlorococcus, Synechococcus and picoeucaryotes (see Table 1), we found that VspDICvalues were on average 20% higher using Campbell’s value. 3.4 Estimates of bacteria and phytoplankton VspDIP in the
Southeast Pacific gyre
The different size fractions showed significant vertical and longitudinal variations of VspDIPalong the transect (P<0.001; Fig. 6). Highest values were found in productive areas while lower values were found in the upper part of the photic zone in the gyre area. In productive areas, the 0.2–0.6 µm fraction,
assumed to be composed mostly of free-living heterotrophic bacteria, showed the highest euphotic zone mean values of VspDIP (0.6±0.3 to 3±1 d−1) while in the gyre area, the
0.6–2 µm fraction, assumed to consist of picophytoplank-ton cells, showed the highest euphotic zone mean values of VspDIP (0.10±0.04 to 0.20±0.11 d−1). Whatever the station, the >2 µm fraction had the lowest VspDIPeuphotic zone mean values (0.02±0.07–0.6±0.2 d−1). The variation of VspDIPwith depth in the 0.6–2 µm fraction was quite different from that of the >2 µm fraction, particularly in the western part of the gyre area. Here, the >2 µm fraction showed fairly con-stant VspDIP values with depth (no significant difference was found between VspDIP values in the deep chlorophyll max-imum layer (DCML) and the upper layer of the euphotic zone, P=0.161), while the 0.6–2 µm fraction exhibited sig-nificantly higher values of VspDIP in the DCML (P<0.001). The smaller size fraction (0.2–0.6 µm) exhibited quite low values throughout the euphotic zone in the oligotrophic area (0.11±0.07 d−1)and no significant tendency with depth was observed (P<0.001).
4 Discussion
Quantifying heterotrophic bacteria and phytoplankton µ in the ocean is vitally important for understanding many oceanographic processes since µ and mortality of individual populations control the ultimate composition of the assem-blage (Banse, 1991). This, in turn, controls a large number of ecosystem properties, such as export of organic matter, nu-trient utilization and production patterns. Understanding µ is critical to our understanding of the biotic responses to envi-ronmental forcing. The physiological responses are an inte-gral component in mechanistic models in predicting ecosys-tem trophodynamics. Nevertheless, studies of heterotrophic bacteria and phytoplankton assemblages are scarce, espe-cially in the Southeast Pacific. We measured DIP uptake rates and PartP concentrations in three size fractions: 0.2–0.6, 0.6– 2 and >2 µm in order to assess in situ specific growth rates of bacteria and two size fractions of phytoplankton. Firstly, we discuss the production and biomass estimators; secondly, we discuss the P-based µ estimates obtained in the Southeast Pacific.
4.1 Biomass estimators
The distribution of phytoplankton is commonly described in terms of Chla (Huot et al., 2007). Because the Chla con-tent varies between species, light and nutrients (Philips et al., 1995; Sciandra et al., 1997; Finkel et al., 2004; P´erez et al., 2006; Moore et al., 2006), it is not an ideal biomass estimator (Breton et al., 2000; Le Floc’h et al., 2002). POC cannot be used directly as it contains a high proportion of de-trital matter (Sobczak et al., 2002; Fig. 4a and d). The AB in terms of C is never directly determined but derived from
other variables: Chla, biovolumes or cell numbers which are then transformed using appropriate conversion factors. This entails a critical step in the estimation of AB: the choice of conversion factor. C:Chla values vary over a wide range even at species level. As an example, in the subtropical At-lantic ocean, Veldhuis and Kraay (2004) found C:Chla ratios ranging from 450 at the surface to 15 gC gChla−1at 150 m, for Prochlorococcus populations and a C:Chla ratio of 30– 80 gC gChla−1in surface waters for the collective eukaryotic phytoplankton, varying by a factor of 3–7 fold with depth. In most studies however, authors use values ranging between 30 and 55 gC gChla−1to convert their Chla data into C biomass (Gasol et al., 1997; Lequ´er´e et al., 2005; Houlbr`eque et al., 2006). For phytoplankton, cell-number-to-C conversion factors can also vary significantly even at the species level (Table 1). We found significant differences (P<0.001) in VspDIC estimates according to the choice of phytoplankton cell-number-to-C or C:Chla conversion factors. So although the use of a single conversion factor is the rule in field stud-ies, it probably leads to significant errors in biomass esti-mates. Conversely, using appropriate cell or Chla to carbon conversion factors demands complex data analysis. Studies on heterotrophic bacterial communities have shown that the C cell content changes in relation to natural conditions and the physiological state of the bacterial assemblages (Table 1). Gundersen et al. (2002) showed that the outcome of HBB as-sessments is highly dependant on the choice of cell-specific conversion factors. In the same way, La Ferla and Leonardi (2005) demonstrated that the quantification of HBB based solely on abundance must be considered with caution be-cause of the variability in cell volumes and morphotypes. Thus there is great uncertainty surrounding the estimate of C-based phytoplankton and heterotrophic bacterial µ, what-ever the choice of biomass estimator.
P is an essential element required for life, used by all or-ganisms. It is found in a variety of molecules with different cellular roles, ranging from storage of genetic information (nucleic acids: DNA, RNA) and energy (ATP, ADP, AMP) to structural composition (phospholipids). If the contribution of detrital P to PartP standing stocks is small enough, then PartP can be considered to reflect the standing stock of liv-ing material. Our results showed that PartP contained less detrital material than the POC (Fig. 4). This was indicated by significantly higher turnover rates of PartP compared to those of POC and a significant correlation between PartP and Chla concentrations. Similar observations have shown that P is preferentially released from both dissolved and particulate matter into the water column relative to other elements such as C and N (Menzel and Ryther, 1964; Knauer et al., 1979; Minster and Boulahdid, 1987; Clark et al., 1998, 1999; Loh and Bauer, 2000; Paytan et al., 2003). The use of PartP as a living biomass indicator is particularly well adapted to the open ocean. Indeed, in such areas, low values of detrital P are commonly found (∼1% in equatorial Pacific Ocean, Faul et al., 2005). Nevertheless, even if the fraction of detrital
P is negligible in the whole fraction, the size distribution of detrital P is not known and can affect the measurement of VspDIPin each size fraction. It has been shown that as the size of the organic matter decreases, the more refractory it be-comes (the size-reactivity continuum hypothesis; Amon and Benner, 1996; Mannino and Harvey, 2000), therefore we can hypothesise that there is also a size-reactivity continuum in detrital matter that engender higher concentrations of detrital matter in the smallest fraction. For this reason, VspDIP <0.6may be underestimated. The proportion of detrital P in PartP is high in coastal areas (Faul et al., 2005). Consequently, VspDIP is more likely to be underestimated in the upwelling area. The other main advantage of using P instead of Chla is that PartP takes both bacteria and phytoplankton into account. So if it is possible to separate bacterial P from phytoplankton P in PartP, then it would be possible to estimate bacterial and phytoplankton VspDIPin the same sample. Size fractionation was an adequate method for separating heterotrophic bacte-ria from phytoplankton, in our study, since more than 90% of bacterial cells passed through the 0.6 µm-filters. How-ever, an increasing fraction of Prochlorococcus cells passed through when the water became ultraoligotrophic (in the cen-tre of the gyre). Consequently, values of heterotrophic bac-teria VspDIP in the gyre may be biased due to the influence of
Prochlorococcus cells. Nevertheless, it was shown that DIC
uptake in the 0.2–0.6 µm fraction was negligible (data not shown) and therefore the phytoplankton production in this fraction was negligible. Thus, production in terms of P in the 0.2–0.6 µm fraction can be mainly attributed to free-living heterotrophic bacteria. Therefore, VspDIP <0.6 gives a good representation of bacterial µ. In the >0.6 µm size frac-tions, the nano and microzooplankton can account for some of the PartP concentration values. Gasol et al. (1997) showed that zooplankton C-biomass (protozooplankton + mesozoo-plankton) could account for 13–21% and 15–65% of the to-tal C-biomass in coasto-tal and open ocean areas, respectively. Consequently, this could be a non negligible source of phy-toplankton VspDIPunderestimation, particularly for the >2 µm size fraction.
4.2 DIP uptake rate measurements
Assuming that the DIP represents biologically available or-thophosphate, we measured P uptake rates (VDIP)in three size fractions. Daily P uptake rates were calculated by mul-tiplying the hourly rate by 24. P uptake is generally shown to be constant over 24 h (Perry and Eppley, 1981, Harrison, 1983; Moutin et al., 2002) but diurnal variations in P up-take have been observed in some studies (Eppley et al., 1971; Harrison et al., 1977; Currie and Kalff, 1984). For the major-ity of stations, time course experiments for33P uptake were linear over 24 h, however there were some variations in P uptake rates at some stations along the BIOSOPE transect (Duhamel et al., 2006). The methodological problems as-sociated with 24 h incubation experiments can be significant
(Nalewajko and Garside, 1983, Harrison and Harris, 1986), especially in terms of losses. However, short incubation ex-periments should reduce the bias linked to such losses (see discussion in Duhamel et al., 2006). It is important to stress that even if the <0.6 µm fraction is composed of solely het-erotrophic bacteria, our data set does not prove that P is turn-ing over at the same rate as the cells. Indeed, Nalewajko and Lean (1978) measured net phosphate uptake and influx rates in batch cultures of three algal cell cultures. They showed that short-term P fluxes always exceeded the net increase in P biomass, indicating that the cells release P compounds back into the medium. To the best of our knowledge, the study of Nalewajko and Lean (1978) has not been repeated, so this experiment should be repeated in a variety of field samples to verify that this phenomenon is not exclusively observed in cultures. C-based µ estimations are also submitted to such error type. Indeed, the release of assimilation products is common to C measurements. Claustre et al. (2007) propose that the release of DOC in the Southeast Pacific should be a major process which could explain the high community (bac-teria + phytoplankton) production rates. The release of DOC by phytoplankton cells produces bias in the evaluation of C production (Wood et al., 1992) and subsequently for C-based
µestimations.
4.3 Growth rates estimates
In 1981, Perry and Eppley used the33P uptake rate to PartP ratio to estimate the growth rate of phytoplankton (Table 2), stating that DIP assimilation was mediated by phytoplankton (their data indicating low heterotrophic activity). In 1996, Thingstad et al. determined both heterotrophic bacteria and phytoplankton P-based generation times [(PartP ×32P uptake rate)×ln(2)] using 1 µm size fractionations (Table 2). From these different studies, where the proportion of detrital matter in the PartP was negligible, it was possible to put forward the hypothesis that DIP was the sole source of P and so VspDIP es-timates could be used to assess bacteria and/or phytoplankton
µ. Thus the idea of using P-based estimates of µ is not new. In this study we provide information on the variations in P-based µ values in a gradient of oligotrophy where the waters where P-repleted (DIP concentration and turnover time min-imum values: 120 nmol l−1and 7 d−1, respectively; Moutin
et al., 2007). Most estimates for C-based heterotrophic bac-terial growth rates in the open ocean fall into a wide range from zero to 10 d−1, whilst phytoplankton appears to grow at rates of no more than 2 d−1(Table 2). We report a wide range in µ estimates ranging from 0 to 7 d−1for heterotrophic bac-teria and from 0 to 2 d−1 for phytoplankton. This range of values reflects the wide range of trophic status encountered during the BIOSOPE cruise.
Estimates of production to biomass ratio, based on the leucine incorporation technique and C conversion of bacterial abundance (HBP:HBB) were significantly lower than those estimated by VspDIP <0.6 in productive areas
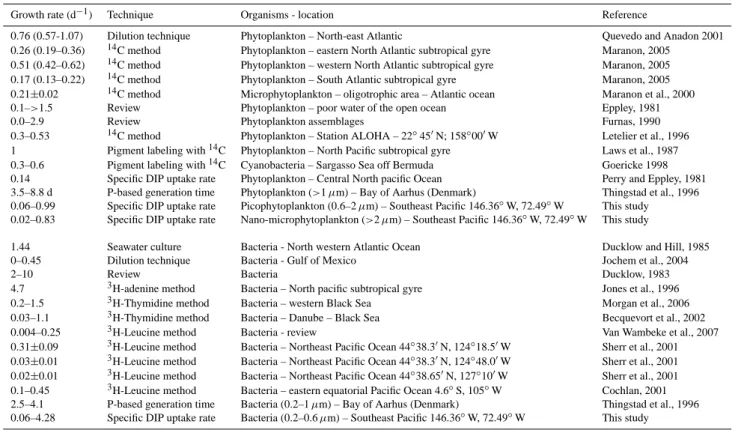
Table 2. Review of values of surface water phytoplankton and bacteria growth rate (d−1).
Growth rate (d−1) Technique Organisms - location Reference
0.76 (0.57-1.07) Dilution technique Phytoplankton – North-east Atlantic Quevedo and Anadon 2001 0.26 (0.19–0.36) 14C method Phytoplankton – eastern North Atlantic subtropical gyre Maranon, 2005
0.51 (0.42–0.62) 14C method Phytoplankton – western North Atlantic subtropical gyre Maranon, 2005 0.17 (0.13–0.22) 14C method Phytoplankton – South Atlantic subtropical gyre Maranon, 2005 0.21±0.02 14C method Microphytoplankton – oligotrophic area – Atlantic ocean Maranon et al., 2000 0.1–>1.5 Review Phytoplankton – poor water of the open ocean Eppley, 1981 0.0–2.9 Review Phytoplankton assemblages Furnas, 1990 0.3–0.53 14C method Phytoplankton – Station ALOHA – 22◦45′N; 158◦00′W Letelier et al., 1996 1 Pigment labeling with14C Phytoplankton – North Pacific subtropical gyre Laws et al., 1987 0.3–0.6 Pigment labeling with14C Cyanobacteria – Sargasso Sea off Bermuda Goericke 1998 0.14 Specific DIP uptake rate Phytoplankton – Central North pacific Ocean Perry and Eppley, 1981 3.5–8.8 d P-based generation time Phytoplankton (>1 µm) – Bay of Aarhus (Denmark) Thingstad et al., 1996 0.06–0.99 Specific DIP uptake rate Picophytoplankton (0.6–2 µm) – Southeast Pacific 146.36◦W, 72.49◦W This study 0.02–0.83 Specific DIP uptake rate Nano-microphytoplankton (>2 µm) – Southeast Pacific 146.36◦W, 72.49◦W This study
1.44 Seawater culture Bacteria - North western Atlantic Ocean Ducklow and Hill, 1985 0–0.45 Dilution technique Bacteria - Gulf of Mexico Jochem et al., 2004
2–10 Review Bacteria Ducklow, 1983
4.7 3H-adenine method Bacteria – North pacific subtropical gyre Jones et al., 1996 0.2–1.5 3H-Thymidine method Bacteria – western Black Sea Morgan et al., 2006
0.03–1.1 3H-Thymidine method Bacteria – Danube – Black Sea Becquevort et al., 2002 0.004–0.25 3H-Leucine method Bacteria - review Van Wambeke et al., 2007 0.31±0.09 3H-Leucine method Bacteria – Northeast Pacific Ocean 44◦38.3′N, 124◦18.5′W Sherr et al., 2001 0.03±0.01 3H-Leucine method Bacteria – Northeast Pacific Ocean 44◦38.3′N, 124◦48.0′W Sherr et al., 2001 0.02±0.01 3H-Leucine method Bacteria – Northeast Pacific Ocean 44◦38.65′N, 127◦10′W Sherr et al., 2001 0.1–0.45 3H-Leucine method Bacteria – eastern equatorial Pacific Ocean 4.6◦S, 105◦W Cochlan, 2001 2.5–4.1 P-based generation time Bacteria (0.2–1 µm) – Bay of Aarhus (Denmark) Thingstad et al., 1996 0.06–4.28 Specific DIP uptake rate Bacteria (0.2–0.6 µm) – Southeast Pacific 146.36◦W, 72.49◦W This study
(MAR-STB6 and STB15-UPX, P<0.001). Applying var-ious methods (measurements of the natural abundance of nucleoid-containing cells by combined epifluorescence and phase-contrast microscopy; detection of the reduction of the fluorogenic dye, 5-cyano-2,3-ditolyl tetrazolium chlo-ride; nucleic acid double staining (SYBR Green + propid-ium iodide); determination of membrane integrity by con-focal laser-scanning microscopy), it has been shown that at any given time, a significant fraction of the bacterio-plankton community has minimal or no metabolic activity (Zweifel and Hagstr¨om, 1995; Sherr et al., 1999; Gregori et al., 2001; Pirker et al., 2005). For this reason, µ estimates based on the HBP:HBB ratio could be underestimated. Our VspDIP <0.6values were significantly higher in the productive areas than in the gyre area (P<0.001). Morgan et al. (2006) also found that bacterial growth rates (with µ=HBP/bacterial abundance, HBP deduced from3H-Thymidine method using conversion factor of 2×10¹⁸cells×[mol TdR]−1)were
sig-nificantly greater on the shelf (0.8–1.8 d−1)compared to the gyre (0.1–0.3 d−1)in the western Black Sea.
Studies comparing bacterial and phytoplankton µ are few (Jones et al., 1996; Almeida et al., 2002). Measurements of VspDIP in the 0.2–0.6, 0.6–2 and >2 µm fractions have en-abled us to make such comparisons. In oligotrophic envi-ronments, heterotrophic bacterial µ can be higher or lower than that of phytoplankton. For example, P´erez et al. (2006)
showed that in the upper water (mixed layer) of the sub-tropical Atlantic gyres, phytoplankton growth rates were 0.17 d−1(from daily AP and picoplankton abundance
trans-formed to B with the empirical conversion factors obtained by Zubkov et al. (2000), see Table 1). While in the same area, Zubkov et al. (2000) found that heterotrophic bacte-rial growth rates were 0.12 d−1 (using a conversion factor of 11.5 fg C per heterotrophic bacteria). In the upper 40 m of the North Pacific subtropical gyre, Jones et al. (1996) found 0.7 d−1for phytoplankton (estimated from the Chla-labelling technique) and ∼1 d−1 for heterotrophic bacteria (estimated from the incorporation of3H-adenine into DNA). We showed that picophytoplankton µ (0.14±0.04 d−1)was higher than heterotrophic bacteria µ (0.11±0.07 d−1)in the Southeast Pacific gyre and that values were in the same range as those found by P´erez et al. (2006) and Zubkov et al. (2000) in the Atlantic gyres, suggesting the presence of a microbial community with a very slow turnover. These relatively low values of µ for both phytoplankton and het-erotrophic bacteria in the oligotrophic gyre area must be the result of nitrogen limitation on bacterial and primary pro-duction (Bonnet et al., 2007; Van Wambeke et al., 2007a). Slow phytoplankton µ in the subtropical Atlantic have been explained in terms of the observed assimilation numbers and C:Chla ratios in a review by Mara˜non (2005). The light-saturated, chlorophyll normalised photosynthesis rate
necessary to support a phytoplankton µ of 1 d−1, would
be well above those reported in the subtropical Atlantic (156±16 and 205±17 mg C m−2d−1, in the North and South
Atlantic subtropical gyres, respectively; P´erez et al., 2006) and the Southeast Pacific gyre (134±82 mg C m−2d−1; Van Wambeke et al., 2007b). In coastal areas heterotrophic bac-terial µ are often lower than that of phytoplankton (Laws et al., 1984; Revilla et al., 2000). In the productive areas (MAR-STB6 and STB15-UPX) of the Southeast Pacific, we found that organisms in the <0.6 µm fraction had higher VspDIP values than organisms in the >0.6 fraction, while in the hyperoligotrophic gyre, organisms in the 0.6–2 µm frac-tion yielded the highest VspDIP values. Thus it may be de-duced that the picophytoplankton were better adapted than the nano-microphytoplankton and free living heterotrophic bacteria for growing in hyperoligotrophic conditions.
There are relatively few studies comparing µ for dif-ferent size fractions of natural phytoplanktonic communi-ties (P´erez et al., 2006). In coastal eutrophic ecosys-tems, large phytoplankton are reported to have faster growth rates than small-sized phytoplankton (Cermeno et al., 2005 – C-specific photosynthetic rates). Nevertheless, in the Chilean upwelling area, there was no significant difference between VspDIP for the two size-fractions of phytoplankton (0.5±0.3 and 0.4±0.2 d−1for picophytoplankton and nano-microphytoplankton respectively, P>0.05). We found that picophytoplankton (0.6–2 µm) grew 1 to 15 times faster than the nano-microphytoplankton (>2 µm) between the Marque-sas Islands and Chile, with maximal differences in the gyre area. Differences in growth rates have been related to the specific composition of the planktonic community (Furnas, 1990). So the differences we observed could be related to differences between the taxonomic groups encountered along the BIOSOPE transect. Flow cytometry data showed high variations in the relative composition of picophytoplankton populations along the BIOSOPE transect (Grob et al., 2007). In the hyperoligotrophic region, the DCM corresponded to
Prochlorococcus and picophytoeukaryotes maxima (Grob et
al., 2007) as well as to the maximum growth rate values of the picophytoplankton size fraction (Fig. 6).
In most of the oligotrophic area, phytoplankton µ were found to be higher in the upper mixed layer than within the DCML (Malone et al., 1993 – with AP deduced from the
14C labelling method and AB deduced using a C:Chla
ra-tio or14C-Chla experiments ; Quevedo and Anadon, 2001 – dilution method). We found that picophytoplankton grew significantly faster at the DCML than in the upper part of the photic zone in the hyperoligotrophic gyre (from STB7 to STB14; P<0.001). P´erez et al. (2006) found the same trends in the subtropical Atlantic gyres with a µ in the <2 µm frac-tion of, 0.17±0.01 d−1in the mixed layer and 0.25±0.02 d−1 in the DCML. However, they found that the large size frac-tion (>2 µm) grew faster in the mixed layer than in the DCML while we found no statistical difference for VspDIP >2
(P=0.161). Our results support the hypothesis of P´erez et al. (2006) that picoplankton could outcompete large cells in the high-nutrient, low-light environment of the DCML.
The evaluation of µ is still a subject of debate (Mara˜non, 2005). It is not possible to judge which technique is best for measuring µ, if indeed any one technique is capable of doing so, as each method measures a different aspect of growth. P-based µ estimates are one of the many ways to assess µ and by comparing the results obtained with those of the differ-ent existing methods can help to understand how quickly the cells grow in relation to their environment (Christian et al., 1982; Laws et al., 1984; Jespersen et al., 1992).
5 Conclusions
Growth rate is a fundamental property of all organisms and gives valuable information about the activity of microbial populations. The relative activity of bacteria and phyto-plankton in oligotrophic oceans has significant implications for food-web structures, nutrient cycling pathways and for sinking fluxes of organic matter. Contrary to C-based ap-proaches, the P-based approach enables us to assess bacte-rial and phytoplankton µ on the same sample in that size fraction can effectively isolate both heterotrophic and phyto-planktonic communities. We have characterized the vertical and longitudinal variability of P-based µ in three size frac-tions of plankton. Picophytoplankton (0.6–2 µm) grew faster than the large phytoplankton (>2 µm) over the Southeast Pa-cific transect, particularly in the centre of the gyre. Thus, cells smaller than 2 µm were better adapted for growing in a wide range of trophic conditions than those greater than 2 µm. Heterotrophic bacteria (0.2–0.6 µm) showed higher variations in P-based µ with maximum rates in productive areas. Picophytoplankton grew faster than heterotrophic bac-teria in the Southeast Pacific gyre with values in the range of those found in the Atlantic and North pacific gyres by P´erez et al. (2006) and Zubkov et al. (2000), suggesting the pres-ence of a microbial community with a slow turn over.
Acknowledgements. We express our gratitude to O. Ulloa, G.
Alar-con and C. Grob for providing us cytometry data. We thank T. Bentley for help with improving the English. We also thank the crew of the R/V L’Atalante for outstanding shipboard support operations. D. Tailliez and C. Bournot are warmly thanked for their efficient help in CTD rosette management and data processing. This is a contribution to the BIOSOPE project of the LEFE-CYBER program. This research was funded by the Centre National de la Recherche Scientifique (CNRS), the Institut des Sciences de l’Univers (INSU), the Centre National d’Etudes Spatiales (CNES), the European Space Agency (ESA), The National Aeronautics and Space Administration (NASA) and the Natural Sciences and Engineering Research Council of Canada (NSERC). This work is funded in part by the French Research and Education council. Edited by: A. Boetius
References
Almeida, M. A., Cunha, M. A., and Alcˆantara, F.: Seasonal change in the proportion of bacterial and phytoplankton produc-tion along a salinity gradient in a shallow estuary, Hydrobiologia, 475–476, 251–262, 2002.
Amon, R. M. W. and Benner, R.: Bacterial utilization of different size classes of dissolved organic matter, Limnol. Oceanogr., 41, 41-51, 1996.
Azam, F., Frenchel, T., Field, J. G., Gray, J. S., Meyer-Reil, L. A., and Thingstad, T. F.: The ecological role of water-column microbes in the sea, Mar. Ecol.-Prog. Ser., 10, 257–263, 1983. Banse, K.: Rates of phytoplankton cell division in the field and
in iron enrichment experiments, Limnol. Oceanogr., 36, 1886– 1898, 1991.
Banse, K.: Should we continue to measure 14C-uptake by phyto-plankton for another 50 years?, Limnology and Oceanography: Bulletin, 11, 45–46, 2002.
Becquevort, S., Bouvier, T., Lancelot, C., Cauwet, G., Deliat, G., Egorov, V. N., and Popovichev, V. N.: The seasonal modulation of organic matter utilization by bacteria in the Danube-Black Sea mixing zone, Estuar. Coast. Shelf S., 54, 337–354, 2002. Berman, T.: Multiple isotopic tracer methods in the study of growth,
dynamics and metabolic processes in marine ecosystems, in: Pri-mary Productivity in the Sea, edited by: Falkowski, P., Plenum Publishing, 213–229, 1980.
Bertilsson, S., Berglund, O., Karl, D. M., and Chisholm, S. W.: Ele-mental composition of marine Prochlorococcus and Synechococ-cus: Implications for the ecological stoichiometry of the sea, Limnol. Oceanogr., 48, 1721–1731, 2003.
Bonnet, S., Guieu, C., Bruyant, F., Prasil, O., Raimbault, P., Max Y. Gorbunov, M., Zehr, J. P., Grob, C., Masquelier, S., Gar-czareck, L., Moutin, T., Van Wambeke, F., and Claustre, H.: Nutrients limitation of primary productivity in the Southeast Pa-cific (BIOSOPE cruise), Biogeosciences Discuss., 4, 2733-2759, 2007,
http://www.biogeosciences-discuss.net/4/2733/2007/.
Breton, E., Brunet, C., Sautour, B., and Brylinski, J. M.: An-nual variations of phytoplankton biomass in the Eastern English Channel: comparison by pigment signatures and microscopic counts, J. Plankton Res., 22, 1423–1440, 2000.
Brock, T. D.: Microbial growth rates in nature, Bacteriol. Rev., 35, 39–58, 1971.
Cailliau, C., Claustre, H., Vidussi, F., Marie, D., and Vaulot, D.: Carbon biomass and gross growth rates as estimated from 14C pigment labelling method during photoacclimation in Prochloro-coccus CCMP1378), Mar. Ecol.-Prog. Ser., 145, 209–221, 1996. Campbell, L., Liu, H., Nolla, H. A., and Vaulot, D.: Annual vari-ability of phytoplankton and bacteria in the subtropical North Pacific Ocean at Station ALOHA during the 1991–1994 ENSO event, Deep-Sea Res. Pt. I, 44, 167–192, 1997.
Campbell, L., Nolla, H. A., and Vaulot, D.: The importance of Prochlorococcus to community structure in the central North Pa-cific Ocean, Limnol. Oceanogr., 39, 954–961, 1994.
Caron, D. A., Dam, H. G., Kremer, P., Lessard, E. J., Madin, L. P., Malone, T. C., Napp, J. M., Peele, E. R., Roman, M. R., and Youngbluth, M. J.: The contribution of microorganisms to partic-ulate carbon and nitrogen in surface waters of the Sargasso Sea near Bermuda, Deep-Sea Res. Pt. I, 42, 943–972, 1995. Cermeno, P., Maranon, E., Rodriguez, J., and Fernandez, E.:
Large-sized phytoplankton sustain higher carbon-specific photosynthe-sis than smaller cells in a coastal eutrophic ecosystem, Mar. Ecol.-Prog. Ser., 297, 51–60, 2005.
Chavez, F. P., Buck, K. R., Service, S. K., Newton, J., and Barber, R. T.: Phytoplankton variability in the central and eastern tropical Pacific, Deep-Sea Res. Pt. II, 43, 835–870, 1996.
Christian, J. R. and Karl, D. M.: Microbial community structure at the U.S. -Joint Global Ocean flux Study Station ALOHA: Inverse methods for estimating biochemical indicator ratios, J. Geophys. Res., 99, 14 269–14 276, 10.1029/94JC00681, 1994.
Christian, R. R., Hanson, R. B., and Newell, S. Y.: Comparison of methods for measurement of bacterial growth rates in mixed batch cultures, Appl. Environ. Microb., 43, 1160–1165, 1982. Clark, L. L., Ingall, E. D., and Benner, R.: Marine organic
phos-phorus cycling: Novel insights from nuclear magnetic resonance, Am. J. Sci., 2999, 724–737, 1999.
Clark, L. L., Ingall, E. D., and Benner, R.: Marine phosphorus is selectively remineralized, Nature, 393, 426, 1998.
Claustre, H. and Maritorena, S.: The Many Shades of Ocean Blue, Science, 302, 1514–1515, 2003.
Claustre, H., Bricaud, A., Babin, M., Bruyant, F., Guillou, L., Le Gall, F., and Partensky, F.: Diel variations in Prochlorococcus optical properties, Limnol. Oceanogr., 47, 1637–1647, 2002. Cochlan, W.: The heterotrophic bacterial response during a
mesoscale iron enrichment experiment (IronEx II) in the east-ern equatorial Pacific Ocean. Limnology and Oceanography, 46, 428–435, 2001.
Currie, D. J. and Kalff, J.: The relative importance of bacterioplank-ton and phytoplankbacterioplank-ton in phosphorus uptake in freshwater, Lim-nol. Oceanogr., 29, 311–321, 1984.
Dickson, M.-L. and Wheeler, P. A.: Nitrate uptake rates in a coastal upwelling regime: A comparison of PN-specific, absolute, and Chl a-specific rates. Limnology and Oceanography, 40, 533–543, 1995.
Ducklow, H. W.: Bacterial production and biomass in the oceans, in: Microbial ecology of the oceans, edited by: Kirchman, D. L., Wiley series in Ecological and Applied Microbiology, Ralph Mitchekk, Series Editor., 85–120, 2000.
Ducklow, H. W.: Production and fate of bacteria in the oceans, Bio-science, 33, 494–501, 1983.
Duhamel, S., Zeman, F., and Moutin, T.: A dual-labeling method for the simultaneous measurement of dissolved inorganic car-bon and phosphate uptake by marine planktonic species, Limnol. Oceanogr.-Meth., 4, 416–425, 2006.
Eppley, R. W., Carlucci, A. F., Holm-Hansen, Kiefer, D., McCarthy, J. J., Venrick, E., and Williams, P. M.: phytoplankton growth and composition in shipboard cultures supplied with nitrate, am-monium, or urea as the nitrogen source, Limnol. Oceanogr., 16, 741–751, 1971.
Eppley, R. W.: Relations between nutrient assimilation and growth rate in phytoplankton with a brief review of estimates of growth rate in the ocean. in: Physiological Bases of Phytoplankton Ecol-ogy, edited by: Platt, T., Can. Bull. Fish. Aquat. Sci., 210, 251– 263, 1981.
Eppley, R. W.: Temperature and phytoplankton growth in the sea, Fish. B.-N.O.A.A., 70, 1063–1085, 1972.
Faul, K. L., Paytan, A., and Delaney, M. L.: Phosphorus disctribu-tion in sinking oceanic particulate matter, Mar. Chem., 97, 307– 333, 2005.
Finkel, Z. V., Irwin, A. J., and Schofield, O.: Resource limitation alters the 3/4 size scaling of metabolic rates in phytoplankton, Mar. Ecol.-Prog. Ser., 273, 269–279, 2004.
Fuhrman, J. A. and Azam, F.: Bacterioplankton secondary produc-tion estimates for coastal waters of British Colombia, Antarctica and California, Appl. Environ. Microb., 39, 1085–1095, 1980. Fuhrman, J. A. and Azam, F.: Thymidine incorporation as a
mea-sure of heterotrophic bacterioplankton production in marine sur-face waters: Evaluation and field results, Mar. Biol., 66, 109– 120, 1982.
Fukuda, R., Ogawa, H., Nagata, T., and Koike, I.: Direct determi-nation of carbon and nitrogen contents of natural bacterial as-semblages in marine environments, Appl. Environ. Microb., 64, 3352–3358, 1998.
Furnas, M. J.: In situ growth rates of marine phytoplankton: ap-proaches to measurement, community and species growth rates, J. Plankton Res., 12, 1117–1151, 1990.
Gasol, J. M., Del Giogio, P., and Duarte, C. M.: Biomass distribu-tion in marine planktonic communities, Limnol. Oceanogr., 42, 1353–1363, 1997.
Goericke, R.: Response of phytoplankton community structure and taxon-specific growth rates to seasonally varying physical forc-ing in the Sargasso Sea off Bermuda, Limnol. Oceanogr., 43, 921–935, 1998.
Gr´egori, G., Citterio, S., Ghiani, A., Labra, M., Sgorbati, S., Brown, S., and Denis, M.: Resolution of viable and membrane-compromised bacteria in freshwater and marine waters based on analytical flow cytometry and nucleic acid double staining, Appl. Environ. Microb., 67, 4662–4670, 2001.
Grob, C., Ulloa, O., Claustre, H., Huot, Y., Alarcon, G., and Marie, D.: Contribution of picoplankton to the total particulate organic carbon (POC) concentration in the eastern South Pacific, Biogeo-sciences, 4, 837–852, 2007,
http://www.biogeosciences.net/4/837/2007/.
Gundersen, K., Heldal, M., Norland, S., Purdie, D. A., and Knap, A. H.: Elemental C, N, and P cell content of individual bacteria collected at the Bermuda Atlantic Time-series Study (BATS) site, Limnol. Oceanogr., 47, 1525–1530, 2002.
Hagstrom, A., Larsson, U., Horstedt, P., and Normark, S.: Fre-quency of dividing cells, a new approach to the determination of bacterial growth rates in aquatic environments, Appl. Environ. Microb., 37, 805–812, 1979.
Harrison, W. G. and Harris, L. R.: Isotope dilution and its effects on measurements of nitrogen and phosphorus by oceanic mi-croplankton, Mar. Ecol.-Prog. Ser., 27, 253–261, 1986. Harrison, W. G., Azam, F., Renger, E. H., and Eppley, R. W.: Some
experiments on phosphate assimilation by coastal marine plank-ton, Mar. Biol., 40, 9–18, 1977.
Harrison, W. G.: The time-course of uptake of inorganic and or-ganic nitrogen compounds by phytoplankton from the Eastern Canadian Arctic: A comparison with temperate and tropical pop-ulations, Limnol. Oceanogr., 28, 1231–1237, 1983.
Herbland, A., Le Bouteiller, A., and Raimbault, P.: Size structure of phytoplankton biomass in the equatorial Atlantic Ocean, Deep-Sea Res. Pt. I, 32, 819–836, 1985.
Houlbr`eque, F., Delesalle, B., Blanchot, J., Montel, Y., and Ferrier-Pag`es, C.: Picoplankton removal by the coral reef community of La Pr´evoyante, Mayotte Island, Aquat. Microb. Ecol., 44, 59–70, 2006.
Huot, Y., Babin, M., Bruyant, F., Grob, C., Twardowski, M. S., Claustre, H.: Relationship between photosynthetic parameters and different proxies of phytoplankton biomass in the subtrop-ical ocean, Biogeosciences, 4, 853–868, 2007,
http://www.biogeosciences.net/4/853/2007/.
Jespersen, A.-M., Nielsen, J., Riemann, B., and Sondergaard, M.: Carbon-specific phytoplankton growth rates: a comparison of methods, J. Plankton Res., 14, 637–648, 1992.
Jones, D. R., Karl, D. M., and Laws, E. A.: Growth rates and pro-duction of heterotrophic bacteria and phytoplankton in the North Pacific subtropical gyre, Deep-Sea Res. Pt. I, 43, 1567–1580, 1996.
Kirchman, D. L., K’nees, E., and Hodson, R.: Leucine incorpora-tion and its potential as a measure of protein synthesis by bacteria in natural aquatic systems, Appl. Environ. Microb., 49, 599–607, 1985.
Kirchman, D. L.: Calculating microbial growth rates from data on production and standing stocks, Mar. Ecol.-Prog. Ser., 233, 303-306, 2002.
Kirchman, D. L.: Leucine incorporation as a measure of biomass production by heterotrophic bacteria, in: Handbook of methods in aquatic microbial ecology, edited by: Kemp, P. F., Sherr, B. F., Sherr, E. B., and Cole, J. J., Boca Raton: Lewis, 509–512, 1993. Kirkwood, D. S.: Stability of solutions of nutrient salts during
stor-age. Mar. Chem., 38, 151–164, 1992.
Knauer, G. A., Martin, J. H., and Bruland, K. W.: Fluxes of particu-late carbon, nitrogen, and phosphorus in the upper water column of the northeast Pacific, Deep-Sea Res., 26, 97–108, 1979. La Ferla, R. and Leonardi, M.: Ecological implications of biomass
and morphotype variations of bacterioplankton: an example in a coastal zone of the Northern Adriatic Sea (Mediterranean), Mar. Ecol., 26, 82–88 doi:10.1111/j.1439-0485.2005.00049.x, 2005. Landry, M. R. and Hassett, R. P.: Estimating the grazing impact of
marine micro-zooplankton, Mar. Biol., 67, 283–288, 1982. Laws, E. A., Ditullio, G. R., and Redalje, D. G.: High
phytoplank-ton growth and production rates in the North Pacific subtropical gyre, Limnol. Oceanogr., 32, 905–918, 1987.
Laws, E. A., Redalje, D. G., Haas, L. W., Bienfang, P. K., Eppley, R. W., Harrison, W. G., Karl, D. M., and Marra, J.: High phyto-plankton growth and production rates in oligotrophic Hawaiian coastal waters, Limnol. Oceanogr., 29, 1161–1169, 1984. Le Floc’h, E., Gilbert, M., and Antoine, S.: An automatic device for
in vivo absorption spectra acquisition and chlorophyll estimation in phytoplankton cultures, J. Appl. Phycol., V14, 435–444, 2002. Le Qu´er´e, C., Harrison, S., Prentice, I. C., Buitenhuis, E. T., Au-mont, O., BOPP, L., Claustre, H., Cotrim Da Cunha, L., Gei-der, R., Giraud, X., Klass , C., Kohfeld, K. E., Legendre, k. L., Manizza, M., Platt , T., Rivkin , R. B., Sathyendranath, S., Uitz, J., Watson, Y. J., and Wofl - Glaro, D.: Ecosystem dynamics based on plankton functional types for global ocean biogeochem-istry models, Glob. Change Biol., 11, 1–25, doi:10.1111/j.1365-2486.2005.001004.x, 2005.
Lee, S. and Fuhrman, J. A.: Relationships between biovolume and biomass of naturally derived marine bacterioplankton, Appl. En-viron. Microb., 53, 1298–1303, 1987.
Letelier, R. M., Dore, J. E., Winn, C. D., and Karl, D. M.: Seasonal and interannual variations in photosynthetic carbon assimilation at Station, Deep-Sea Res. Pt. II, 43, 467–490, 1996.