HAL Id: hal-01848215
https://hal-amu.archives-ouvertes.fr/hal-01848215
Submitted on 24 Jul 2018
HAL is a multi-disciplinary open access
archive for the deposit and dissemination of
sci-entific research documents, whether they are
pub-lished or not. The documents may come from
teaching and research institutions in France or
abroad, or from public or private research centers.
L’archive ouverte pluridisciplinaire HAL, est
destinée au dépôt et à la diffusion de documents
scientifiques de niveau recherche, publiés ou non,
émanant des établissements d’enseignement et de
recherche français ou étrangers, des laboratoires
publics ou privés.
Depend Neither on Ketone Bodies Nor on Pyruvate
Roman Tyzio, Camille Allène, Romain Nardou, Michel Picardo, Sumii
Yamamoto, Sudhir Sivakumaran, Maddalena Caiati, Sylvain Rheims, Marat
Minlebaev, Mathieu Milh, et al.
To cite this version:
Roman Tyzio, Camille Allène, Romain Nardou, Michel Picardo, Sumii Yamamoto, et al.. Depolarizing
Actions of GABA in Immature Neurons Depend Neither on Ketone Bodies Nor on Pyruvate. Journal of
Neuroscience, Society for Neuroscience, 2011, 31 (1), pp.34-45. �10.1523/JNEUROSCI.3314-10.2011�.
�hal-01848215�
Cellular/Molecular
Depolarizing Actions of GABA in Immature Neurons Depend
Neither on Ketone Bodies Nor on Pyruvate
Roman Tyzio,
1Camille Allene,
1Romain Nardou,
1Michel A. Picardo,
1Sumii Yamamoto,
1Sudhir Sivakumaran,
2Maddalena D. Caiati,
2Sylvain Rheims,
1Marat Minlebaev,
1Mathieu Milh,
1Pascal Ferre´,
3Rustem Khazipov,
1Jean-Louis Romette,
4Jean Lorquin,
5Rosa Cossart,
1Ilgam Khalilov,
1Astrid Nehlig,
6Enrico Cherubini,
2and Yehezkel Ben-Ari
11Inserm, Unite´ 901/Institut de Neurobiologie de la Me´diterrane´e, 13273 Marseille, France,2Neurobiology Department, International School for Advanced
Studies, 34012 Basovizza (Trieste), Italy,3Inserm, Unite´ Mixte de Recherche S872, Centre de Recherche des Cordeliers and Universite´ Pierre et Marie Curie–
Paris 6, 75006 Paris, France,4Ecole Supe´rieur d’Inge´nieurs de Luminy, Case 925, 13288 Marseille, France,5Institut de Recherche pour le De´veloppement,
Microbiologie et Biotechnologie des Environnements Extreˆmes, Unite´ Mixte de Recherche D180, Universite´ de Provence et de la Me´diterrane´e, 13288 Marseille, France, and6Inserm, Unite´ 666, Faculty of Medicine, 67085 Strasbourg, France
GABA depolarizes immature neurons because of a high [Cl
⫺]
iand orchestrates giant depolarizing potential (GDP) generation. Zilberter
and coworkers (Rheims et al., 2009; Holmgren et al., 2010) showed recently that the ketone body metabolite
DL-3-hydroxybutyrate
(
DL-BHB) (4 m
M), lactate (4 m
M), or pyruvate (5 m
M) shifted GABA actions to hyperpolarizing, suggesting that the depolarizing effects of
GABA are attributable to inadequate energy supply when glucose is the sole energy source. We now report that, in rat pups (postnatal days
4 –7), plasma
D-BHB, lactate, and pyruvate levels are 0.9, 1.5, and 0.12 m
M, respectively. Then, we show that
DL-BHB (4 m
M) and pyruvate
(200
M) do not affect (i) the driving force for GABA
Areceptor-mediated currents (DF
GABA) in cell-attached single-channel recordings,
(2) the resting membrane potential and reversal potential of synaptic GABA
Areceptor-mediated responses in perforated patch
record-ings, (3) the action potentials triggered by focal GABA applications, or (4) the GDPs determined with electrophysiological recordings and
dynamic two-photon calcium imaging. Only very high nonphysiological concentrations of pyruvate (5 m
M) reduced DF
GABAand blocked
GDPs. Therefore,
DL-BHB does not alter GABA signals even at the high concentrations used by Zilberter and colleagues, whereas pyruvate
requires exceedingly high nonphysiological concentrations to exert an effect. There is no need to alter conventional glucose enriched
artificial CSF to investigate GABA signals in the developing brain.
Introduction
GABA depolarizes and excites immature neurons in many animal
species because of their higher [Cl
⫺]
icompared with mature
neurons. This developmental change reflects the sequential
oper-ation of the chloride cotransporters NKCC1 and KCC2 (Ben-Ari
et al., 1989; Owens et al., 1996; Rivera et al., 1999; Ganguly et al.,
2001; Akerman and Cline, 2006) (for review, see Ben-Ari, 2002;
Owens and Kriegstein, 2002; Ben-Ari et al., 2007). GABAergic
synapses are expressed before glutamatergic synapses, and GABA
provides most of the early activity and orchestrates the
genera-tion of the first synaptic network-driven giant depolarizing
potentials (GDPs) (Ben-Ari et al., 1989; Garaschuk et al., 1998;
Tyzio et al., 1999; Ben-Ari, 2001; Sipila et al., 2006; Cre´pel et
al., 2007; Bonifazi et al., 2009).
Rodent maternal milk is enriched in fatty acids that are
trans-formed in the liver to aceto-acetate and
DL-3-hydroxybutyrate
(
DL-BHB). On the basis of this information, Zilberter and
col-leagues have recently challenged the developmental sequence of
GABA action (Rheims et al., 2009) and reported that adding
DL-BHB (4 m
M) to artificial CSF (ACSF) almost completely
elimi-nated depolarizing and excitatory actions of GABA. This was
suggested to reflect the actions of the Cl
⫺/HCO
3⫺exchanger and
not KCC2, reported to be inactive in the neocortex at the ages
investigated [postnatal day 1 (P1) to P8] (Rheims et al., 2009). In
a subsequent paper, the same group (Holmgren et al., 2010)
ex-tended these observations to hippocampal CA3 pyramidal
neu-rons and reported that, in addition to
DL-BHB, lactate or pyruvate
at exceedingly high concentrations (5 m
M) also shifted reversal
potential of synaptic GABA
Areceptor (GABA
AR)-mediated
re-sponses (E
GABA) and blocked GDPs, suggesting that the
depolar-izing actions of GABA are attributable to energy deprivation
when glucose is the sole energetic source. Because this suggestion
has important implications for neonatal slice studies, we have
now reexamined the effects of
DL-BHB and pyruvate on GABA
actions on neonatal deep layers neocortical neurons and CA3
pyramidal neurons.
Received June 27, 2010; revised Sept. 14, 2010; accepted Sept. 20, 2010.
This work was supported by Inserm, L’Agence Nationale de la Recherche (I.K.), Fe´de´ration pour la Recherche sur le Cerveau, European Union Network of European Museum Organisations, Fondation pour la Recherche Me´dicale, and Ministero Istruzione, Universita` e Ricerca to interface contract with Paris V University (Y.B.-A.). We are grateful to Drs. K. Kaila, P. Legendre, N. Burnashev, G. Chazal, and I. Medina for suggestions and critical remarks. We are grateful to Drs. L. Aniksztejn, F. Libersat, I. Bureau, and J. Epsztein for supervision of the results obtained by the Institut de Neurobiologie de la Méditerranée teams.
Correspondence should be addressed to Yehezkel Ben-Ari, Inserm, Institut de Neurobiologie de la Me´diterrane´e, Unite´ 901, Campus Scientifique de Luminy 163, route de Luminy BP13, 13009 Marseille, France. E-mail: ben-ari@ inmed.univ-mrs.fr.
DOI:10.1523/JNEUROSCI.3314-10.2011
We report that physiological plasma levels of
D-BHB, lactate,
and pyruvate are in pups (P5–P7) 0.9, 1.5, and 0.12 m
M,
re-spectively. Then, using a wide range of techniques that include
extracellular field potential, cell-attached single-channel, and
perforated patch-clamp recordings and calcium imaging we
re-port that neither
DL-BHB (Sigma-Aldrich) nor physiological
concentrations of pyruvate alter GABA actions or
spontane-ous network dynamics, notably GDPs on rat neocortical and
hippocampal neurons. Only very high nonphysiological
concen-trations of pyruvate altered GABA signaling and GDPs. Our
re-sults suggest that depolarizing GABA and GDPs are attributable
to neither the absence of BHB/pyruvate nor the metabolic state of
neurons in glucose-containing ACSF.
Materials and Methods
All investigations were analyzed in a double-blind manner with results obtained by an investigator analyzed by another researcher. In addition, this study was supervised by an independent group of Institut de Neuro-biologie de la Me´diterrane´e (INMED) principle investigators that were not involved in research on GABA in the developing brain (see Acknowl-edgments). They critically reviewed the results that were discussed in internal meetings of all INMED researchers.
Endogenous plasma
D-BHB, lactate, and pyruvate
ForD-BHB determination, plasma of pups was first deproteinized using 6% (w/v) perchloric acid and centrifuged, and the supernatant was neutralized with KOH before enzymatic determination.D-BHB was determined enzymatically using the spectrophotometric procedure as described previously (Ferre´ et al., 1983). Dosage of serum lactate and pyruvate were done in the metabolic biochemistry laboratory of Timone Hospital (Marseille, France). Enzymatic technique was used for lactate (RAPIDLAB 1265). Enzymatic dosage based on the reduc-tion of pyruvate to lactate by the lactate dehydrogenase at pH 7.5 with excess nicotinamide adenine dinucleotide was used for the dosage of pyruvate (Vassault, 1991).
Brain slices
Brain slices were prepared from P4 –P8 Wistar rats of both sexes. All animal use protocols conformed to the national guidelines on the use of laboratory animals and were approved by the Animal Care and Use Com-mittees of Inserm and International School for Advanced Studies. Ani-mals were rapidly decapitated, and brains were removed. Coronal slices (300 –500m) were cut using a tissue slicer (Leica-VT1200S; Microm International) in ice-cold oxygenated modified ACSF with 0.5 mMCaCl2 and 7 mMMgSO4, in which Na⫹was replaced by an equimolar concen-tration of choline. Slices were then transferred to oxygenated (95% O2/5% CO2) standard ACSF containing the following (in mM): 126 NaCl, 3.5 KCl, 2.0 CaCl2, 1.3 MgCl2, 25 NaHCO3, 1.2 NaH2PO4, and 10 glu-cose, pH 7.4, at room temperature (20 –22°C) for at least 1 h before use. For recordings, slices were placed into a conventional, fully submerged chamber superfused with ACSF (32–34°C) at a rate of 2–3 ml/min.
Perforated patch-clamp and whole-cell recordings
Patch-clamp recordings were performed from neocortical pyramidal and CA3 pyramidal neurons using EPC-10 Double (HEKA Elektronik Dr. Schulze GmbH) and Axopatch 200A (Molecular Devices) amplifiers. Patch electrodes were made from borosilicate glass capillaries (GC150F-15; Clark Electromedical Instruments). Patch pipette solution for gram-icidin perforated patch-clamp recording contained the following (in mM): 150 KCl and 10 HEPES, buffered to pH 7.2 with Tris-OH. Grami-cidin was first dissolved in DMSO to prepare a stock solution of 10 – 40 mg/ml and then diluted in the pipette solution to a final concentration of 80g/ml. The gramicidin-containing solution was prepared and soni-cated⬍1 h before the experiment. To facilitate cell-attached formation (4 –10 G⍀), patch pipettes were backfilled with a gramicidin-containing solution. Between 20 and 30 min after formation of the cell-attached seal, the series resistance (Rs) stabilized at 8 – 60 M⍀. Series resistance was monitored during all recording sessions. At the end of each recording,
negative pressure was applied to break the membrane and establish whole-cell configuration. This was associated with a shift of the reversal potential of the GABA-mediated responses to near 0 mV. The membrane potential values (Em) were corrected for series resistance offline as V(cor-rected)⫽ V(holding) ⫺ IRs. For whole-cell recordings, we used the pipette solution containing the following (in mM): 135 K-gluconate, 20
KCl, 10 HEPES, 4 MgATP, 0.3 GTP, and 0.5 EGTA. A picospritzer (Gen-eral Valve Corporation) was used to puff apply GABA (100Min ACSF)
from a glass pipette in stratum radiatum at a distance of⬃100m from the soma in gramicidin perforated patch recordings. The pressure varied from 10 to 20 kPa, and the duration of the puff varied from 50 to 200 ms.
Cell-attached recordings of GABA
Aand NMDA receptor channels
Patch-clamp recordings from visually identified pyramidal cells in a cell-attached configuration were performed using an EPC-10 double ampli-fier or Axopatch 200B ampliampli-fier. For recordings of single GABA channels, the following patch pipette solution was added on the day of the experi-ment from a 1 mMfrozen stock solution (in mM): 120 NaCl, 5 KCl, 20 tetraethylammonium-Cl, 5 4-aminopyridine, 0.1 CaCl2, 10 MgCl2, 10 glucose, and 10 HEPES–NaOH, buffered to pH 7.2–7.3 (with GABA at 1–5M). Em was estimated using cell-attached recordings of single NMDA receptor (NMDAR) channels as described previously (Tyzio et al., 2003). For recordings of single NMDAR channels, pipette solution contained nominally Mg2⫹-free ACSF with NMDA (10M), glycine (1 M), and strychnine (1M). Pipettes (resistance of 3.5– 8 M⍀) were pulled from borosilicate glass capillaries (GC150F-15; Clark Electro-medical Instruments). Recordings were digitized (10 kHz) online with Digidata 1200 or 1440 interface cards (Molecular Devices), filtered (2.9 kHz), and analyzed offline with Axon package (Molecular Devices) and Origin (Microcal Software) as described previously (Tyzio et al., 2003, 2006). Group measures are expressed as means⫾ SEM; error bars also indicate SEM. The statistical significance of differences was assessed with Student’s t test. The level of significance was set at p⬍ 0.05.Calcium imaging
Slice preparation for calcium imaging. Horizontal slices of neocortex and hippocampus (400m thick) were prepared from P7 rats using a Vi-bratome tissue slicer (Leica VT 1200S) in ice-cold oxygenated modified ACSF (mACSF) (with 0.5 mMCaCl2and 7 mMMgSO4; NaCl replaced by an equimolar concentration of choline). Slices were then transferred for rest (⬃1 h) in oxygenated normal ACSF containing the following (in mM): 126 NaCl, 3.5 KCl, 1.2 NaH2PO4, 26 NaHCO3, 1.3 MgCl2, 2.0 CaCl2, and 10D-glucose, pH 7.4. For AM loading, slices were incubated in a small vial containing 2.5 ml of oxygenated ACSF with 25l of a 1 mM
fura-2 AM solution (in 100% DMSO; Invitrogen) for 20 –30 min. Slices were incubated in the dark, and the incubation solution was maintained at 35–37°C. Slices were perfused at a rate of 4 ml/min with continu-ously aerated (95% O2/5% CO2) normal ACSF at 35–37°C. Imaging was performed with a multibeam two-photon laser scanning system (Trimscope-LaVision Biotec) coupled to an Olympus microscope as de-scribed previously (Cre´pel et al., 2007). Images were acquired through a CCD camera (La Vision Imager 3QE), which typically resulted in a time resolution of⬃100 ms (2 ⫻ 2 binning; pixel size, 600 nm). Slices were imaged using a low-magnification, high numerical aperture objective (20⫻, numerical aperture 0.95; Olympus). The size of the imaged field was typically 430⫻ 380m2. Imaging depth was on average 80m below the surface (range, 50 –100m).
Analysis of multineuron calcium activity. Analysis of the calcium activ-ity was performed using a previously designed software for neocortical and hippocampal slice analysis (Alle`ne et al., 2008). To summarize briefly, this allowed (1) automatic identification of loaded cells, (2) mea-suring the average fluorescence transients from each cell as a function of time, and (3) detecting the onsets and offsets of calcium signals. To quantify synchronous activity patterns, we used two parameters: quency and amplitude and duration of synchronous events. The fre-quency of a network pattern was derived from the average time interval between two peaks of synchronous activity. The amplitude of a network pattern in a given movie was the average of the maximum of cells coactive in each peak of synchrony across the movie. To identify peaks of
synchro-nous activity that included more cells than ex-pected by chance, we used interval reshuffling (randomly reordering of intervals between events for each cell) to create set of surrogate event sequences. Reshuffling was performed 1000 times for each movie, and a surrogate his-togram was constructed for each reshuffling. The threshold corresponding to a significance level of p⬍ 0.05 was estimated as the number of coactive cells exceeded in a single frame in only 5% of these histograms. This threshold was used to calculate the duration of a syn-chronous activity pattern that is the number of successive frames for which the number of coactive cells was superior to threshold. Ex-perimental values are given as means ⫾ SEMs. Student’s t test and2test were used for statistical comparisons.
Chemical identification of contaminants
One milligram ofDL-BHB was dissolved in a
mixture of ethyl acetate and pentafluoropropi-onic anhydride (PFPA) (Aldrich) and com-posed of 80l each. After 30 min at 80°C, 1 l of the mixture was directly injected into a gas chromatography–mass spectrometry (GC–MS) instrument (Agilent Technologies) equipped with a 6890N GC and a 5973 MSD system.
Electron impact mass spectrum of dibenzylamine (DBA) as PFPA deriv-ative was identified in theDL-BHB acid standard from Acros Organics but
not inDL-BHB from Sigma-Aldrich. A PFPA was identified as its
molec-ular ion at a mass-to-charge ratio (m/z) of 383 and a typical fragmenta-tion with the predicted M-91 at m/z of 252 and the benzyl core at m/z of 91. Chromatographic conditions were as follows: DB-1MS capillary col-umn (Agilent Technologies), 30 m⫻ 0.25 mm inner diameter, film thickness of 1.0m; column temperature, 100–260°C at a rate of 4°C/ min; injection port, 280°C; gaz vector helium at 1 ml/min (10.4 psi); electron impact mode at an ionization energy of 70 eV. Comparisons of mass spectra were done by using a standard of DBA treated in the same conditions.
Pharmacology
Bicuculline, 2,3-dihydroxy-6-nitro-7-sulfonyl-benzo[f]quinoxaline,D
-APV, DNQX, and CNQX were purchased from Tocris Bioscience;DL-BHB
was from Sigma-Aldrich (catalog #54965, batch #1316259 31908044) and from Acros Organics. Isoguvacine, dybenzylamine, GABA, lactate, and pyruvate were from Sigma. TTX was from Ascent Scientific Ltd.
Results
Blood concentrations of
D-BHB, lactate, and pyruvate in
neonatal rodent
In newborn rodents, the blood levels of active
D-BHB are in the
submillimolar range (see Discussion). We reinvestigated this
is-sue, using an assay that determines
D-BHB levels, and found that,
in P7 rats, the
D-BHB plasma concentration was 0.91
⫾ 0.15 m
M(n
⫽ 14). We measured
D-BHB levels after administration of
insulin (0.33 U/kg, i.m.) to inhibit fatty acid oxidation and
2-mercaptoacetate (100 mg/kg, i.p.) to inhibit mitochondrial
acyl-CoA dehydrogenase with 5 m
Mglucose to prevent
hypogly-cemia. This treatment strongly and rapidly (within 1 h) reduced
the plasma level of the
D-BHB to 0.14
⫾ 0.03 m
M(n
⫽ 14).
Conversely, injections of exogenous 4 m
M DL-BHB increased the
blood
D-BHB concentration to 1.74
⫾ 0.42 m
M(n
⫽ 7). Using
conventional hospitals kits, plasma lactate and pyruvate levels at
P4 were of 1.5
⫾ 0.25 m
Mand 123
⫾ 16
M, respectively (n
⫽ 5).
Therefore, plasma
D-BHB, pyruvate, and lactate concentrations
are much lower than those used by Zilberter and colleagues (4
m
M DL-BHB, 5 m
Mpyruvate, and 5 m
Mlactate). The difference
is particularly high for pyruvate (40-fold) (see Discussion).
DL
-BHB (from Sigma-Aldrich) does not alter the driving force
for somatic GABA
AR-mediated currents
The binding of GABA to GABA
Areceptors opens channels
permeable notably to chloride. The resulting trans-membrane
chloride current can either depolarize or hyperpolarize the
mem-brane according to its E
GABAand E
mof the cell. As indicated in
previous studies, measurement of E
musing NMDAR channels as
the voltage sensor has an advantage over the other microelectrode
techniques especially in immature cells with high input resistance
(Tyzio et al., 2003). Single NMDAR and GABA
AR channels were
recorded from either the same neurons or from different neurons
to determine E
mand driving force for somatic GABA
AR-mediated
currents (DF
GABA) and thereby allow a precise determination of
E
GABA(Tyzio et al., 2008). As in the studies by Rheims et al. (2009)
and Holmgren et al. (2010), slices were incubated in 4 m
M DL-BHB
(Sigma-Aldrich) for at least 40 min and then transferred to a
record-ing chamber in which they were continuously superfused with the
same concentration of
DL-BHB.
We first determined E
GABAby alternate cell-attached
record-ings (in sum, four attempts for every cell) of NMDAR and
GABA
AR single channels from the soma of the same neuron in
the neocortex (Fig. 1). As shown in Table 1,
DL-BHB altered
nei-ther E
mnor E
GABAin neocortical neurons (P4 –P5 rats) of both
superficial and deep layers (all p
⬎ 0.05). Similar results were
obtained when single NMDAR and GABA
AR channels were
re-corded in different neurons (to avoid the potential local
mem-brane alterations): DF
GABAin hippocampal CA3 pyramidal cells
was not significantly different in control and 4 m
M DL-BHB
(Ta-ble 2) ( p
⬎ 0.05); E
min the same population of cells also did not
change significantly in
DL-BHB ( p
⬎ 0.05). Similarly, in both
superficial and deep layers of the neocortex, DF
GABAwas strongly
depolarizing in control conditions and in the presence of
DL-BHB; the values of E
mwere similar in control conditions and in
the presence of
DL-BHB (all p
⬎ 0.05) (Table 2). Therefore,
DL-Figure 1. Estimation of EGABAby double recordings of DFGABAand Emfrom the same neocortical cell. A, Scheme of consecutive cell-attached recordings of single NMDAR and GABAAR channels. First we recorded from the same neuron in control conditions for NMDAR channels (for Em) and then GABAAR channels (for DFGABA). These two measurements allow us to determine EGABAfor this neuron. Then, we appliedDL-BHB for 40 min and repeated the recordings with the same sequence (NMDAR and then GABAAR channels). Thus, every cell studied was patched four times. Representative traces of recordings of the single-channel openings are shown below. B, Representative plot of I–V relationships of single GABAAR and NMDAR channels used for estimation of EGABAin neocortical pyramidal cell (EGABA⫽DFGABA⫹Em). Each point is mean amplitude of⬃30openingsatagivenpipettepotential(Vp). The reversal potential that corresponds to DFGABAwas estimated by the exponential growth fit of the I–V curve. The current– voltage relationships of NMDAR channels were best fitted with linear function (Tyzio et al., 2003, 2008). Note that application of
BHB alters neither E
mnor E
GABAin neocortical and hippocampal
neurons.
DL
-BHB does not alter the polarity of synaptic
GABAergic responses
We then used perforated patch recordings to determine the
ef-fects of
DL-BHB on synapse-driven GABA
AR-mediated
postsyn-aptic potentials (GPSPs). In immature hippocampal slices,
GABA released from MF terminals exerts a depolarizing action
on CA3 principal cells in gramicidin perforated patch recordings
(Sivakumaran et al., 2009). With gramicidin patch recordings
from CA3 pyramidal cells, the resting membrane potential was
⫺56 ⫾ 2.2 mV (n ⫽ 10) (Fig. 2A–C). The more depolarized E
mvalue found with these experiments (with respect to that
ob-served in cell-attached recordings) could be attributed to the
leakage via gigaseal contact introduced in perforated patch
re-cordings (Barry and Lynch, 1991; Tyzio et al., 2003). In the
pres-ence of 20
MDNQX and 50
M D-AP-5 to block AMPA and
NMDA receptors, respectively, local stimulation of GABAergic
interneurons in stratum radiatum generated PSPs with reversed
polarity (E
GPSPs) at
⫺47.6 ⫾ 3.3 mV (n ⫽ 10). The driving force
for GABA was
⬃9 mV positive to E
m, indicating that GABA is
depolarizing from the resting potential as a result of the activity of
chloride accumulating NKCC1 cotransporter (Tyzio et al., 2003,
2007; Sipila et al., 2006). Addition of
DL-BHB (4 m
Mfor at least 40
min) altered neither E
m(
⫺60 ⫾ 1 mV) nor E
GPSPs(
⫺48 ⫾ 2 mV;
n
⫽ 11), with an average DF
GABAof
⬃12 mV. The values of E
mand E
GPSPsobtained in the presence of
DL-BHB were not
signifi-cantly different from those obtained in the absence of
DL-BHB
( p
⬎ 0.05 for both) (Fig. 2A–C). Therefore,
DL-BHB does not
alter E
GPSPs.
We also used gramicidin perforated patch recordings to
de-termine whether
DL-BHB alters the response evoked by GABA
Areceptor agonists. The reversal of isoguvacine-evoked responses
(E
iso) was determined in control and during bath application of 4
m
M DL-BHB for at least 40 min. Isoguvacine (40
M, from a
holding potential of
⫺60 mV) generated inward currents that
reversed at
⫺48 ⫾ 3 mV in control (n ⫽ 6) and ⫺47 ⫾ 3 mV in
the presence of
DL-BHB (n
⫽ 6). These values were not
signifi-cantly different ( p
⬎ 0.05) (Fig. 2D).
Furthermore, in three cells kept in current-clamp conditions
in the presence of blockers of fast synaptic transmission (DNQX
at 50
M,
D-APV at 50
M, and bicuculline at 10
M), bath
appli-cation of 4 m
M DL-BHB altered neither the resting membrane
potential nor the input resistance [values for E
mand R
inwere
⫺60 ⫾ 3 and ⫺61 ⫾ 2 mV (n ⫽ 6) and 625 ⫾ 37 and 575 ⫾ 42
M⍀ (n ⫽ 6, all p ⬎ 0.05), before and 40 min after
DL-BHB
application, respectively] (supplemental Fig. 1, available at www.
jneurosci.org as supplemental material).
DL
-BHB does not alter the excitatory effects of GABA
To determine whether
DL-BHB alters the excitatory actions of
GABA, we focally applied GABA on neurons recorded in
cell-attachedconfigurationinthepresenceofCNQX(10
M),APV(40
M),
and CGP 55845 ((2S)-3-[[(1S)-1-(3,4-dichlorophenyl)ethyl]
amino-2-hydroxypropyl](phenylmethyl)phosphinic acid
hydrochlo-ride) (2
M) to block ionotropic glutamate and metabotropic GABA
Breceptors.
In these conditions, GABA triggered spikes and this action was
reversibly blocked by the GABA
Areceptor antagonists (data not
shown), indicating that they were generated by the activation of
GABA
Areceptors. As shown in Figure 3A, focal applications of
GABA, in the hippocampus in the presence of
DL-BHB generated
a similar number of spikes as in controls (1.29
⫾ 0.09 spikes in
control and 1.44
⫾ 0.1 in
DL-BHB, n
⫽ 7, p ⬎ 0.05). Similar
results were obtained with neocortical layer V pyramidal neurons
(1.39
⫾ 0.06 spikes in control and 1.23 ⫾ 0.05 in the presence of
DL
-BHB, n
⫽ 6, p ⬎ 0.05). The specific NKCC1 antagonist
bu-metanide (10
M) prevented GABA from inducing spikes
gener-ated by focal applications of GABA in the presence of the same
mixture and
DL-BHB, confirming that they were generated by
depolarizing actions of GABA (Fig. 3B) (n
⫽ 3). Therefore,
DL-BHB applied in conditions similar to those used by Rheims et al.
(2009) and Holmgren et al. (2010) does not alter the driving force
and reversal potential of somatic (extrasynaptic) and synaptic
GABA activated responses, the resting membrane potential,
and excitatory actions of GABA on neocortical or
hippocam-pal neurons.
DL
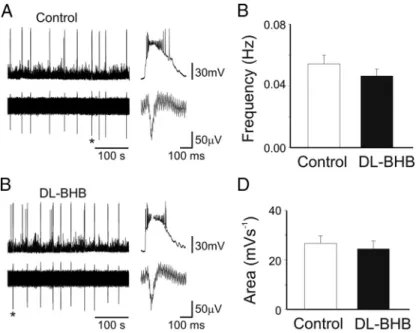
-BHB does not alter GDPs
We next examined whether
DL-BHB affects GDPs, which are
de-pendent on depolarizing actions of GABA and are very sensitive
to alterations of neuronal excitability and to insufficient energy
supply (Ben-Ari et al., 1989; Dzhala et al., 1999; Alle`ne et al.,
2008). As shown in Figure 4, GDPs occurred synchronously with
extracellular field potentials and were readily identified in
whole-cell recordings by their characteristic shape and kinetics.
DL-BHB
altered neither the frequency [0.054
⫾ 0.005 and 0.046 ⫾ 0.004
Hz in control (n
⫽ 7) and
DL-BHB (n
⫽ 8), respectively; p ⬎ 0.05]
nor the integrated area under GDPs [26.6
⫾ 3.1 mV/s (n ⫽ 6)
and 24.3
⫾ 3.2 mV/s (n ⫽ 7) in control and
DL-BHB,
respec-tively; p
⬎ 0.05].
We next used fast multineuron calcium imaging to measure
the actions of
DL-BHB on neuronal activity synchronization in
cortical networks. This approach enables investigating the
spatio-temporal dynamics of spontaneous neuronal activity in large
neocortical and hippocampal networks with single-cell
reso-lution. With this approach, immature hippocampal and
neo-cortical networks display similar correlated activity patterns
composed of synchronous plateau assemblies (SPAs) and GDPs
that are both strongly modulated by the excitatory action of
GABA (Cre´pel et al., 2007; Alle`ne et al., 2008; Bonifazi et al.,
2009). These patterns can be easily identified in single cells based
on their characteristic calcium dynamics because SPAs are
asso-ciated with long-lasting (
⬃10–20 s on average) calcium plateau
potentials synchronized across small groups of neurons, whereas
the intracellular calcium correlate of GDPs are fast calcium
transients (
⬃250 ms) decay (Cre´pel et al., 2007; Alle`ne et al.,
2008) synchronizing larger neuronal populations. To
deter-mine whether
DL-BHB affected neuronal calcium dynamics,
multibeam two-photon imaging in neocortical slices loaded with
a calcium indicator (fura-2 AM) was performed. Slices were
in-cubated in 4 m
M DL-BHB for at least 40 min. Custom software was
used to measure fluorescence changes in each cell and to mark the
onset and offset of individual calcium transients (see Materials
Table 1. Double measurement of DFGABAand Emfrom the same neocortical cell
reveal thatDL-BHB does not alter EGABAin pyramidal neocortical cells
Regular ACSF ACSF⫹DL-BHB at 4 mM
n 6 6
Em(mV) ⫺81.7 ⫾ 2.6 ⫺79.2 ⫾ 2.9
DFGABA(mV) 14.8⫾ 3.3 13.7⫾ 3.1 EGABA(mV) ⫺66.9 ⫾ 3.9 ⫺65.5 ⫾ 3.1
DFGABAinferred from I–V curves of single GABAAR channels, Eminferred from I–V curves of single NMDAR, and the
and Methods). In these conditions, we did not find any
signifi-cant decrease in either the fraction of neurons producing SPAs or
the frequency and amplitude of GDPs in neocortical slices ( p
⬎
0.05, n
⫽ 5 slices) (Fig. 5, Table 3). As a positive control for
excitatory GABA actions, we applied the NKCC1 antagonist
bu-metanide (10
M). Bumetanide significantly reduced the
occur-rence of GDPs both in regular ACSF and in the presence of
DL-BHB
(Fig. 5). Frequency and amplitude of GDPs were reduced to 26
⫾
21 and 38
⫾ 10%, respectively, in regular ACSF (n ⫽ 7, p ⬍ 0,05)
and to 12
⫾ 7 and 56 ⫾ 34%, respectively, in
DL-BHB conditions
(n
⫽ 5, p ⬍ 0.05). As reported previously in hippocampal slices
(Cre´pel et al., 2007), the fraction of SPA cells was significantly
increased in the presence of bumetanide (10
M, to 535
⫾ 192
and 349
⫾ 104% in regular ACSF and
DL-BHB, respectively, n
⫽
5, p
⬍ 0.05). The effects of bumetanide cannot be reconciled with
a reduction of the depolarizing action of GABA in the presence of
DL
-BHB (Rheims et al., 2009) (see Discussion).
A contamination in
DL-BHB (from Acros Organics)
reduces DF
GABAWhile conducting our experiments, we found that
DL-BHB from
another source (Acros Organics) gave different results. In slices
incubated in 4 m
M DL-BHB (Acros Organics for at least 40 min),
DF
GABAmeasured using cell-attached recordings of GABA
AR
channels was significantly reduced in CA3 pyramidal cells from
12.2
⫾ 3.9 mV (n ⫽ 6) to 0.47 ⫾ 3.04 mV (n ⫽ 10, p ⬍ 0.05; data
not shown). Similar effects of
DL-BHB (Acros Organics) were
found with perforated patch recordings of GPSPs evoked by local
stimulation of GABAergic interneurons in stratum radiatum in
the presence of DNQX (20
M) and
D-APV (50
M). As shown in
supplemental Figure 2 (available at www.jneurosci.org as
supple-mental material),
DL-BHB from Acros Organics (applied for at
least 45 min) hyperpolarized the membrane and shifted E
GPSPstoward more negative values (on average, on seven neurons E
m Table 2.DL-BHB does not alter DFGABAand Emin principal cells of rat hippocampus and neocortex: changes of DFGABAdetermined with cell-attached recording of GABAARchannels in hippocampal CA3 cells and both superficial and deep layers of neocortex
Hippocampus Neocortex
regular ACSF ACSF⫹DL-BHB at 4 mM regular ACSF ACSF⫹DL-BHB at 4 mM
Em(mV) ⫺77.8 ⫾ 3.5 (n ⫽ 9) ⫺76.2 ⫾ 4.2 (n ⫽ 12) ⫺72.2 ⫾ 5.4 (n ⫽ 5) ⫺70.6 ⫾ 3.2 (n ⫽ 7) DFGABA(mV) 19.8⫾ 6.5 (n ⫽ 12) 16.5⫾ 3.5 (n ⫽ 14) 22.9⫾ 4.2 (n ⫽ 10) 18.2⫾ 3.6 (n ⫽ 11)
Note that, in this set of experiments, DFGABAand Emwere examined in different cells.
Figure 2. DL-BHB does not alter the polarity of GABAergic responses in CA3 pyramidal cells. A, Example of GABAA-mediated postsynaptic potentials evoked in control and in the presence of 4 mM DL-BHB at four different holding potentials (to the left of the traces) by local stimulation of GABAergic interneurons in stratum radiatum. B, The mean GPSP amplitudes obtained in 11 cells are plotted against membrane potentials (Em). Vertical bars represent the SEM. C, Each symbol represents the EGPSPsand the Emof individual cells. Average values are shown on the left of each group (control: EGPSPs⫽⫺47.6⫾3.3mV,Em⫽⫺56⫾2.2mV,n⫽10;inDL-BHB: EGPSPs⫽ ⫺48.2⫾2mV,Em⫽⫺60⫾1mV,n⫽11).D,TheEisowas determined in control and during bath application ofDL-BHB (4 mM, for at least 40 min). The isoguvacine application (40M) generated the responses, which reversed at⫺48⫾3mVincontrol(n⫽6)and⫺47⫾3mV in DL-BHB (n⫽ 6), respectively. These values were not significantly different ( p ⬎ 0.05).
Figure 3. DL-BHB does not alter the excitation produced by focal application of GABA in both
hippocampus and neocortical pyramidal neurons. A, Each column represents number of spikes induced by focal application of GABA (top traces) recorded in cell-attached mode from hip-pocampus and neocortex in control and in presence of 4 mM DL-BHB. B, Bumetanide (10M)
fully blocked the spikes generated by focal applications of GABA in the presence of the same mixture andDL-BHB (n⫽ 3).
and E
GPSPswere
⫺80 ⫾ 4 and ⫺67 ⫾ 4 mV, respectively). In
additional experiments, we tested the actions of
DL-BHB (Acros
Organics) on GDPs using calcium imaging. As shown in
supple-mental Figure 3 (available at www.jneurosci.org as supplesupple-mental
material),
DL-BHB (Acros Organics) reduced the frequency and
amplitude of GDPs in neocortical slices (from 0.12
⫾ 0.02 to
0.02
⫾ 0.01 Hz and from 22 ⫾ 3 to 5 ⫾ 4% of active cells, n ⫽ 5,
p
⬍ 0.05). Therefore,
DL-BHB (Acros Organics) reduces
DF-GABA
and alters GDPs.
Because previous studies reported the presence of a
contami-nant in
L-BHB (Donevan et al., 2003) (see Discussion), we
de-cided to test whether a similar contaminant was also present in
DL
-BHB obtained from this source (Acros Organics). Using a
GC–MS instrument, several contaminants were found in this
source of
DL-BHB, notably DBA as PFPA derivative identified in
the
DL-BHB from Acros Organics (supplemental Fig. 4, available
at www.jneurosci.org as supplemental material) but not in
DL-BHB (Sigma-Aldrich; data not shown). We therefore tested the
actions of DBA on DF
GABAand found that 50
MDBA switched
DF
GABA, determined with single-channel recordings, from
depo-larizing 12.8
⫾ 2.8 mV (n ⫽ 10) to hyperpolarizing ⫺2.9 ⫾ 2.2
mV (n
⫽ 10, p ⬍ 0.001; data not shown). With whole-cell
record-ings, DBA also blocked GDPs in a concentration-dependent way
with an EC
50of 57
M(supplemental Fig. 5, available at www.
jneurosci.org as supplemental material). The dose–response
curve was steep: whereas at 60
MDBA severely reduced the
frequency of GDPs from 0.046
⫾ 0.007 to 0.01 ⫾ 0.002 Hz, at 80
Mit completely abolished them (n
⫽ 10). These observations
suggest that
DL-BHB does not alter GABA signals, but care must
be taken when using BHB compounds to ensure absence of
con-taminants. We next investigated the actions of pyruvate on the
same parameters.
High but not physiological concentrations of pyruvate affect
GABA signaling
We first tested the effect of pyruvate at 5 m
Mon DF
GABAin
single-channel recordings of CA3 pyramidal cells from P7 rat
hip-pocampus. DF
GABAshifted from 12.2
⫾
5.7 mV in control (n
⫽ 9) to 0.4 ⫾ 3 mV
in pyruvate (n
⫽ 9, p ⬍ 0.01; data not
shown). In contrast, more relevant
physiological concentrations (200
M)
did not significantly change DF
GABA(7.1
⫾ 3.2 mV in control, n ⫽ 7 and
6.7
⫾ 2.5 mV in pyruvate, n ⫽ 8, p ⬎
0.05; data not shown). Therefore,
pyru-vate does not affect DF
GABAat
physio-logical levels and alters DF
GABAonly at
excessively high concentrations.
Gramicidin perforated patch
experi-ments were performed to assess whether
pyruvate alters E
mand E
GPSPs. Like
DL-BHB, the addition of a physiological
con-centration of 200
Mpyruvate to the
ACSF did not modify E
mand E
GPSPs(Fig.
6). E
mvalues were
⫺56.8 ⫾ 0.9 and
⫺57.1 ⫾ 1.02 mV in control and in the
presence of pyruvate, respectively ( p
⬎
0.05, n
⫽ 7). In contrast, 5 m
Mpyruvate
caused a negative shift of E
GPSPs(from
⫺48.3 ⫾ 1.9 to ⫺55.7 ⫾ 3 mV, n ⫽ 7)
without altering E
m(E
mvalues were
⫺56.8 ⫾ 0.9 and ⫺56.6 ⫾ 1.8 mV in
con-trol and in the presence of 5 m
Mpyruvate,
respectively, n
⫽ 7). The driving force for GABA was ⬃0.9 mV
positive to E
m, indicating that GABA does not exert a
depolariz-ing action. The E
GPSPsvalue observed in the presence of 5 m
Mpyruvate was significantly different from that obtained in control
( p
⫽ 0.003) or in the presence of 200
Mpyruvate ( p
⫽ 0.005).
E
mand E
GPSPswere unaffected by the further addition of
DL-BHB
to 5 m
Mpyruvate. In the presence of 4 m
M DL-BHB and 5 m
Mpyruvate, E
mand E
GPSPswere
⫺57.4 ⫾ 2.5 and ⫺59.6 ⫾ 2.9 mV,
respectively (n
⫽ 6). These values are similar to those obtained
when cells were exposed only to pyruvate (data not shown).
Furthermore, with extracellular field potential recordings
from the CA3 region (P4 –P7), pyruvate at a physiological
con-centration did not affect the frequency of GDPs (0.06
⫾ 0.008
and 0.06
⫾ 0.01 Hz in control and in the presence of 200
Mpyruvate, respectively; p
⬎ 0.05, n ⫽ 6) (Fig. 7). In contrast, in the
presence of 5 m
Mpyruvate, the frequency of GDPs severely
de-pressed (from 0.06
⫾ 0.008 to 0.02 ⫾ 0.007 Hz, p ⫽ 0.005, n ⫽ 6).
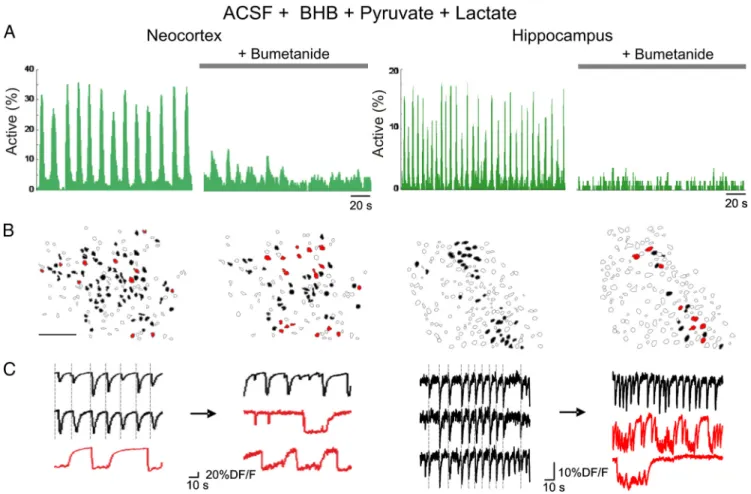
Similar observations were made with imaging techniques. We
monitored spontaneous neuronal activity in neocortical and
hip-pocampal slices bathed in mACSF that mimics physiological
con-ditions (lactate at 1.5 m
M, pyruvate at 150
M, and
DL-BHB at 2
m
M; see Discussion). There was no change in GDPs or SPA
pat-terns of activity (Fig. 8, Table 4) ( p
⬎ 0.05, five neocortical slices
and three hippocampal slices). Indeed, the frequency of
neocor-tical GDPs in mACSF was 0.1
⫾ 0.02 Hz compared with 0.12 ⫾
0.02 Hz in control conditions, and the amplitude of neocortical
GDPs was 24
⫾ 4 compared with 22 ⫾ 3% of active cells in
regular ACSF. The frequency of hippocampal GDPs in mACSF
was not affected either (0.07
⫾ 0.03 vs 0.1 ⫾ 0.03 Hz in control
conditions). In contrast, pyruvate (5 m
M), added to regular
ACSF, significantly reduced the frequency and amplitude of
hip-pocampal GDPs to 8
⫾ 7 and 53 ⫾ 33% of control conditions,
respectively (supplemental Fig. 6) (n
⫽ 5, p ⬍ 0.05). Therefore,
pyruvate alters GABA postsynaptic currents and GDPs only at
high nonphysiological concentrations.
Figure 4. DL-BHB does not alter spontaneous neuronal activity patterns at early postnatal stages in hippocampal slices. A, B,
Individual traces of spontaneous GDPs recorded at⫺70 mV from CA3 pyramidal cell (top traces) and field potentials (bottom traces) in slice exposed to ACSF (control, A) or ACSF plusDL-BHB at 4 mM. B,DL-BHB did not alter the frequency or the shape of GDPs
(shown on the right in an expanded timescale). C, D, Each column represent the mean GDPs frequency (C) or area (D) in control (white; n⫽ 6) or during bath application ofDL-BHB (black; n⫽ 7). *p ⬍ 0.01.
Discussion
We show that neither
DL-BHB, used in similar concentrations
as Zilberter and colleagues, nor pyruvate at physiologically
relevant concentrations alters GABA depolarizing actions and
GDPs, suggesting that depolarizing GABA and GDPs in
im-mature neurons are not attributable “to energy deprived
con-ditions when relying only on glucose” (Rheims et al., 2009;
Holmgren et al., 2010).
Possible reasons for the discrepancies
DL
-BHB at 4 m
M(Sigma-Aldrich) had no effects on (1) E
m,
E
GABA, and DF
GABAin somatic recordings of single GABA and
NMDA channels, (2) E
m, synaptic GABAergic potentials and
the responses evoked by GABA application in gramicidin
perforated patch recordings, (3) spikes generated by GABA
in cell-attached recordings, and (4) frequency of GDPs or
SPAs relying on calcium imaging and electrophysiological
recordings.
The wide range of E
GABAvalues reported by Holmgren et al.
(2010) suggests a heterogeneity possibly attributable to pooling
different ages particularly between P1 and P4 in which major
shifts occur in E
GABA(Tyzio et al., 2006, 2007) in superficial and
deep neocortical layers neurons or CA1 and CA3 pyramidal
neurons with their different age (Ben-Ari et al., 2007; Rheims
et al., 2008). Additional explanations to the discrepancy
be-tween the present study and the work of Zilberter and
col-leagues include the experimental approaches to measure
E
GABA. (1) Cell-attached recordings of GABA channels
with-out potassium channel blockers in the pipette could be
con-taminated by potassium channels and shift the measures to
potassium reversal. (2) Prolonged activation of GABA
recep-tors by long (2 s) isoguvacine applications and voltage ramps
at the peak of the response used to determine E
GABAcan be
associated with profound changes in ionic distribution. Here,
we used brief (50 –200 ms) isoguvacine applications and
syn-aptic stimulations at different holding potentials to minimize
the error. (3) The “random” burst protocol used to record the
spikes evoked by synaptic activation of GABA receptors may
introduce activity-dependent disturbance in ionic gradients
(the same applies for repetitive puff application of
isogu-vacine). This was controlled in the present study by wash in
Figure 5. DL-BHB does not alter spontaneous neuronal activity patterns in neocortical slices. A, Histograms indicating the fraction of active cells as a function of time in calcium movies in regular
ACSF and in the presence of 4 mM DL-BHB (Sigma-Aldrich). Each peak of synchronous neuronal activity in the histograms corresponds to a GDP. GDPs were strongly reduced in the presence of the
NKCC1 antagonist bumetanide (10M) in neocortical slices from P7 rats. B, Automatically detected contours of the imaged cells: open contours indicate silent cells, black filled contours indicate cells
involved in GDPs, and red filled contours are SPA cells. Note that the number of SPA cells relative to the number of active cells increased in the presence of 10Mbumetanide in the neocortex and
hippocampus (scale bar, 100m). C, Calcium fluorescence traces of representative cells implicated in GDPs (black) and SPAs (red). Note that some GDP cells display an SPA pattern of activity after adding bumetanide (middle traces).
Table 3. Dynamics of cortical GDPs and SPAs in regular ACSF and in the presence of
DL-BHB (Sigma-Aldrich)
Regular ACSF ACSF⫹DL-BHB at 4 mM
n 7 5
GDPfreq(Hz) 0.12⫾ 0.02 0.14⫾ 0.05
GDPamp(%) 22⫾ 3 22⫾ 4
SPA cells (%) 8⫾ 2 17⫾ 11
GDPfreq, Frequency of occurrence of GDPs (in hertz); GDPamp, fraction of active cells involved in GDPs (percentage);
and washout of bicuculline or bumetanide. Finally, the
non-invasive quantitative determination of the percentage of
neu-rons active during SPAs and GDPs suggests that both
DL-BHB
and pyruvate have no effects on these patterns.
The presence of a contaminant dibenzylamine in
DL-BHB
(Acros Organics) that changes DF
GABAand E
GABAis important
for future studies. DBA mediates effects thought previously to be
attributable to
DL-BHB blockade of cardiac K
⫹channels and
anticonvulsive actions of ketone bodies (Doepner et al., 1997,
2001; Rho et al., 2002; Donevan et al., 2003). Investigations using
DL
-BHB must take this parameter into account.
Physiologically relevant concentrations of
D-BHB, lactate,
and pyruvate
Neonatal plasma concentrations of
D-BHB (present results; see
also Nehlig and Pereira de Vasconcelos, 1993; Lust et al., 2003;
Vannucci and Simpson, 2003; Erecinska et al., 2004; Nehlig,
2004) are significantly lower than those used by Rheims et al.
(2009) and Holmgren et al. (2010), particularly because only a
fraction (40%) of plasma
D-BHB is found in neonatal cortex
(Lust et al., 2003). In addition, the argument that 4 m
M DL-BHB is
equivalent to 2 m
Mactive
D-BHB (Rheims et al., 2009) is
invali-dated by the observations that
L-BHB exerts complex
biologi-cal actions (Moore et al., 1976; Webber and Edmond, 1977;
Herzberg and Gad, 1984; Eaton et al., 2003; Tsai et al., 2006; Chou
et al., 2008). Also, ketogenic diet reduces glucose utilization by
10% per millimolar plasma ketone bodies (Robinson and
Williamson, 1980; Harding and Charlton, 1990; LaManna et al.,
2009), hampering the interpretation and relevance of
observa-tions made using ACSF with glucose and
DL-BHB.
The lactate (5 m
M) and pyruvate (5 m
M) concentrations used
by Holmgren et al. (2010) are never observed in postnatal
phys-iological conditions. Plasma lactate levels are high in utero (10
m
M), shift to 3 m
Mduring the presuckling period, and remain
thereafter close to 1 m
M(Medina, 1985), and even then glucose
supplies most of the energy (Burd et al., 1975; Jones et al., 1975;
Pe´gorier et al., 1977). The plasma lactate/pyruvate ratio is close to
10 (with 100
Mpyruvate), and higher lactate and (or) lactate/
pyruvate ratios are only observed in dystonia, subarachnoid
hem-orrhage, brain traumas, epilepsies, pyruvate dehydrogenase
mutations, and other severe pathological conditions (Owen et al.,
1967; Medina, 1985; Fernandez et al., 1986; Mintun et al., 2004;
Bjerring et al., 2008; Brody et al., 2008; Rex et al., 2009). In
keep-ing with this, we found pyruvate levels
⬃120
Mthat are identical
to human levels and 40-fold lower than the concentrations used
by Zilberter and colleagues. At physiological levels, pyruvate and
lactate had no effects on excitatory actions of GABA, DF
GABA, and
GDPs.
The reduction of DF
GABAand GDPs by exceedingly high
con-centrations of pyruvate (5 m
M) is most likely attributable to the
acidosis produced at these concentrations. Agents that alter tissue
pH alter intracellular chloride (Kaila and Voipio, 1987; Kaila et
al., 1993; Chesler, 2003; Glykys et al., 2009; Kim and Trussell,
2009), neuronal excitability, and seizures (Roos and Boron, 1981;
Aram and Lodge, 1987; Balestrino and Somjen, 1988; Jarolimek
et al., 1989; Kaila, 1994; Bonnet et al., 2000; Dulla et al., 2005,
2009; Ziemann et al., 2008). Propionate,
D- and
L-lactate reduce
GDPs, although only
L-lactate is metabolically active (Roos and
Boron, 1981; Dulla et al., 2005; Ruussuvori et al., 2010).
There-fore, depolarizing actions of GABA are not attributable to the
absence of
DL-BHB or lactate/pyruvate in the ACSF.
Ketone bodies and GABA signaling
Ketosis (Nehlig and Pereira de Vasconcelos, 1993), like
trans-porters that import
D-BHB (Pellerin et al., 1998; Magistretti et al.,
1999; Bergersen et al., 2002; Pierre et al., 2002; Rafiki et al., 2003;
Vannucci and Simpson, 2003; Erecinska et al., 2004) or BHB
Figure 6. EGPSPsshift in the presence of high but not low concentrations of pyruvate. A, Examples of GABAA-mediated postsynaptic potentials evoked in control (white, left), in the presence of 200Mpyruvate (Pyr) (light gray, middle), and in the presence of 5 mMpyruvate
(dark gray, right). B, Open circles represent EGPSP(graph on the left) and Em(graph on the right) obtained in individual cells recorded in normal ACSF (white columns; left), in ACSF containing 200M(light gray; middle) or 5 mM(dark gray; right) pyruvate (n⫽ 7). Bars at the top of the columns represent the SEM. Note the negative shift of EGPSPsbut not in Emof cells exposed to 5 mMpyruvate. The mean EGPSPvalue obtained in 5 mMpyruvate was significantly different from that obtained in control ( p⫽ 0.003) and in 200Mpyruvate ( p⫽ 0.005). **p ⬍ 0.01.
Figure 7. High but not low concentrations of pyruvate reduce GDPs frequency. On the left, sample traces of spontaneous GDPs recorded from the same slice before (white symbol; top trace) or during exposure to 200Mpyruvate (Pyr) (light gray; middle trace) and 5 mMpyruvate
(dark gray; bottom trace). Note the reduction in GDPs frequency with 5 mMbut not 200M
pyruvate. On the right, each symbol represents the mean frequency value of GDPs obtained in individual slices before (white column) or during exposure to 200M(light gray) and 5 mM
(dark gray; right) pyruvate (n⫽7).BarsatthetopofthecolumnsrepresenttheSEM.Themean GDPs frequency value obtained in 5 mMpyruvate was significantly different from that obtained
dehydrogenase that metabolize it (Page et al., 1971; De Vivo et al.,
1975; Leong and Clark, 1984; Bilger and Nehlig, 1991; Clark et al.,
1993), peak during development well after the GABA shift. Fatty
acid oxidation supports gluconeogenesis (Pe´gorier et al., 1977),
and ketosis acts to “spare glucose for the emergence of audition,
vision and more integrated behavior whose appearance during
brain maturation seems to critically relate upon active glucose
supply” (Nehlig, 2004). GABA currents are not affected by
DL-BHB and ketogenic diet reduces seizures generated by GABA
receptor antagonists (Appleton and De Vivo, 1973, 1974; Bough
and Eagles, 1999; Bough et al., 2000; Thio et al., 2000; Sullivan et
al., 2003; Hartman et al., 2007; Yellen, 2008; Maalouf et al., 2009),
suggesting, contrary to Zilberter and colleagues, that the
antiepi-leptic actions of ketone bodies are not mediated by GABA
signal-ing. GABA depolarizes immature neurons in nonmammalian
animal species and in utero in rodents, suggesting that maternal
milk and ketone bodies are not required for that effect (Akerman
and Cline, 2006; Ben-Ari et al., 2007).
The NKCC1/KCC2 sequence in brain maturation
Contrary to the suggestions of Zilberter and colleagues (Rheims
et al., 2009; Holmgren et al., 2010), extensive pharmacological,
anatomical, and genetic observations suggest that the removal of
chloride in neonatal pups heavily depends on KCC2 (Li et al.,
2002; Rheims et al., 2008; Riekki et al., 2008; Zhu et al., 2008;
Takayama and Inoue, 2010). The parallel alterations of KCC2
and GABA polarity have been confirmed in a large variety of
animal species from invertebrates to humans (Rivera et al., 1999,
2005; Delpire, 2000; Payne et al., 2003; Sernagor et al., 2003;
Dzhala et al., 2005; Akerman and Cline, 2006; Liu et al., 2006;
Ben-Ari et al., 2007; Howard et al., 2007; Kahle et al., 2008; Reynolds
et al., 2008; Blaesse et al., 2009; Glykys et al., 2009; Stil et al., 2009;
Tanis et al., 2009; Boulenguez et al., 2010). KCC2 and E
GABAdevelopmental sequences are unlikely to depend on global
met-abolic diets because they are cell and sex specific (Kandler and
Friauf, 1995; Kandler et al., 2002; Balakrishnan et al., 2003;
Gulacsi et al., 2003; Lee et al., 2005; Lohrke et al., 2005; Banke and
McBain, 2006; Blaesse et al., 2006; Kim and Trussell, 2009;
Belenky et al., 2010). Neurons in which GABA remains
depolar-Figure 8. GDPs recorded in the presence of physiological concentrations of lactate, pyruvate, andDL-BHB are similar to those recorded in regular ACSF and are reduced by bumetanide. A,
Histograms indicating the fraction of active cells as a function of time in calcium movies in slices incubated with 1.5 mMlactate, 150Mpyruvate, 5 mMglucose, and 4 mM DL-BHB (Sigma-Aldrich)
for at least 1 h. Each peak of synchronous neuronal activity in the histograms corresponds to a GDP. GDPs were strongly reduced in the presence of the NKCC1 antagonist bumetanide (10M) in
neocortical and hippocampal slices from P7 rats. B, Automatically detected contours of the imaged cells: open contours indicate silent cells, black filled contours indicate cells involved in GDPs, and red filled contours are SPA cells. Note that the number of SPA cells relative to the number of active cells increased in the presence of 10Mbumetanide in both the neocortex and hippocampus (scale
bar, 100m). C, Calcium fluorescence traces of representative cells implicated in GDPs (black) and SPAs (red). Note that some GDP cells display an SPA pattern of activity after adding bumetanide (middle traces).
Table 4. Dynamics of cortical GDPs and SPAs in the neocortex and the hippocampus in the presence of physiological concentrations of lactate, pyruvate, andDL-BHB ACSF andDL-BHB⫹ Pyruvate ⫹ Lactate Neocortex Hippocampus
n 5 3
GDPfreq(Hz) 0.1⫾ 0.02 0.07⫾ 0.03
GDPamp(%) 60⫾ 10 13⫾ 1
SPA cells (%) 16⫾ 4 3⫾ 0.003
GDPfreq, Frequency of occurrence of GDPs (in hertz); GDPamp, fraction of active cells involved in GDPs (percentage);
izing do not express KCC2 (Price et al., 2005; Gilbert et al., 2007;
Pozas et al., 2008), and early overexpression of KCC2 in zebra fish
embryos (Reynolds et al., 2008) or cortical neurons (Chudotvorova
et al., 2005; Lee et al., 2005; Ben-Ari et al., 2007; Cancedda et al.,
2007; Wang and Kriegstein, 2008) alter GABA polarity, GABA
synapse formation, and neuronal development in vivo. KCC2 is
downregulated by activity and E
GABAshifts accordingly (Woodin
et al., 2003; Fiumelli et al., 2005).
Neonatal slices are not energy deprived in 10 m
Mglucose
be-cause they have a low rate of oxygen and glucose consumption
and are less susceptible to energy deprivation than adult slices
(Cherubini et al., 1989; Novotny et al., 2001; Tyzio et al., 2006).
Lowering glucose reduces GDPs, ATP levels, and mitochondrial
pH, confirming the sensitivity of GDPs to energy deprivation, but
these are not restored by lactate (Takata and Okada, 1995; Wada
et al., 1998; Takata et al., 2001) (Ruussuvori et al., unpublished
report). Slices and intact hippocampi sustain GDPs for hours
(Ben-Ari et al., 1989; Cherubini et al., 1989; Khalilov et al.,
1997, 2003; Leinekugel et al., 1997; Safiulina et al., 2006) and
are replaced by glutamate-driven early network oscillations
when energy is deprived (Alle`ne et al., 2008).
We conclude that the depolarizing action of GABA and
re-lated network-driven GDPs in immature cortical slices are not
attributable to metabolic insufficiency. Therefore, conventional
glucose containing ACSF provides adequate energy supply for
cortical slices in vitro.
References
Akerman CJ, Cline HT (2006) Depolarizing GABAergic conductances reg-ulate the balance of excitation to inhibition in the developing retinotectal circuit in vivo. J Neurosci 26:5117–5130.
Alle`ne C, Cattani A, Ackman JB, Bonifazi P, Aniksztejn L, Ben-Ari Y, Cossart R (2008) Sequential generation of two distinct synapse-driven network patterns in developing neocortex. J Neurosci 28:12851–12863. Appleton DB, De Vivo DC (1973) An experimental animal model for the
effect of ketogenic diet on epilepsy. Proc Aust Assoc Neurol 10:75– 80. Appleton DB, DeVivo DC (1974) An animal model for the ketogenic diet.
Epilepsia 15:211–227.
Aram JA, Lodge D (1987) Epileptiform activity induced by alkalosis in rat neocortical slices: block by antagonists of N-methyl-D-aspartate. Neuro-sci Lett 83:345–350.
Balakrishnan V, Becker M, Lo¨hrke S, Nothwang HG, Gu¨resir E, Friauf E (2003) Expression and function of chloride transporters during develop-ment of inhibitory neurotransmission in the auditory brainstem. J Neu-rosci 23:4134 – 4145.
Balestrino M, Somjen GG (1988) Concentration of carbon dioxide, intersti-tial pH and synaptic transmission in hippocampal formation of the rat. J Physiol 396:247–266.
Banke TG, McBain CJ (2006) GABAergic input onto CA3 hippocampal in-terneurons remains shunting throughout development. J Neurosci 26:11720 –11725.
Barry PH, Lynch JW (1991) Liquid junction potentials and small cell effects in patch-clamp analysis. J Membr Biol 121:101–117.
Belenky MA, Sollars PJ, Mount DB, Alper SL, Yarom Y, Pickard GE (2010) Cell-type specific distribution of chloride transporters in the rat suprachi-asmatic nucleus. Neuroscience 165:1519 –1537.
Ben-Ari Y (2001) Developing networks play similar melody. Trends Neuro-sci 24:354 –360.
Ben-Ari Y (2002) Excitatory actions of gaba during development: the nature of the nurture. Nat Rev Neurosci 3:728 –739.
Ben-Ari Y, Cherubini E, Corradetti R, Gaiarsa JL (1989) Giant synaptic po-tentials in immature rat CA3 hippocampal neurones. J Physiol 416:303–325.
Ben-Ari Y, Gaiarsa JL, Tyzio R, Khazipov R (2007) GABA: a pioneer trans-mitter that excites immature neurons and generates primitive oscilla-tions. Physiol Rev 87:1215–1284.
Bergersen L, Rafiki A, Ottersen OP (2002) Immunogold cytochemistry identifies specialized membrane domains for monocarboxylate transport in the central nervous system. Neurochem Res 27:89 –96.
Bilger A, Nehlig A (1991) Quantitative histochemical changes in enzymes involved in energy metabolism in the rat brain during postnatal develop-ment. I. Cytochrome oxidase and lactate dehydrogenase. Int J Dev Neu-rosci 9:545–553.
Bjerring PN, Hauerberg J, Frederiksen HJ, Jorgensen L, Hansen BA, Tofteng F, Larsen FS (2008) Cerebral glutamine concentration and lactate-pyruvate ratio in patients with acute liver failure. Neurocrit Care 9:3–7. Blaesse P, Guillemin I, Schindler J, Schweizer M, Delpire E, Khiroug L, Friauf
E, Nothwang HG (2006) Oligomerization of KCC2 correlates with de-velopment of inhibitory neurotransmission. J Neurosci 26:10407–10419. Blaesse P, Airaksinen MS, Rivera C, Kaila K (2009) Cation-chloride
cotrans-porters and neuronal function. Neuron 61:820 – 838.
Bonifazi P, Goldin M, Picardo MA, Jorquera I, Cattani A, Bianconi G, Represa A, Ben-Ari Y, Cossart R (2009) GABAergic hub neurons orchestrate synchrony in developing hippocampal networks. Science 326:1419 –1424. Bonnet U, Leniger T, Wiemann M (2000) Alteration of intracellular pH and activity of CA3-pyramidal cells in guinea pig hippocampal slices by inhi-bition of transmembrane acid extrusion. Brain Res 872:116 –124. Bough KJ, Eagles DA (1999) A ketogenic diet increases the resistance to
pentylenetetrazole-induced seizures in the rat. Epilepsia 40:138 –143. Bough KJ, Yao SG, Eagles DA (2000) Higher ketogenic diet ratios confer
protection from seizures without neurotoxicity. Epilepsy Res 38:15–25. Boulenguez P, Liabeuf S, Bos R, Bras H, Jean-Xavier C, Brocard C, Stil A,
Darbon P, Cattaert D, Delpire E, Marsala M, Vinay L (2010) Down-regulation of the potassium-chloride cotransporter KCC2 contributes to spasticity after spinal cord injury. Nat Med 16:302–307.
Brody DL, Magnoni S, Schwetye KE, Spinner ML, Esparza TJ, Stocchetti N, Zipfel GJ, Holtzman DM (2008) Amyloid-beta dynamics correlate with neurological status in the injured human brain. Science 321:1221–1224. Burd LI, Jones MD Jr, Simmons MA, Makowski EL, Meschia G, Battaglia FC
(1975) Placental production and foetal utilisation of lactate and pyru-vate. Nature 254:710 –711.
Cancedda L, Fiumelli H, Chen K, Poo MM (2007) Excitatory GABA action is essential for morphological maturation of cortical neurons in vivo. J Neurosci 27:5224 –5235.
Cherubini E, Ben-Ari Y, Krnjevic´ K (1989) Anoxia produces smaller changes in synaptic transmission, membrane potential, and input resis-tance in immature rat hippocampus. J Neurophysiol 62:882– 895. Chesler M (2003) Regulation and modulation of pH in the brain. Physiol
Rev 83:1183–1221.
Chou YC, Tsai YC, Chen CM, Chen SM, Lee JA (2008) Determination of lipoprotein lipase activity in post heparin plasma of streptozotocin-induced diabetic rats by high-performance liquid chromatography with fluorescence detection. Biomed Chromatogr 22:502–510.
Chudotvorova I, Ivanov A, Rama S, Hu¨bner CA, Pellegrino C, Ben-Ari Y, Medina I (2005) Early expression of KCC2 in rat hippocampal cultures augments expression of functional GABA synapses. J Physiol 566:671– 679.
Clark JB, Bates TE, Cullingford T, Land JM (1993) Development of enzymes of energy metabolism in the neonatal mammalian brain. Dev Neurosci 15:174 –180.
Cre´pel V, Aronov D, Jorquera I, Represa A, Ben-Ari Y, Cossart R (2007) A parturition-associated nonsynaptic coherent activity pattern in the devel-oping hippocampus. Neuron 54:105–120.
Delpire E (2000) Cation-chloride cotransporters in neuronal communica-tion. News Physiol Sci 15:309 –312.
DeVivo DC, Leckie MP, Agrawal HC (1975) D-beta-Hydrozybutyrate: a major precursor of amino acids in developing rat brain. J Neurochem 25:161–170.
Doepner B, Thierfelder S, Hirche H, Benndorf K (1997) 3-hydroxybutyrate blocks the transient K⫹outward current in myocardial mouse cells in a stereoselective fashion. J Physiol 500:85–94 [retraction in J Physiol (1998) 508:956].
Doepner B, Koopmann R, Knopp A, Hirche H, Benndorf K (2001) Diben-zylamine: a novel blocker of the voltage-dependent K⫹current in myo-cardial mouse cells. Naunyn Schmiedebergs Arch Pharmacol 364:9 –13. Donevan SD, White HS, Anderson GD, Rho JM (2003) Voltage-dependent
block of N-methyl-D-aspartate receptors by the novel anticonvulsant dibenzylamine, a bioactive constituent ofL-(⫹)-beta-hydroxybutyrate. Epilepsia 44:1274 –1279.