HAL Id: hal-02078529
https://hal-amu.archives-ouvertes.fr/hal-02078529
Submitted on 25 Mar 2019
HAL is a multi-disciplinary open access
archive for the deposit and dissemination of
sci-entific research documents, whether they are
pub-lished or not. The documents may come from
teaching and research institutions in France or
abroad, or from public or private research centers.
L’archive ouverte pluridisciplinaire HAL, est
destinée au dépôt et à la diffusion de documents
scientifiques de niveau recherche, publiés ou non,
émanant des établissements d’enseignement et de
recherche français ou étrangers, des laboratoires
publics ou privés.
Radiocarbon dating small carbonate samples with the
gas ion source of AixMICADAS
Yoann Fagault, Thibaut Tuna, Frauke Rostek, Edouard Bard
To cite this version:
Yoann Fagault, Thibaut Tuna, Frauke Rostek, Edouard Bard. Radiocarbon dating small carbonate
samples with the gas ion source of AixMICADAS. Nuclear Instruments and Methods in Physics
Research Section B: Beam Interactions with Materials and Atoms, Elsevier, 2019, 455, pp.276-283.
�10.1016/j.nimb.2018.11.018�. �hal-02078529�
UNCORRECTED
PROOF
Contents lists available at ScienceDirect
Nuclear Inst. and Methods in Physics Research, B
journal homepage: www.elsevier.com
Radiocarbon dating small carbonate samples with the gas ion source of AixMICADAS
Yoann Fagault
⁎, Thibaut Tuna, Frauke Rostek, Edouard Bard
⁎CEREGE, Aix Marseille Univ, CNRS, IRD, INRA, Collège de France, Technopôle de l’Arbois, BP 80, 13545 Aix-en-Provence, France
A R T I C L E I N F O
Keywords:
Radiocarbon
Accelerator mass spectrometry Gas ion source
Graphitization Dating carbonates Foraminifera Corals
A B S T R A C T
Since the beginning of AMS,14C analyses in foraminifera have been widely used to date deep-sea cores and to
estimate reservoir ages of surface and deep ocean layers. Classical AMS requires acid hydrolysis of carbonate samples followed by graphitization of solid targets. For dating very small carbonate samples, an alternative route is to bypass the graphitization step by means of a CO2gas ion source coupled to a carbonate hydrolysis system.
We report tests and developments performed over 3years with a carbonate handling system (CHS) coupled to AixMICADAS. Gas source AMS measurements were performed after different pretreatments applied to various carbonate samples including blanks, reference materials, corals and foraminiferal samples ranging from about 5μg to 100μg of carbon. In parallel, the CHS coupled to the automated graphitization system (AGE3, IonPlus AG) was used to develop a similar leaching procedure for carbonates dated with solid targets. The CHS-AGE3 system can be used efficiently and precisely for samples larger than 300μgC and less precisely down to 100μgC by applying a constant contamination correction.
The gas method was thoroughly investigated in order to characterize its performances and limitations. Based on measuring numerous IAEA-C1 blank samples pretreated with hydrochloric acid, an equivalent age of about 52,000yr BP is routinely achieved, though an even lower background close to 55,000yr BP is reached when the system is flushed to suppress the memory effect from sample to sample. The long-term reproducibility is about 7‰ based on replicated analyses of a modern coral and the accuracy of the gas method was also confirmed by measuring coral and foraminifera samples previously dated by conventional AMS. The background correction is negligible for samples down to 30μgC and can be effectively corrected for samples down to 10μgC by applying a constant contamination correction though the recommended samples size is between 30μgC and 100μgC to achieve a reasonable precision.
Our methods were applied to date planktonic foraminifera from two deep-sea cores. Several species with dif-ferent visual aspects were tested for sample sizes ranging from single shells (ca. 10μgC) to standard size sample (ca. 100μgC) for the gas source as well as larger samples (ca. 500μgC) measured as graphite targets. The dataset does not reveal any large age bias, but illustrates how gas CO2measurements on small foraminiferal samples
could improve the reliability of deep-sea core dating by providing key information on sample heterogeneities due to sediment mixing and diagenesis.
1. Introduction
Radiocarbon analysis of carbonate samples is widely used in pale-oceanographic and paleoclimatic studies. For instance, dating plank-tonic samples is extensively used to establish the chronology of deep-sea sediment cores (e.g. [1]) and14C age differences between paired
ben-thic-planktonic foraminifera in deep-sea cores can be used to reconstruct
surface-deep ocean gradients and provide insight into water mass ven-tilation (e.g. [2–4]). Reservoir ages can also be reconstructed by com-paring planktonic foraminiferal and tephra ages [5–7]. However, this valuable information can only be retrieved from sediment cores where foraminiferal specimens are abundant enough to provide sufficient ma-terial (≈1mg of C) for dating by the conventional method based on the synthesis of graphite targets.
⁎ Corresponding authors.
Email addresses: fagault@cerege.fr (Y. Fagault); bard@cerege.fr (E. Bard)
https://doi.org/10.1016/j.nimb.2018.11.018
Received 22 January 2018; Received in revised form 10 October 2018; Accepted 9 November 2018 Available online xxx
UNCORRECTED
PROOF
Y. Fagault et al. Nuclear Inst. and Methods in Physics Research, B xxx (2018) xxx-xxx
In addition to the sample mass issue,14C dating of large samples
con-taining hundreds to thousands of individual specimens can also mask the intra-sample age heterogeneity caused by sediment mixing resulting from physical and biological processes, notably burrowing organisms. This bioturbation has been shown to lead to dating biases when coupled to abundance changes and dissolution of foraminifera [8–13]. Although progress has been made to reduce by an order of magnitude the car-bon mass required for graphitization [14–16], it is still a labor-intensive technique, and one which is both prone to contamination effects and which has a limited precision.
An alternative route for dating small carbonate samples is to bypass the graphitization step by using a gas ion source coupled to a hydrolysis unit (e.g. [17–21]). In this paper, we report tests and developments per-formed over 3years with the carbonate handling system (CHS, IonPlus AG) coupled to AixMICADAS [22]. More than 1000 AMS measurements were performed with various carbonate samples ranging from ca. 100μg to 5μg of C, compared with conventional AMS analyses when enough material was available. This allowed optimizing an analysis protocol in-cluding online leaching pretreatment.
2. Method
2.1. Pretreatment and sample hydrolysis
The instrumental set-up for both graphitization and gas measure-ments have been described elsewhere [19,22]. In short, carbonate sam-ples are weighed and transferred into a 4.5ml glass vial (Labco Ltd) sealed with a rubber septum and placed in the CHS autosampler. This device is thermostated at 40°C rather than the 70°C traditionally used for stable isotope measurements, in order to prevent leaks which can occasionally occur due to the deformation of the polypropylene caps. Each vial is first flushed with helium at 70ml/min for 3min by means of a doubled-walled needle, then hydrochloric acid (HCl) is added with concentration and volume adjusted to leach 30% of the initial carbon-ate mass. Each vial is then gently manually mixed, let to react gener-ally overnight and the CO2formed during the leaching step is removed
by flushing with helium for 3min at 70ml/min. Residual samples are then hydrolyzed with 0.06ml of phosphoric acid (H3PO4at 85%) and
allowed to react for a minimum of 10min before transferring the first sample of the sequence to the zeolite trap. The released CO2is pushed
with He at 70ml/min through a water trap (phosphorus pentoxide) into the zeolite trap of the gas source interface system (GIS) or of the AGE3 graphitization system (transfers to the zeolite trap last 2 and 1min for the AGE and GIS, respectively).
2.2. Graphitization with the automated system AGE3
The pure CO2is released from the zeolite trap at 420°C into one
of the seven reactors of the AGE3 (Ionplus AG), where it is reduced at 580°C to graphite with hydrogen (PH2/PCO2=2.3) on iron powder
(Alfa Aesar, reduced iron 99%, 325 mesh). The reaction time is set to 150min and the amount of iron is kept constant (3.8–4.2mg) regardless of the carbon mass. The memory effect from one sample to the next is evaluated at ca. 1% with the AGE3 system connected to the carbonate handling system. In order to minimize this problem, the zeolite trap is first loaded with CO2of the same age as the sample (artificial mixture
prepared from modern and blank CO2or a split of the CO2sample to be
measured). This so-called PRE-sample is then heated and vented before loading the trap with the real CO2sample to be graphitized and
mea-sured by AMS.
2.3. Measurements with the gas ion source
The pure CO2is released from the zeolite trap at 450°C and
trans-ferred into the syringe of the GIS where it is mixed with He to obtain a final CO2concentration of 5% in volume which can be injected into
the hybrid ion source of AixMICADAS. The GIS is characterized by a memory effect around 4%, as described in our companion paper (Tuna et al., this issue). The impact of this carry-over can be avoided by load-ing and purgload-ing an aliquot of the CO2sample to be measured (so-called
PRE-sample) and/or by measuring samples in sequence of increasing ages (e.g. following the stratigraphic pile upward).
2.4. AixMicadas parameters and data reporting
The tuning procedure and main operation parameters used in gas and solid configurations are fully described in our companion paper (Tuna et al., this issue [23]). The14C data are reported in terms of
con-ventional14C age BP and in terms of F14C, which is the14C/12C isotope
ratio after normalization and blank correction ([24–26]). The13C/12C
ratios are reported using the conventional δ notation by using OxA2 NIST standard.
14C blank values are reported without any background or constant
contamination while a background correction is applied to standard size samples and an additional correction for the constant contamination is applied to individual foraminifera measurements. Sample masses ex-pressed in this manuscript indicate the residual amount of carbon (μgC) measured from the gas ion source or graphitization system after the pre-treatment procedure.
3. Results and discussion
3.1. Pretreatment
Carbonates such as corals and foraminifera are commonly leached with an acid or oxidant prior to14C measurements in order to remove
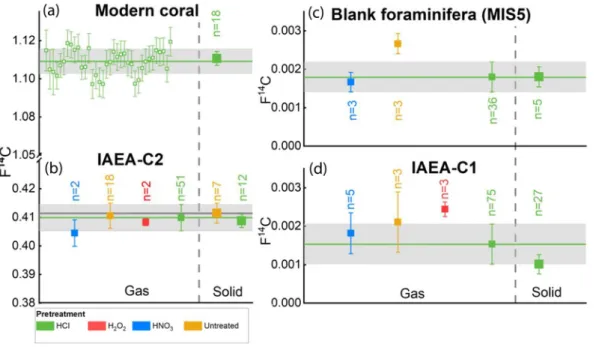
secondary calcite or exogenous carbon introduced during sample collec-tion or handling in the laboratory [27–30]. Fig. 1 summarizes the re-sults obtained with different pretreatment methods applied to blank and modern samples.
The relatively large scatter of untreated IAEA-C1 samples compared to leached samples with either HCl or HNO3suggests that some
conta-mination introduced during sample handling is removed by acid leach-ing. Although the number of untreated samples is limited, this confirms that acid leaching is useful to get reproducible blanks. The offset for the IAEA-C1 sample treated by the H2O2oxidative step suggests that a
car-bonaceous contaminant comes either from the glassware or that it is in-troduced during the sample handling (e.g. grinding step).
Measurements on foraminifera confirm that untreated samples are less reliable than those leached with either HCl or HNO3. The arithmetic
mean of untreated blank foraminiferal samples is F14C=0.0027 with a
standard deviation (SD) of 0.0003 for n=3 samples, which is signifi-cantly higher than for samples treated either with HNO3(F14C=0.0017,
SD=0.0003, n=3) or by HCl (F14C=0.0018, SD=0.0004, n=36).
No clear difference is observed for the pretreatments of the standard IAEA-C2 of intermediate F14C≈0.41. It is probably easier to detect the
cleaning effect on blanks. Overall, the results obtained with HNO3are
similar to those with HCl and we have retained this latter acid for our standard leaching procedure. No conclusions can be dawn at present re-garding the treatment by the oxidative steps with H2O2considering the
small number of measurements. In addition, this pretreatment method is prone to caps pop-up issues resulting from the pressure build-up caused by the oxygen released by the decomposition of H2O2.
UNCORRECTED
PROOF
Fig. 1. F14C values of gas and solid measurements of standard and blank samples with standard size (residual mass after leaching of ≈100µgC and ≈500–1000µgC for gas and solid
measurements respectively). (a) Modern coral (Porites from Moorea, Aix-13027), (b) IAEA-C2 reference material, (c) foraminiferal samples picked from a >100kyr sediment layer (marine isotopic stage 5 from a sediment core raised off Morocco) and (d) IAEA-C1 reference material. Data summarized in this figure were measured over a period of two years.The colors stand for the different pretreatments applied before the final hydrolysis with H3PO4(HCl is used routinely, while HNO3and H2O2have also been tested). Empty green symbols show individual
gas measurements pretreated with HCl, while solid symbols represent the arithmetic mean with the associated standard deviation for both gas (left) and solid (right) measurements. The horizontal light grey bar indicates the arithmetic mean and associated standard deviation of gas samples leached with HCl, while the darker grey bar (panel b) indicates the consensus value and associated error for the reference material IAEA-C2. The results for the modern coral and IAEA-C2 were corrected for a blank value based on IAEA-C1 samples measured in the same magazine. By contrast, the results for IAEA-C1 and blank foraminifera are reported as raw F14C without background correction. (For interpretation of the references to colour in this
figure legend, the reader is referred to the web version of this article.) 3.2. Background contamination for small samples
The quantification of the background contamination for both gas and solid measurements is based on the assumption that samples are mixed with a contaminant of constant mass (Mc) and activity (F14Cc)
[e.g. [31–33]]. A modern sample (Porites coral from Moorea) and a blank (IAEA-C1 calcite) of various masses were measured with the hy-brid ion source as CO2gas produced with the CHS and as solid graphite
targets prepared with the AGE3. A weighted least squares regression was applied to the results to fit the data (Fig. 2) and determine the con-stant contaminant parameters (Mcand F14Cc).
Fig. 2. Constant contamination model for (a) gas measurements and (b) solid measurements. Green and blue symbols show F14C values with their associated uncertainty (1σ) for the blank
sample (IAEA-C1) and modern sample (Porites coral from Moorea), respectively. The red dashed zones indicate the size-ranges of samples that cannot be accurately measured and the red zones designate the size-ranges where samples can be efficiently corrected for the constant contamination. Nevertheless, the precision is markedly impacted due to low ion currents. The white zones represent the recommended carbon mass ranges for optimal precision and accuracy. (For interpretation of the references to colour in this figure legend, the reader is referred to the web version of this article.)
UNCORRECTED
PROOF
Y. Fagault et al. Nuclear Inst. and Methods in Physics Research, B xxx (2018) xxx-xxx
For carbonates with the gas source, the estimated parameters are Mc=0.18±0.04μgC (2σ) and F14Cc=0.14±0.04 (2σ). It should be
noted that the data are very well fitted down to a carbon mass of 10μg for both modern and blank samples. In addition to the higher influ-ence of the target contamination [34] for samples <10μgC compared to larger ones, the lower precision and the larger uncertainty for small carbon mass probably explain the scatter for these ultra-small samples. Nonetheless, it is reassuring to see that the background correction is negligible for samples down to 30μgC. This sample mass also allows the full consumption of a Ti target leading to a reasonable precision equiva-lent to that for standard size ≈100μgC samples (see our companion pa-per by Tuna et al. in this issue).
For solid graphite targets, the estimated parameters are Mc=1.74±0.84µgC (2σ) and F14Cc=0.14±0.06 (2σ). This F14Ccis
similar to the CHS-GIS determination and also agree with the recent value determined for the EA-GIS based on the combustion of ultra-small silver cups (see our companion paper by Tuna et al. in this issue).
The F14C
cof the contaminant with the CHS-GIS is thus lower than
the one we found (F14C
c=0.73±0.11 and Mc=1.45±0.26μgC) by
using the EA-GIS with relatively large silver cups [33] as well as lower than other EA-GIS estimates [31,32]. Higher F14C
chave also been
re-ported in a recent paper [21] focusing on gas (F14C
c=0.30±0.04
and Mc=0.68±0.10μgC) and solid (F14Cc=0.49±0.07 and
Mc=0.94±0.14μgC) measurements of carbonates with a MICADAS.
One possible interpretation is that the contaminating material, assumed as homogenous in the carbon contamination model, is in fact heteroge-nous and that the F14C
cof the residual fraction around 0.2μgC has a
different F14C
cthan the carbon mix forming higher contamination
lev-els around 1μgC. Validation of this hypothesis will necessitate further work.
As seen in Fig. 2, the data are well fitted down to a carbon mass around 100μgC. Although solid samples can be corrected for, it is preferable to graphitize samples larger than 300μgC for which the back-ground correction is negligible. In addition, the12C−currents are not
optimal and stable for sample masses between 100 and 300μgC (corre-sponding to ∼20% and ∼70% of the typical ion current measured for a 1mgC sample, respectively). This problem can be reduced by decreasing the amount of Fe catalyst used to produce graphite targets with these small samples.
3.3. Procedural blanks on representative material
Based on 75 measurements of ≈100μgC aliquots of the reference ma-terial IAEA-C1 leached online with HCl, the blank level of the CHS is cal-culated to be a mean F14C=0.0015, SD=0.0005 (Fig. 1d and Table 2).
This average F14C corresponds to a14C age of around 52,000yr BP. This
mean F14C value is quite low for a gas source and should be regarded as
a conservative estimate because these analyses were mainly performed to purge the CHS before analyzing unknown samples. For instance, an even lower mean value of F14C=0.0011 (≈55,050yr BP), SD=0.0003
was obtained from 13 consecutive IAEA-C1 measurements.
Our background is slightly lower than those previously reported [19,21], although a comparison with other MICADAS system is not straightforward due to sample size effects, different pretreatment pro-cedures and improved stripping with He for AixMICADAS compared to the previous system with N2.
As shown in Fig. 1, the procedural blank obtained from gas measure-ments (≈90μgC) of old (>100kyr BP) foraminifera leached with HCl is an average F14C=0.0018 (≈50,770yr BP), SD=0.0004, n=36
(av-erage sample mass: 89μgC, SD=12μgC). The planktonic foraminifera were hand-picked under the binocular microscope from a sediment layer corresponding to marine isotopic stage 5 in a sediment core off Morocco. Although IAEA-C1 and foraminiferal blanks values
are both quite low, a small difference of 0.0003±0.0001 can be calcu-lated with foraminiferal blanks consistently higher than IAEA-C1 values. The same pattern is observed for solid graphite targets of refer-ence materials and foraminiferal samples. Average F14C=0.0010
(≈55,300yr BP), SD=0.0002, n=27 (average sample mass: 900μgC, SD=190μgC), and 0.0011 (≈54,810yr BP), SD=0.0001, n=2 (aver-age sample mass: 980μgC, SD=10μgC), were measured on IAEA-C1 and SIRI-K samples (sample K, Sixth radiocarbon laboratory intercom-parison, 2013), respectively. These blank levels are lower than those measured on old foraminifera samples from the same core as above with a mean F14C=0.0018 (≈50,980yr BP), SD=0.0003, n=5
(av-erage sample mass: 660μgC, SD=180μgC). This offset could indicate that a fraction of the surface or intrinsic contamination of these old foraminifera is not completely removed by the leaching procedure.
This agrees with previous observations [35], justifying the measure-ment of blank levels in samples representative of the same archive (e.g. old foraminifera found in deeper layers of the same deep-sea core). For example, we have re-measured mono-specimen blanks of three foraminifera species from the deeper layers of core MD04-2873 from the Pakistan Margin, which gave a mean F14C=0.0018 (≈50,600yr
BP), SD=0.0003, n=3 (Orbulina, G.sacculifer and G.ruber, average sample mass: 570μgC, SD=220μgC) with solid graphite targets and a mean F14C=0.0019 (≈50,170yr BP), SD=0.0005, n=11 (Orbulina
and G.ruber, average sample mass : 82μgC, SD=7μgC) for gas measure-ments. Both values agree with our previous estimation by conventional AMS [36]. Nevertheless, more work is still needed on sediment cores from different locations and depths in order to characterize the source of the residual contamination in foraminifera.
3.4. Precision and accuracy
The accuracy of the gas method was tested by re-measuring two coral samples previously dated by conventional AMS (Table 1). These well-preserved samples collected offshore Tahiti were used in the frame of the IntCal calibration curve [30]. Both sets of gas replicates measured on ≈100μgC aliquots are in good agreement for the two corals and the results between the two methods are fully compatible.
More systematic work was performed with gas and solid measure-ments of a modern coral (MOO, a Porites from Moorea) and the IAEA-Table 1
Coral samples from IODP #310 cores offshore Tahiti [28]. Gas measurements are
com-pared with14C measurements by conventional AMS (French ARTEMIS facility).
Sam-ples were corrected with the mean of three IAEA-C1 obtained during the measurement
(F14C=0.0019) and a conservative error of ±30% of this value, based on the long-term
variability of IAEA-C1 standard size blanks.
Sample Gas samples Conventional method
Aix n° 14C Age yr BP±1σ Artemis n° 14C Age yr BP±2σ 310-M0023B-12R-2W 113-127 Aix-10510.1.1 12720±130 SacA-8601 12810±50 Aix-10511.1.1 12840±130 SacA-10227 12790±50 Weighted mean 12780±80 310-M0024A-10R-1W 98-116 Aix-10519.1.1 12790±120 SacA-18555 12920±70 Aix-10520.1.1 12810±120 Weighted mean 12800±80 4
UNCORRECTED
PROOF
C2 standard. The results are summarized and compared in Fig. 1 (panels a & b) and Table 2.
The precision for gas and solid measurements can be evaluated from the modern coral. A total of 36 gas samples (over 13 different day-sessions) and 18 solid samples (over 5 different day-sessions) have been measured over a period of two years. Both averages are close to each other, within 2‰. As expected, the scatter of the solid measure-ments (SD≈4‰) is smaller than that observed for gas measuremeasure-ments (SD≈7‰).
A total of 73 IAEA-C2 gas samples (51 leached with HCl, 2 leached with HNO3, 2 oxidized with H2O2and 18 untreated) have been
mea-sured with the gas ion source over a period of 2years (over 19 different day-sessions). The data show reproducible results with standard devia-tions on the order of 10‰ and 11‰ of the mean value (leached with HCl and untreated samples, respectively) for this 7kyr-old sample. This value is in the same order of magnitude than recently reported by the University of Bern (12‰ and 10‰ for leached and untreated samples, respectively) [21]. As expected, the scatter for solid measurements is lower than gas measurements, though leached samples seem to be more reproducible (SD≈6‰ of the mean value, n=12) than untreated sam-ples (SD≈8‰ of the mean value, n=7).
Leached and untreated samples mean values for both solid and gas samples are consistent within one standard deviation with the consensus value (0.4114). However, looking at face values, it seems that untreated samples lead to F14C values higher on average than leached samples
(6‰ and 2‰ for solid and gas, respectively). Although the observed dif-ferences are small, they could be linked to a residual contamination of the IAEA-C2 material introduced during the sample handling, as already hypothesized for untreated blanks (see Section 3.1). The fact that simi-lar offsets are observed for solid and gas measurements would exclude a specific effect linked to the gas source.
The mean δ13C value of solid IAEA-C2 samples (−8.0‰, SD=1.9‰
and −9.1‰, SD=0.9‰ for leached and untreated samples, respec-tively) and IAEA-C1 samples (3.5‰, SD=2.2‰) are compatible within one sigma uncertainty with the consensus value (−8.25±0.31‰ and 2.42±0.33‰ for IAEA-C2 and IAEA-C1, respectively) [35,36]. Gas samples are more reproducible (SD≈1‰) than solid samples but the mean values are systematically shifted toward negative values when compared to solid samples (about −2‰ and −3.5‰ for IAEA-C1 and IAEA-C2 samples, respectively, and −4‰ for the modern coral). Simi-larly, the δ13C values measured for the different blank samples through
the EA+GIS, exhibit also a negative shift of around −2‰ when com-pared to precise and accurate results on solid graphite targets (see our companion paper by Tuna et al. in this issue). By contrast OxA2 sam-ples considered as unknown measured directly from the CO2standard
bottles lead to a mean δ13C of 18.0‰ with an SD of 1.8‰ (n=132) in
agreement with the provided IRMS value (−17.2‰).
The observed δ13C offset is probably due to isotopic fractionation
linked to the zeolite trap system of the GIS which are not corrected with our normalization procedure based on the measurement of OxA2
samples from a CO2bottle. It must be stressed that with the gas ion
source, the fate of the CO2gas is quite different between the OxA2
stan-dard (bottle-CO2injected directly into the GIS syringe) and the
sam-ples (CO2production with the CHS, drying, adsorption in and
desorp-tion from the zeolite trap, mixing of CO2with He in the GIS syringe).
Normalization with IAEA-C2 carbonate samples has been tested oc-casionally in order to use the very same procedure for standard and unknown samples. This procedure seems to be efficient to produce less negative δ13C values in better agreement with consensus values for
IAEA-C1 and IAEA-C2 samples. However, because of14C counting
sta-tistics, it would be better to normalize the data with a modern carbon-ate standard rather than with IAEA-C2 (F14C≈0.4). Unfortunately, such
a modern carbonate standard is currently not available. This issue was also raised by Gottschalk et al [21]. In our companion paper by Tuna et al., we propose to use OxA2 samples introduced with the EA in order to normalize data of samples measured through the EA, instead of normal-izing with measurements from the OxA2 bottle, which bypass the zeo-lite trap. Further work will be pursued to develop a similar procedure for carbonates.
In any case, the normalization procedure used so far does not affect
14C/12C ratios as natural and procedural isotopic fractionations are
cor-rected for in the F14C normalization procedure with measured13C/12C
ratios.
3.5. Demonstration of the method on foraminiferal samples 3.5.1. Single foraminifera measurements
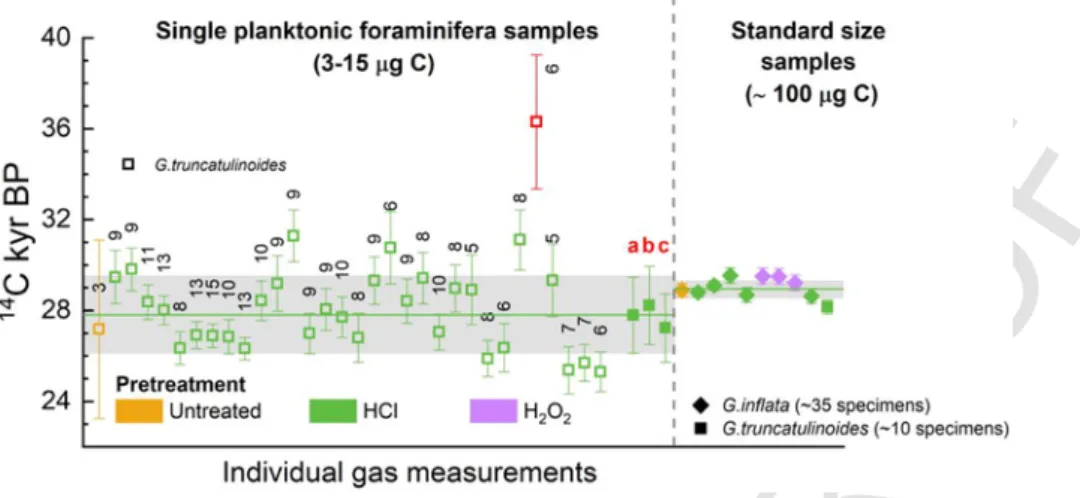
In order to test the gas method on small carbonate samples and to study sediment mixing, we have started a measurement program on individual specimens of foraminifera. Fig. 3 shows the individual measurements of 32 single foraminiferal shells (G.truncatulinoides with masses ranging between 3 and 15μg C) compared with standard size (≈100μgC) multi-specimen samples of two species (G. truncatulinoides and G. inflata). All samples were sieved and picked under the binocular from the same depth in a sediment core raised off Morocco. A parallel objective of the study was the detection of the contamination by rare modern shells (only two) artificially mixed with the old ones represen-tative of the core depth (see Skinner et al. 2010 [37] also reporting a contamination problem).
Overall, the 30 single foraminifera leached with HCl lead to an av-erage14C age of 27,790yr BP with a standard deviation of 1680yr
(rep-resented on Fig. 3 as the green solid square method a). This is larger than the average uncertainty of individual measurements (970yr). Bio-turbation may have contributed to the age heterogeneity. Indeed, this particular deep-sea core has an average sedimentation rate of 14cm/ kyr, which implies that foraminifera over a millennium are mixed in the bioturbation zone (typically on the order of 10cm).
In addition, the constant contamination model is not ideal for sam-ples smaller than 10μgC, which also contributed to this large scatter. This non-ideal contamination correction could also be responsible for Table 2
F14C and δ13C values obtained with AixMICADAS for gas and solid measurements of the reference materials IAEA-C1 and IAEA-C2, and the modern coral (MOO, Porites sample from
Moorea). The F14C and δ13C consensus values are 0.4114±0.0003 and −8.25±0.31‰ respectively [39,40].
Sample description F14C Standard deviation F14C Standard error ( δ13C (% VPDB) Standard deviation δ13C N analyses
Gas, leached, IAEA-C2 0.4098 0.0042 0.0006 −10.4 1.1 51
Gas, untreated, IAEA-C2 0.4106 0.0044 0.0010 −10.5 0.9 18
Solid, leached, IAEA-C2 0.4088 0.0023 0.0007 −8.0 1.9 12
Solid, untreated, IAEA-C2 0.4114 0.0035 0.0013 −9.1 0.9 7
Gas, leached, modern coral 1.1114 0.0078 0.0013 −3.7 1.3 36
Solid, leached, modern coral 1.1133 0.0046 0.0010 0.2 2.0 19
Gas, leached, IAEA-C1 0.0015 0.0005 0.0001 0.0 1.0 75
UNCORRECTED
PROOF
Y. Fagault et al. Nuclear Inst. and Methods in Physics Research, B xxx (2018) xxx-xxx
Fig. 3. F14C values corrected for the constant contamination model of 32 single foraminifera samples (the sample represented in red was considered as an outlier) compared to 10 standard
size samples from the same depth in deep-sea core raised off Morocco. Numbers above data points indicate the sample weight in µgC (the mean is 8.3μg). Letters in red stand for the mean and standard deviation of the 30 single samples leached with HCl (a) corrected for the constant contamination correction, (b) an alternative correction based on two blank foraminifera of similar size (7 and 10µgC) and, for the sake of comparison, (c) the simple correction based only on standard size blanks. Conservative blank errors are propagated to calculate errors bars: ± 40% for blank single foraminifera and ±25% for standard size samples (based on numerous measurements of MIS-5 foraminiferal samples from this particular core). The horizontal grey bars show the mean and standard deviation for both single and standard size foraminiferal samples pretreated with HCl. (For interpretation of the references to colour in this figure legend, the reader is referred to the web version of this article.)
the residual offset observed between the mean result on single foraminifera (27,790yr BP, SD=1,680yr, n=30) and the mean on standard size (≈100μgC) foraminifera samples (28,150±305yr BP for G. truncatulinoides and 28,950yr BP, SD=380yr, n=5, for G. inflata).
An alternative correction with blanks of the same size as the sin-gle foraminifera samples, measured during the same sessions, lead to a mean14C age of 28,220yr BP, SD=1710yr, (Fig. 3, method b) similar
to the value calculated with the constant contamination model on single foraminifera and in full agreement with the standard size gas samples. For comparison, the raw data without contamination correction (Fig. 3, method c) give a younger14C age (27,230yr BP, SD=1500yr).
The gas measurements of standard size samples of foraminifera were also used to test the different chemical pretreatment methods (no treat-ment, HCl, H2O2), but no significant difference was detected with these
individual measurements (Fig. 3).
Although this dataset is limited to a specific sediment layer from a single deep-sea core, the data already highlight the advantage of the gas ion source compared to conventional AMS. Indeed, it would have been impossible to study the heterogeneity of this sediment without gas mea-surement on small CO2aliquots (see also [13] for further
demonstra-tion). More work is ongoing to compare results of different foraminifera species and size fractions in cores from various locations and depths. 3.5.2. Age models of deep-sea sediments
Constructing an age-depth model requires the dating of numerous discrete core depth intervals. Although valuable age-depth models are routinely based on conventional AMS dating (with ≈1mgC samples) this technique suffers from three main drawbacks. First, it is only applicable when enough foraminifera shells are available, thereby restricting stud-ied locations in the global ocean. Second, many complications such as mixing of the upper sediment layer by burrowing organisms may disturb recorded signals and lead to erroneous interpretation. Third, the diage-nesis is often poorly constrained, which may also lead to incorrect age with large samples [9,38].
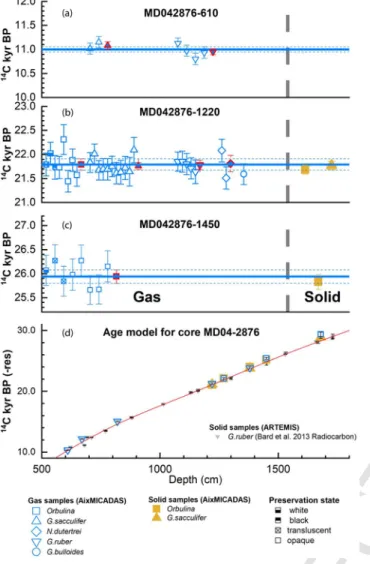
As a first test, we analyzed small and large samples from a deep-sea core from the Pakistan Margin in the Arabian Sea (MD04-2876), which is characterized by a high sediment rate (∼50cm/kyr, Bard et al., 2013). The data are shown in Fig. 4, with panels 4a, 4b and 4c show
ing the details for three particular core depths illustrating how gas mea-surements on small samples can be used to improve our understanding of sediment mixing and diagenesis.
Several planktonic foraminifera species (G. ruber, G. sacculifer, N. dutertrei, G. bulloides and Orbulina) were picked under the binocular to provide suitable samples for optimal gas source measurements (≈100μgC representing between 10 and 35 specimens depending on the species). We also distinguished the shells by their visual aspect under the binocular (white, black, opaque, translucent), which may reflect dif-ferent preservation states or contamination levels by extraneous mater-ial. Indeed, the carbonate fraction calculated from the CO2pressure in
the GIS varies significantly between 25 and 95% of the raw material introduced in the CHS vials. Translucent foraminifera are often consid-ered as particularly well preserved but in this core they may be linked to dissolution as they contain less calcite (69%, SD=5% n=4) than opaque or white specimens (80%, SD=7%, n=56 and 82%, SD=7%, n=4 respectively). Black shells probably contain some pyrite formed in anoxic conditions as the core is located with the Oxygen Minimum Zone. As expected, the calcite content was even lower for these samples (47%, SD=25%, n=3).
As can be seen in Fig. 4 (panels a, b and c), the dataset does not reveal any clear age bias between the different species of foraminifera, nor their different aspects. For each of the three depths, the individual gas measurements for one particular species are compatible according to the chi-square test (p=0.05) and the different species are also in good agreement within one sigma uncertainty of their weighted means. When shell abundance was sufficient, graphite targets were also produced and measured for much larger samples (≈350 to 550μgC). The available solid data (yellow symbols in Fig. 4) confirm the agreement between species and are compatible within one sigma uncertainty with the gas measurements (n=5). The weighted averages based on the various gas replicates (red symbols in Fig. 4 (panels a, b and c)) show that the final weighted error is similar to typical errors for solid measurements (e.g. 25,940±140yr BP and 25,830±140yr BP, for gas and solid measure-ments of Orbulina from 1450cm core depth).
The absence of strong discrepancies may seem surprising in the light of the abundant literature on the subject (e.g. [9,13,38]). This may be due to the very high sedimentation rate (50cm/kyr) and limited bio-turbation in these sections of the studied core from the Arabian Sea OMZ. In any case, this preliminary dataset is reassuring concerning 6
UNCORRECTED
PROOF
Fig. 4. Measurements of solid and gas planktonic foraminiferal samples in coreMD04-2876 from the Pakistan Margin. (a)(b)(c) comparison between14C ages of
sam-ples made from different planktonic foraminifera species with different visual aspects (for
Orbulina). Solid and dashed lines (in blue) show the weighted mean and weighted error
based on the gas measurements of opaque individuals (only 5 Orbulina samples for 1220 & 1450cm depths and 6 G.ruber & G.sacculifer samples for 610cm depth). Symbols with a red outline show the weighted mean and associated weighted error based on individ-ual measurements (opaque specimens only) of the same species. (d) new measurements of small planktonic samples compared to the age-depth model based on large samples by conventional AMS (Bard et al. 2013). Gas sample symbols in blue show the weighted mean and associated error based on three gas measurements. New solid samples measured with AixMICADAS were prepared with masses ranging between 350 and 550μgC. (For interpre-tation of the references to colour in this figure legend, the reader is referred to the web version of this article.)
the efficiency of our pretreatment and the reproducibility of the dating protocol.
Fig. 4d provides the age-depth profile for the new14C ages measured
on planktonic foraminifera with AixMICADAS (both gas and solid mea-surements). It is compared with the previous age model based on con-ventional AMS measured at the French ARTEMIS facility [36]. Gas mea-surements correspond to the weighted mean and associated error from 3 gas measurements. Although more were available for some depths, 3 gas measurements are enough to reach a weighted error comparable to uncertainties of solid graphite analyses.
In general, the new14C ages are compatible with the previous ones,
except for the 1680cm core depth for which the new results for gas (29360±340yr BP) and solid (28880±210yr BP) are about 1000yr and 540yr older than the former age. However, this offset is not much larger than typical error bars in that time range. In addition, the avail
able new measurements were performed on different foraminifera species (G. sacculifer and Orbulina) than the previous ones (G. ruber). More data will be produced on this particular level to check the reality, size and source of this apparent offset.
4. Conclusion
We pursued technical developments with a carbonate handling sys-tem (CHS) coupled to both the gas ion source of AixMICADAS and the automated graphitization system (AGE3) producing solid AMS targets. After testing chemical pretreatments, our preferred method is based on leaching 30% of the sample with HCl, followed by complete hydrolysis of the residual carbonate with phosphoric acid.
For the CHS coupled to the gas source, the average blank on the IAEA-C1 calcite standard corresponds to a F14C=0.0015, SD=0.0005,
n=75. This mean value is equivalent to a14C age of around 52,000yr
BP. An even lower background age of ca. 55,000yr BP, can be achieved by flushing the CHS to further minimize the sample-to-sample memory. The procedural blank obtained from gas measurements for foraminifera based on analyzing old (>100kyr BP) foraminifera in two deep-sea sediment cores is determined to be an average of F14C=0.0018, SD=0.0005, n=47. Foraminiferal blanks are thus
slightly, but consistently, higher than IAEA-C1 values. A similar residual difference is observed for solid graphite targets. These observations il-lustrate the need to measure realistic blanks in order to correct14C
mea-surements in a particular sediment core.
The long-term reproducibility of the gas method is about 7‰ based on replicated analyses of a modern coral and the accuracy was con-firmed by dating coral and foraminifera samples previously dated by conventional AMS.
Although the gas source handles samples between ca. 5μg to 100μgC, it is better to measure samples larger than 30μgC to optimize precision and reduce the impact of the blank correction uncertainty. Nevertheless, our detailed study of the contamination showed that a cor-rection may be applied for samples down to 10μgC by assuming a con-stant contaminant.
Our methods were applied to date planktonic foraminifera from two deep-sea cores. The dataset does not reveal any large age bias between species nor visual aspects of the foraminifera. Measurements on single foraminifera specimens are used to assess the scatter linked to sediment mixing and/or alteration. Although this preliminary study is promis-ing, we plan further tests on foraminifera samples from other sediment cores characterized by different sedimentation rates and dissolution con-ditions.
Uncited reference Acknowledgements
AixMICADAS was acquired and is operated in the framework of the EQUIPEX project ASTER-CEREGE with additional matching funds from the Collège de France and the ANR project CARBOTRYDH. We thank Magali Ermini for technical help.
References
[1] E. Bard, M. Arnold, P. Maurice, J. Duprat, J. Moyes, J.-C. Duplessy, Retreat veloc-ity of the North Atlantic polar front during the last deglaciation determined by14C
accelerator mass spectrometry, Nature 328 (1987) 791.
[2] W. Broecker, A. Mix, M. Andree, Hans Oeschger, Radiocarbon measurements on coexisting benthic and planktic foraminifera shells: potential for reconstructing ocean ventilation times over the past 20 000 years, Nucl. Instrum. Methods B 5 (1984) 331–339, https://doi.org/10.1016/0168-583X(84)90538-X.
[3] L.D. Keigwin, Radiocarbon and stable isotope constraints on Last Glacial Maximum and Younger Dryas ventilation in the western North Atlantic, Paleoceanography 19 (2004) PA4012, https://doi.org/10.1029/2004PA001029.
UNCORRECTED
PROOF
Y. Fagault et al. Nuclear Inst. and Methods in Physics Research, B xxx (2018) xxx-xxx
[4] T.M. Marchitto, S.J. Lehman, J.D. Ortiz, J. Flückiger, A. van Geen, Marine radio-carbon evidence for the mechanism of deglacial atmospheric CO2Rise, Science
(2007) https://doi.org/10.1126/science.1138679.
[5] E. Bard, M. Arnold, J. Mangerud, M. Paterne, L. Labeyrie, J. Duprat, M.-A. Mélières, E. Sønstegaard, J.-C. Duplessy, The North Atlantic atmosphere-sea sur-face14C gradient during the Younger Dryas climatic event, Earth Planet. Sci. Lett.
126 (1994) 275–287, https://doi.org/10.1016/0012-821X(94)90112-0. [6] E.L. Sikes, C.R. Samson, T.P. Guilderson, W.R. Howard, Old radiocarbon ages in
the southwest Pacific Ocean during the last glacial period and deglaciation, Nature 405 (2000) 555.
[7] D.J.R. Thornalley, I.N. McCave, H. Elderfield, Tephra in deglacial ocean sediments south of Iceland: Stratigraphy, geochemistry and oceanic reservoir ages, J. Quater-nary Sci. 26 (2011) 190–198, https://doi.org/10.1002/jqs.1442.
[8] E. Bard, M. Arnold, J. Duprat, J. Moyes, J.-C. Duplessy, Reconstruction of the last deglaciation: deconvolved records of δ18O profiles, micropaleontological variations
and accelerator mass spectrometric14C dating, Clim. Dyn. 1 (1987) 101–112,
https://doi.org/10.1007/BF01054479.
[9] W. Broecker, S. Barker, E. Clark, I. Hajdas, G. Bonani, Anomalous radiocarbon ages for foraminifera shells, Paleoceanography 21 (2006) PA2008, https://doi.org/10. 1029/2005PA001212.
[10] S. Barker, W. Broecker, E. Clark, I. Hajdas, Radiocarbon age offsets of foraminifera resulting from differential dissolution and fragmentation within the sedimentary bioturbated zone, Paleoceanography 22 (2007) PA2205, https://doi.org/10.1029/ 2006PA001354.
[11] L. Löwemark, K.I. Konstantinou, S. Steinke, Bias in foraminiferal multispecies re-constructions of paleohydrographic conditions caused by foraminiferal abundance variations and bioturbational mixing: a model approach, Mar. Geol. 256 (2008) 101–106, https://doi.org/10.1016/j.margeo.2008.10.005.
[12] L.D. Keigwin, T.P. Guilderson, Bioturbation artifacts in zero-age sediments, Paleo-ceanography 24 (2009) PA4212, https://doi.org/10.1029/2008PA001727. [13] B.C. Lougheed, B. Metcalfe, U.S. Ninnemann, L. Wacker, Moving beyond the
age–depth model paradigm in deep-sea palaeoclimate archives: dual radiocarbon and stable isotope analysis on single foraminifera, Clim. Past 14 (2018) 515–526, https://doi.org/10.5194/cp-14-515-2018.
[14] G. Santos, J. Southon, S. Griffin, S. Beaupre, E. Druffel, Ultra small-mass AMS14C
sample preparation and analyses at KCCAMS/UCI Facility, Nucl. Instrum. Methods B. 259 (2007) 293–302, https://doi.org/10.1016/j.nimb.2007.01.172.
[15] S. Shah Walter, A. Gagnon, M. Roberts, A. McNichol, M. Lardie Gaylord, E. Klein, Ultra-small graphitization reactors for ultra-microscale14C analysis at the National
Ocean Sciences Accelerator Mass Spectrometry (NOSAMS) facility, Radiocarbon. 57 (2015) 109–122, https://doi.org/10.2458/azu_rc.57.18118.
[16] E. Freeman, L.C. Skinner, R. Reimer, A. Scrivner, S. Fallon, Graphitization of small carbonate samples for paleoceanographic research at the Godwin Radiocarbon Laboratory, University of Cambridge, Radiocarbon 58 (2016) 89, https://doi.org/ 10.1017/RDC.2015.8.
[17] C.P. McIntyre, M.L. Roberts, J.R. Burton, A.P. McNichol, A. Burke, L.F. Robinson, K.F. von Reden, W.J. Jenkins, Rapid radiocarbon (14 C) analysis of coral and car-bonate samples using a continuous-flow accelerator mass spectrometry (CFAMS) system, Paleoceanography 26 (2011) https://doi.org/10.1029/2011PA002174. [18] L. Wacker, S.M. Fahrni, I. Hajdas, M. Molnar, H.-A. Synal, S. Szidat, Y.L. Zhang, A
versatile gas interface for routine radiocarbon analysis with a gas ion source, Nucl. Instrum. Methods B. 294 (2013) 315–319, https://doi.org/10.1016/j.nimb.2012. 02.009.
[19] L. Wacker, J. Lippold, M. Molnár, H. Schulz, Towards radiocarbon dating of single foraminifera with a gas ion source, Nucl. Instrum. Methods B. 294 (2013) 307–310, https://doi.org/10.1016/j.nimb.2012.08.038.
[20] M. Roberts, A. High-Throughput, Low-cost method for analysis of carbonate sam-ples for14C, Radiocarbon 55 (2013) 585–592, https://doi.org/10.2458/azu_js_rc.
55.16190.
[21] J. Gottschalk, S. Szidat, E. Michel, A. Mazaud, G. Salazar, M. Battaglia, J. Lippold, S.L. Jaccard, Radiocarbon measurements of small-size foraminiferal samples with the mini carbon dating system (MICADAS) at the University of Bern: implications for paleoclimate reconstructions, Radiocarbon 60 (2018) 469–491, https://doi. org/10.1017/RDC.2018.3.
[22] E. Bard, T. Tuna, Y. Fagault, L. Bonvalot, L. Wacker, S. Fahrni, H.-A. Synal, AixMI-CADAS, the accelerator mass spectrometer dedicated to14C recently installed in
Aix-en-Provence, France, Nucl. Instrum. Methods B. 361 (2015) 80–86, https:// doi.org/10.1016/j.nimb.2015.01.075.
[23] T. Tuna, Y. Fagault, L. Bonvalot, M. Capano, E. Bard, Development of small CO2
gas measurements with AixMICADAS, Nucl. Instrum. Methods Phys. Res., Sect. B (2018) https://doi.org/10.1016/j.nimb.2018.09.012.
[24] M. Stuiver, H.A. Polach, Discussion reporting of14C data, Radiocarbon 19 (1977)
355–363.
[25] J. Vanderplicht, A. Hogg, A note on reporting radiocarbon, Quat. Geochronol. 1 (2006) 237–240, https://doi.org/10.1016/j.quageo.2006.07.001. [26] P.J. Reimer, T.A. Brown, R.W. Reimer, Discussion: reporting and calibration of
post-bomb14C data, Radiocarbon 46 (2004) 1299–1304, https://doi.org/10.1017/
S0033822200033154.
[27] E. Bard, B. Hamelin, R.G. Fairbanks, A. Zindler, G. Mathieu, M. Arnold, U/Th and
14C ages of corals from Barbados and their use for calibrating the14C time scale
be-yond 9000 years B.P., Nucl. Instrum. Methods B 52 (1990) 461–468, https://doi. org/10.1016/0168-583X(90)90458-7.
[28] G.S. Burr, R.L. Edwards, D.J. Donahue, E.R.M. Druffel, F.W. Taylor, Mass
spectro-metric14C and U-Th measurements in coral, Radiocarbon 34 (1992) 611–618,
https://doi.org/10.1017/S003382220006389X.
[29] Y. Yokoyama, K. Lambeck, P. De Deckker, P. Johnston, L.K. Fifield, Timing of the Last Glacial Maximum from observed sea-level minima, Nature 406 (2000) 713.
[30] N. Durand, Comparison of14C and U-Th ages in corals from IODP #310 Cores
off-shore Tahiti, Radiocarbon 55 (2013) 1947–1974, https://doi.org/10.2458/azu_js_ rc.v55i2.16134.
[31] M. Ruff, S. Fahrni, H.W. Gaggeler, I. Hajdas, M. Suter, H.-A. Synal, S. Szidat, L. Wacker, On-line radiocarbon measurements of small samples using elemental ana-lyzer and MICADAS gas ion source, Radiocarbon 52 (2010) 1645–1656. [32] G. Salazar, Y.L. Zhang, K. Agrios, S. Szidat, Development of a method for fast and
automatic radiocarbon measurement of aerosol samples by online coupling of an elemental analyzer with a MICADAS AMS, Nucl. Instrum. Methods B. (2015) https: //doi.org/10.1016/j.nimb.2015.03.051.
[33] L. Bonvalot, T. Tuna, Y. Fagault, J.-L. Jaffrezo, V. Jacob, F. Chevrier, E. Bard, Esti-mating contributions from biomass burning, fossil fuel combustion, and biogenic carbon to carbonaceous aerosols in the Valley of Chamonix: a dual approach based on radiocarbon and levoglucosan, Atmos. Chem. Phys. 16 (2016) 13753–13772, https://doi.org/10.5194/acp-16-13753-2016.
[34] S.M. Fahrni, L. Wacker, H.-A. Synal, S. Szidat, Improving a gas ion source for 14C AMS, Nucl. Instrum. Methods B. 294 (2013) 320–327, https://doi.org/10.1016/j. nimb.2012.03.037.
[35] M. Schleicher, P.M. Grootes, M.-J. Nadeau, A. Schoon, The carbonate14C
back-ground and its components at the Leibniz AMS facility, Radiocarbon 40 (1997) 85–93, https://doi.org/10.1017/S0033822200017926.
[36] E. Bard, G. Ménot, F. Rostek, L. Licari, P. Böning, R.L. Edwards, H. Cheng, Y. Wang, T.J. Heaton, Radiocarbon calibration/comparison records based on marine sediments from the Pakistan and Iberian margins, Radiocarbon 55 (2013) 1999–2019.
[37] L.C. Skinner, S. Fallon, C. Waelbroeck, E. Michel, S. Barker, Ventilation of the deep
southern ocean and deglacial CO2Rise, Science 328 (2010) 1147–1151, https://
doi.org/10.1126/science.1183627.
[38] J. Wycech, D.C. Kelly, S. Marcott, Effects of seafloor diagenesis on planktic foraminiferal radiocarbon ages, Geology 44 (2016) 551–554, https://doi.org/10. 1130/G37864.1.
[39] K. Rozanski, In: Consultants’ group meeting on 14C reference materials for radio-carbon laboratories. February 18-20, 1991, Internal Report, IAEA, Vienna, Vienna, Austria, 1991, p. 1991.
[40] K. Rozanski, W. Stichler, R. Gonfiantini, E.M. Scott, R. Beukens, B. Kromer, J. Van
der Plicht, The IAEA14C Intercomparison exercise 1990, Radiocarbon 34 (1992)
506–519.
[41] S. Shah, A. Pearson, Ultra-microscale (5–25 µg C) analysis of individual lipids by
14C AMS : Assessment and correction for sample processing blanks, Radiocarbon
49 (2007) 69–82.