HAL Id: hal-02338506
https://hal.archives-ouvertes.fr/hal-02338506
Submitted on 30 Oct 2019
HAL is a multi-disciplinary open access
archive for the deposit and dissemination of
sci-entific research documents, whether they are
pub-lished or not. The documents may come from
teaching and research institutions in France or
abroad, or from public or private research centers.
L’archive ouverte pluridisciplinaire HAL, est
destinée au dépôt et à la diffusion de documents
scientifiques de niveau recherche, publiés ou non,
émanant des établissements d’enseignement et de
recherche français ou étrangers, des laboratoires
publics ou privés.
Discrimination of extra virgin olive oils from five French
cultivars: En route to a control chart approach
Astrid Maléchaux, Yveline Le Dréau, Pierre Vanloot, Jacques Artaud,
Nathalie Dupuy
To cite this version:
Astrid Maléchaux, Yveline Le Dréau, Pierre Vanloot, Jacques Artaud, Nathalie Dupuy. Discrimination
of extra virgin olive oils from five French cultivars: En route to a control chart approach. Food Control,
Elsevier, 2019, 106, pp.106691. �10.1016/j.foodcont.2019.06.017�. �hal-02338506�
Contents lists available atScienceDirect
Food Control
journal homepage:www.elsevier.com/locate/foodcont
Discrimination of extra virgin olive oils from five French cultivars: En route
to a control chart approach
Astrid Maléchaux
∗, Yveline Le Dréau, Pierre Vanloot, Jacques Artaud, Nathalie Dupuy
Aix Marseille Univ, Avignon Université, CNRS, IRD, IMBE, Marseille, France
A R T I C L E I N F O Keywords: Olive oil Fatty acids Cultivars Quality control Control chart Chemometrics A B S T R A C T
The control of varietal origin is an important issue to insure the authenticity of olive oils. In this study, extra virgin olive oils from five French cultivars were discriminated by applying partial least square discriminant analysis (PLS1-DA) to their fatty acid and squalene compositions obtained by gas chromatography. Two decision rules were compared to determine the varietal origin of predicted samples: either a classical PLS-DA approach with uncertainty zones, or a control chart approach with warning and control limits. The control chart approach, being focused on characteristic samples from each modelled cultivar, is able to deal with classes having un-balanced number of samples and to identify atypical samples.
1. Introduction
Olive oil is an emblematic product of the Mediterranean area, which has gained an increasing worldwide popularity due to its sensory and nutritional properties. In France, to make the most of the very small production volumes and answer the consumers’ demands for quality and authenticity, the producers put forth high-value extra virgin olive oils (EVOO) made from specific cultivars and possibly certified by a protected designation of origin. However, these products are an at-tractive target for fraudsters and their origin claims must thus be ver-ified (Garcia-Gonzalez & Aparicio, 2010). Several analytical methods have been developed for this purpose, studying either the global com-position of oils with spectroscopic techniques or specific markers with genetic or chromatographic techniques (Bajoub, Bendini, Fernadez-Gutierrez, & Carrasco-Pancorbo, 2018; Kontominas, 2019). Multi-variate statistical analyses, known as chemometrics, are often necessary to extract the relevant information from this complex data and dis-criminate authentic from non-authentic samples (Callao & Ruisanchez, 2018). Among the molecular markers, fatty acids are important for the determination of the purity of olive oils, with acceptable contents de-fined by trade standards (International Olive Council, 2018). Moreover, beyond these purity criteria, fatty acid composition can be associated with chemometrics for the determination of the varietal origin of olive oils. For instance, linear discriminant analysis models were developed to classify Sicilian and French cultivars respectively (Mannina et al., 2003; Ollivier, Artaud, Pinatel, Durbec, & Guérère, 2003), while an-other study used SIMCA models to discriminate between Turkish
cultivars (Gurdeniz, Ozen, & Tokatli, 2008). However, to our knowl-edge, partial least square discriminant analysis (PLS1-DA) has yet to be applied to predict the varietal origin of EVOO based on their fatty acid compositions. This algorithm requires the assignment of a binary coding to indicate if each sample belongs or not to the modelled cultivar. However, since PLS was originally built for the quantitative analysis of continuous variables, the predicted values are not binary and so it is necessary to define a rule indicating whether the predicted sample can be attributed or not to the modelled cultivar. A recent re-view presents different methods for determining the classification threshold, such as the choice of an arbitrary value, the determination of an optimal value using receiver operating characteristic curves, or the estimation of a probability density function (Lee, Liong, & Jemain, 2018). The latter is more flexible and can deal with unbalanced class sizes but requires more complex calculations. In this study, PLS1-DA was applied to predict the varietal origin of EVOO samples from five French cultivars. Two kinds of thresholds were considered. The first one is a classical approach currently used in chemometrics, defining an arbitrary threshold with an uncertainty zone between the target values 0 or 1. The second one is a novel approach based on quality control charts. Indeed, control charts are a common statistical tool for mon-itoring the conformity of products or processes with a reference value (Kourti & MacGregor, 1995;Shewhart, 1926). This approach may be more user-friendly than the probability density function since control charts are built using the simple computation of confidence intervals and are already a common tool in the food industry (Alli, 2004).
https://doi.org/10.1016/j.foodcont.2019.06.017
Received 25 March 2019; Received in revised form 17 May 2019; Accepted 7 June 2019
∗Corresponding author. Aix-Marseille Université, Faculté des Sciences St-Jérôme, Case 451, Av Escadrille Normandie Niémen, 13013, Marseille, France.
E-mail address:astrid.malechaux@imbe.fr(A. Maléchaux).
Available online 17 June 2019
0956-7135/ © 2019 Elsevier Ltd. All rights reserved.
2. Material and methods
2.1. Samples
Three hundred monovarietal EVOO samples produced between 2002 and 2017 were used for this study. An equal number of samples (n = 60) came from each of these five French cultivars, which are among the most typical in the Provence region: Aglandau (AG), Cailletier (CA), Picholine (PI), Salonenque (SA) and Tanche (TA). For each cultivar, samples were obtained from several harvest years to represent the an-nual variability due to external parameters such as climatic conditions: - AG: 2006 (n = 6), 2007 (n = 3), 2008 (n = 1), 2011 (n = 4), 2013 (n = 1), 2016 (n = 20), 2017 (n = 25) - CA: 2002 (n = 1), 2006 (n = 7), 2007 (n = 8), 2008 (n = 4), 2009 (n = 2), 2010 (n = 4), 2011 (n = 4), 2012 (n = 4), 2016 (n = 16), 2017 (n = 10) - PI: 2003 (n = 9), 2005 (n = 7), 2006 (n = 7), 2007 (n = 5), 2008 (n = 2), 2010 (n = 1), 2011 (n = 1), 2016 (n = 13), 2017 (n = 15) - SA: 2002 (n = 10), 2003 (n = 12), 2004 (n = 5), 2005 (n = 2), 2006 (n = 1), 2008 (n = 1), 2011 (n = 2), 2016 (n = 14), 2017 (n = 13) - TA: 2003 (n = 7), 2004 (n = 7), 2005 (n = 8), 2006 (n = 4), 2007 (n = 4), 2008 (n = 3), 2011 (n = 1), 2016 (n = 15), 2017 (n = 11) 2.2. Sample preparation
The transmethylation of the triacylglycerols from the extra virgin olive oil (EVOO) samples was conducted following the method de-scribed in a previous article prior to GC analysis (Laroussi-Mezghani et al., 2015).
2.3. Gas chromatography
GC analyses of the fourteen fatty acid methyl esters and squalene were performed using an Agilent gas chromatograph 7890A (Agilent Technologies Inc., Santa Clara, California). Hydrogen was used as a carrier gas with a flow of 1 mL/min. The instrument was equipped with a split/split-less injector (split ratio 1:60), a flame ionization detector and a Supelcowax 10 (Merck KGaA, Darmstadt, Germany) silica capil-lary column coated with polyethylene glycol (L × I.D. 60 m × 0.25 mm, df0.25 μm). The following temperature gradient was
applied: 210 °C during 20 min, then from 210 to 245 °C at 6 °C/min, and 245 °C for 20 min. The fourteen fatty acids and squalene percentages were weighted by their respective standard deviation and mean-cen-tered before chemometric analysis.
2.4. Chemometric analysis
The Unscrambler X software (version 10.4, CAMO Software) was used to conduct the chemometric processing. First, principal compo-nent analysis (PCA) was used as an exploratory tool to represent the dispersion of the samples and identify outliers. Indeed, this un-supervised pattern recognition technique projects the data from a large number of variables in a space defined by a small number of principal components (PCs) which describe most of the variance from the dataset. This results in scores plots indicating the similarities and differences among the samples, and loadings indicating which initial variables contribute to the construction of each PC (Bro & Smilde, 2014;Wold, 1987). Then, partial least square discriminant analysis (PLS1-DA) models were developed to predict the varietal origin of the samples. In this supervised patter-recognition method, a different model is built to discriminate each cultivar against all the others. This method was chosen over PLS2-DA predicting all cultivars simultaneously and SIMCA class analogy model, since a previous article comparing the results of these three algorithms indicated that PLS1-DA gave more satisfying
results (Galtier et al., 2011). The main sources of variability from the dataset are modelled by latent variables (LVs) and the scores are computed to maximize their covariance with the predicted variables. A full cross-validation procedure is applied during the calibration of each model in order to select the optimal number of LVs that minimizes the root mean square error of cross validation (RMSECV). Moreover, PLS1-DA derives from the PLS regression built for quantitative analysis, so it is necessary to assign a binary coding to indicate if a sample belongs (value of 1) of not (value of 0) to the modelled cultivar. Since the predicted values are not binary but rather continuous, a predicted sample is recognized as belonging to the modelled cultivar if its value is above a determined prediction threshold or belonging to the other cultivars otherwise (Barker & Rayens, 2003; Lee et al., 2018). The quality of the models was evaluated by the root mean square error of calibration (RMSEC) and coefficient of determination R2for the
cali-bration models, and root mean square error of prediction (RMSEP) and coefficient of determination Q2for the predictions (CAMO Software AS,
2016).
2.5. Key resource table
Resource Source Identifier Algorithm
PCA PLS1-DA Chemical
Hydrogen Gengaz, Claind Isooctane Carlo Erba Methanolic potassium hydroxide Sigma Aldrich Instrument
Gas chromatograph 7890A Agilent Technologies Inc. Supelcowax 10 column Merck KGaA
Software
The Unscrambler X CAMO Software
3. Results and discussion
3.1. Fatty acid and squalene compositions
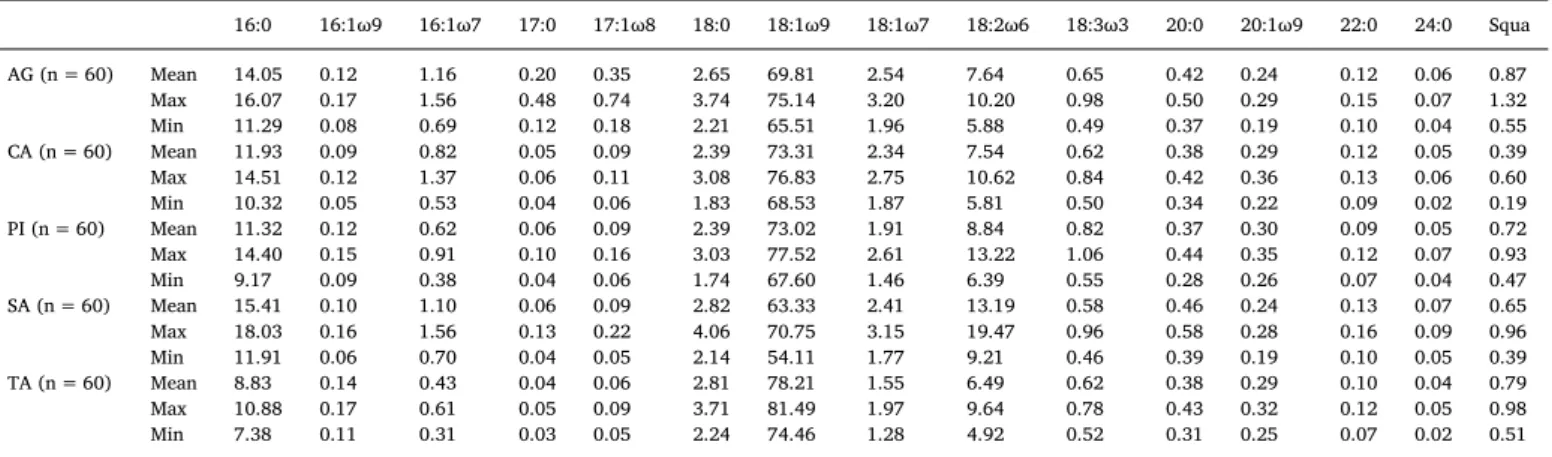
As can be seen inTable 1, each of the five studied cultivars has a characteristic composition with some fatty acids or squalene in higher or lower proportions than the other cultivars.
•
Aglandau oils have higher margaric (17:0) and margaroleic (17:1ω8)acid contents
•
Cailletier oils differ by their lower squalene (Squa) content•
Picholine oils have a higher linolenic (18:3ω3) acid content•
Salonenque oils contain more palmitic (16:0), linoleic (18:2ω6) andarachidic (20:0) acids but less oleic (18:1ω9) acid
•
Tanche oils are richer in oleic (18:1ω9) acid but poorer in palmitic(16:0), palmitoleic (16:1ω7) and vaccenic (18:1ω7) acids
These results support and complete the findings from a previous study (Ollivier et al., 2003).
3.2. Principal component analysis
The studied samples being commercial EVOOs, they are subject to annual variations resulting from uncontrolled weather and farming conditions. It is thus important to assess the variability of the samples and select only those that are representative of the typical composition of each cultivar to obtain reliable control charts. For this purpose, outliers were removed from the samples used for the calibration and validation of the models. Only the samples from the most recent pro-duction year (2017), including possible outliers, were kept as a final control set. In order to identify outliers among the samples from all
A. Maléchaux, et al. Food Control 106 (2019) 106691
production years but the last, PCA were built separately for each cul-tivar. Based on the influence plots representing the F-residuals versus Hotelling's T2 statistics (Bro & Smilde, 2014), three Aglandau, four
Cailletier, six Picholine, six Salonenque and one Tanche samples that did
not comply with the characteristics of their cultivar were removed. A global PCA was then realized to represent the repartition of the samples from all years but last without outliers.
Fig. 1-A shows the scores obtained on the first two PCs, representing 62% of the variability, with the samples from all years but the last after removal of the outliers. The samples are grouped according to their varietal origin. However, Picholine and Tanche are slightly overlapping on these two PCs and the Aglandau and Salonenque groups display a rather large dispersion. These observations indicate that chemometric models should be able to discriminate the varietal origin of these oils, but some samples may be more difficult to classify.
The corresponding loadings (Fig. 1-B) indicating the most influen-tial variables give complementary information in relation toTable 1. The characteristic fatty acids of each cultivar have a significant influ-ence on the first two PCs. For instance, palmitic (16:0), palmitoleic (16:1ω7), vaccenic (18:1ω7), linoleic (18:2ω6) and arachidic (20:0) acids are all positively correlated to PC1, while oleic (18:1ω9) acid is
negatively correlated. This is why Salonenque samples have positive scores while Tanche samples have negative scores on PC1. Similarly, margaric (17:0) and margaroleic (17:1ω8) acids are negatively corre-lated to PC2, which is consistent with the negative scores of Aglandau samples on PC2. Squalene is also negatively correlated to PC2, ex-plaining the positive scores of Cailletier samples. Furthermore, behenic (22:0) and lignoceric (24:0) acids, that were not considered char-acteristic inTable 1, appear to bring some significant information to the first PC.
3.3. Prediction of varietal origin by partial least square discriminant analysis
In order to build the models with a sufficient number of re-presentative samples from each cultivar, two thirds of the samples without outliers, from all harvest years but the last, were randomly selected and used as a calibration set to train the models (Aglandau, n = 22; Cailletier, n = 31; Picholine, n = 26; Salonenque, n = 27;
Tanche, n = 32). The remaining third was used as a prediction set to
test the performances of the models with samples typical from each cultivar (Aglandau, n = 11; Cailletier, n = 15; Picholine, n = 13;
Table 1
Mean, maximum and minimum fatty acid and squalene percentages in the five French olive oil cultivars (AG: Aglandau, CA: Cailletier, PI: Picholine, SA: Salonenque, TA: Tanche, n: number of samples).
16:0 16:1ω9 16:1ω7 17:0 17:1ω8 18:0 18:1ω9 18:1ω7 18:2ω6 18:3ω3 20:0 20:1ω9 22:0 24:0 Squa AG (n = 60) Mean 14.05 0.12 1.16 0.20 0.35 2.65 69.81 2.54 7.64 0.65 0.42 0.24 0.12 0.06 0.87 Max 16.07 0.17 1.56 0.48 0.74 3.74 75.14 3.20 10.20 0.98 0.50 0.29 0.15 0.07 1.32 Min 11.29 0.08 0.69 0.12 0.18 2.21 65.51 1.96 5.88 0.49 0.37 0.19 0.10 0.04 0.55 CA (n = 60) Mean 11.93 0.09 0.82 0.05 0.09 2.39 73.31 2.34 7.54 0.62 0.38 0.29 0.12 0.05 0.39 Max 14.51 0.12 1.37 0.06 0.11 3.08 76.83 2.75 10.62 0.84 0.42 0.36 0.13 0.06 0.60 Min 10.32 0.05 0.53 0.04 0.06 1.83 68.53 1.87 5.81 0.50 0.34 0.22 0.09 0.02 0.19 PI (n = 60) Mean 11.32 0.12 0.62 0.06 0.09 2.39 73.02 1.91 8.84 0.82 0.37 0.30 0.09 0.05 0.72 Max 14.40 0.15 0.91 0.10 0.16 3.03 77.52 2.61 13.22 1.06 0.44 0.35 0.12 0.07 0.93 Min 9.17 0.09 0.38 0.04 0.06 1.74 67.60 1.46 6.39 0.55 0.28 0.26 0.07 0.04 0.47 SA (n = 60) Mean 15.41 0.10 1.10 0.06 0.09 2.82 63.33 2.41 13.19 0.58 0.46 0.24 0.13 0.07 0.65 Max 18.03 0.16 1.56 0.13 0.22 4.06 70.75 3.15 19.47 0.96 0.58 0.28 0.16 0.09 0.96 Min 11.91 0.06 0.70 0.04 0.05 2.14 54.11 1.77 9.21 0.46 0.39 0.19 0.10 0.05 0.39 TA (n = 60) Mean 8.83 0.14 0.43 0.04 0.06 2.81 78.21 1.55 6.49 0.62 0.38 0.29 0.10 0.04 0.79 Max 10.88 0.17 0.61 0.05 0.09 3.71 81.49 1.97 9.64 0.78 0.43 0.32 0.12 0.05 0.98 Min 7.38 0.11 0.31 0.03 0.05 2.24 74.46 1.28 4.92 0.52 0.31 0.25 0.07 0.02 0.51
With 16:0: palmitic acid, 16:1 ω9: hypogeic acid, 16:1 ω7: palmitoleic acid, 17:0: margaric acid, 17:1 ω8: margaroleic acid, 18:0: stearic acid, 18:1 ω9: oleic acid, 18:1 ω7: vaccenic acid, 18:2 ω6: linoleic acid, 18:3 ω3: linolenic acid, 20:0: arachidic acid, 20:1 ω9: gondoic acid, 22:0: behenic acid, 24:0: lignoceric acid and Squa: squalene.
Fig. 1. Scores (A) and loadings (B) for the first two PCs of the PCA using fatty acids and squalene composition (■: Aglandau, ●: Cailletier, Δ: Picholine, □:
Salonenque, n = 14; Tanche, n = 16). The final control set from the last
production year was used to assess the performances of the models with sample sets containing possible outliers (Aglandau, n = 25; Cailletier, n = 10; Picholine, n = 15; Salonenque, n = 13; Tanche, n = 11).
Different models were built to predict each cultivar against all the others with a binary coding indicating if a sample belonged (value of 1) or not (value of 0) to the modelled cultivar. However, when using these “full” calibration sets, the number of samples from the modelled cul-tivar was much smaller than the sum of samples from the other culti-vars. This situation causes the mean calibration scores from the mod-elled cultivar to be lower than the expected value of 1, as can be seen in
Table 2. This result concurs with the observation from Borras et al., who reported the difficulty of PLS-DA models to accurately recognize the class with fewer samples (Borràs et al., 2016). Thus, to avoid the issues caused by unbalanced classes, other models were developed using “balanced” calibration sets, in which samples were randomly selected from the four other cultivars to reach the same number than that of the modelled cultivar (Aglandau model: 22 AG, 6 CA, 5 PI, 5 SA, 6 TA;
Cailletier model: 7 AG, 31 CA, 8 PI, 8 SA, 8 TA; Picholine model: 6 AG, 7
CA, 26 PI, 6 SA, 7 TA; Salonenque model: 6 AG, 7 CA, 7 PI, 27 SA, 7 TA;
Tanche model: 8 AG, 8 CA, 8 PI, 8 SA, 32 TA). However, in this case the
variability of the four other cultivars in each model is not so well re-presented, which tends to increase the dispersion of the predicted scores. In order to overcome this other issue, the random selection was conducted five times for each model and the final results were obtained by averaging the five predicted scores and quality parameters. More-over, two kinds of thresholds were tested to determine the attribution of the predicted samples to one class or the other, as illustrated inFig. 2:
•
The first approach was a classical PLS-DA arbitrary threshold with uncertainty zones taking into account the samples that were not clearly recognized by the model (Fig. 2-A). Considering that fatty acid proportions are good markers of the varietal origin of olive oils (Ollivier et al., 2003), conservative thresholds close to the expected values of 1 and 0 were selected. Samples were recognized as longing to the modelled cultivar if their predicted value was be-tween 0.7 and 1.3, or belonging to the other cultivars if their pre-dicted value was between −0.3 and 0.3. Samples prepre-dicted outside of these zones could not be clearly assigned to either the modelled cultivar or the other cultivars and were thus considered as un-certain. These uncertain samples should be analyzed again with a different technique to confirm their origin.•
The second threshold was built as a control chart to verify if a sample labelled as belonging to the modelled cultivar was authentic or not (Fig. 2-B). For this purpose, warning limits and control limits were established as confidence intervals at 95% and 99% respec-tively around the mean calibration scores (MCS) for the modelled cultivar only.= ± ×
warning limits MCS standard deviation
95% (2 )
= ± ×
control limits MCS standard deviation
99% (3 )
Samples were accepted as belonging to the modelled cultivar if their predicted value was inside the 95% warning limits, and rejected if their predicted value was outside the 99% control limits. Samples with a predicted value in the warning zone (between the 95% and 99% limits) were considered as uncertain and should also be analyzed again.
With the full calibration sets four LVs are sufficient to build the models discriminating the Cailletier, Picholine, Salonenque and Tanche samples, and only two LVs for the Aglandau model (Table 2). Indeed, the Aglandau samples may be easier to recognize as indicated by their good separation from the other cultivars on both PC1 and PC2 of the exploratory PCA analysis (Fig. 1-A). When using the balanced calibra-tion sets, the optimal number of LVs varies depending on the randomly selected samples used to build each model (Table 2). The models built using the full calibration set have satisfying quality parameters, as shown inTable 2, with RMSEC ranging from 0.09 for Salonenque to 0.16 for Picholine and R2between 0.94 for Salonenque and 0.83 for Picholine.
Moreover, due to the smaller number of samples from the modelled cultivar compared to the other ones, the mean of the Y scores for each modelled cultivar tends to be lower than the expected value of 1. This shift is less marked when using the models built with balanced cali-bration sets, which could thus improve the results. Using the balanced calibration sets does not significantly influence the RMSEC but im-proves the R2, which become greater than 0.90 for all the cultivars.
The results obtained when the models are applied to the prediction set without outliers are presented inTable 3. For the models built with the full calibration set the quality parameters are still good, with RMSEP between 0.11 for Aglandau and 0.19 for Picholine, and Q2
be-tween 0.91 for Aglandau and 0.77 for Picholine. Using the models with balanced calibration sets does not bring significant changes to the RMSEP and Q2, except for the model predicting Picholine which has
lower quality parameters (RMSEP of 0.22 and Q2of 0.72). Thus, the
smaller number of samples used in balanced calibration sets has a limited impact on the classification accuracy of the models. When using the classical approach, the confusion matrices indicate good prediction results for the models built with full calibration set, as could be ex-pected after removal of the outliers. There were no misclassified sam-ples with any of the models, only some samsam-ples in the uncertainty zones. The model predicting the Picholine cultivar was the least sa-tisfying, with a total of eight uncertain samples. The other models had fewer uncertain samples: five for the model predicting the Tanche cul-tivar, three for the Cailletier culcul-tivar, two for the Salonenque and one for the Aglandau model. Using the models built with balanced calibration sets brings little improvement to the recognition of the samples from each modelled cultivar. However, even with the repeated random se-lection, the variability of the other samples is not so well taken into account and more uncertain samples are detected from the other cul-tivars. For the models with full calibration sets, the control chart limits are more tightly centered around the mean predicted value of each modelled cultivar, which allows a better recognition of the samples for the Picholine and Tanche models. Moreover, the identification of sam-ples deviating from the average composition of the modelled cultivar is facilitated. Thus, one Cailletier sample and one Salonenque sample are considered as being too far from the average of their group although they were not identified as outliers in their respective PCA. On the other hand, the removal of the limits around the other cultivars results in overall fewer uncertain samples compared to the classical threshold: none with the Cailletier model, one with the Aglandau, Salonenque and
Tanche models, and six in the Picholine model. With the control chart
approach, the balanced calibration set does not seem to improve the results since the threshold is already centered around the mean pre-dicted value of the modelled class rather than the expected value of 1. Looking at the results obtained for the prediction of the varietal
Table 2
Statistical parameters, mean and standard deviation (SD) of the Y scores of the modelled cultivar for each PLS1-DA calibration model (AG: Aglandau, CA:
Cailletier, PI: Picholine, SA: Salonenque, TA: Tanche, n: number of samples). Modelled cultivar Calibration LV RMSEC R2 Y scores
mean Y scoresSD AG (n = 22) Full 2 0.10 0.93 0.94 0.14 Balanced 2 to 3 0.11 0.95 0.97 0.12 CA (n = 31) Full 4 0.12 0.91 0.93 0.11 Balanced 3 to 5 0.11 0.95 0.97 0.11 PI (n = 26) Full 4 0.16 0.83 0.85 0.20 Balanced 4 to 10 0.15 0.90 0.94 0.20 SA (n = 27) Full 4 0.09 0.94 0.95 0.14 Balanced 3 to 4 0.11 0.95 0.98 0.14 TA (n = 32) Full 4 0.15 0.87 0.90 0.19 Balanced 2 to 5 0.15 0.91 0.95 0.18
A. Maléchaux, et al. Food Control 106 (2019) 106691
origin of the samples from the final year (Table 4), the quality para-meters are slightly lower. This was expected since the final control set has not been cleared of its outlying samples. Models built with the full calibration set yield RMSEP between 0.14 for Cailletier and 0.21 for
Tanche, and Q2between 0.91 for Aglandau and 0.69 for Tanche. Using
models with balanced calibration sets slightly worsens the quality parameters, but they remain acceptable, with RMSEP between 0.17 for
Cailletier and 0.26 for Picholine and Q2between 0.90 for Aglandau and
Fig. 2. Predicted Y scores with decision rules for the two thresholds (A: PLS-DA classical approach, B: control chart approach, M: modelled cultivar, O: other
cultivars).
Table 3
Confusion matrices and statistical parameters of the PLS1-DA models predicting the origin of each cultivar for the samples from all years but last without outliers (AG:
Aglandau, CA: Cailletier, PI: Picholine, SA: Salonenque, TA: Tanche, n: number of samples).
Modelled cultivar Calibration Real class Predicted class [-0.3; 0.3]/[0.7; 1.3] Predicted class
Control chart 95% limits 99% limits RMSEP Q
2
AG Full AG Other Uncertain Accepted Rejected Uncertain 0.65; 1.22 0.51; 1.36 0.11 0.91
AG (n = 11) 10 0 1 10 0 1
Other (n = 58) 0 58 0 0 58 0
Balanced AG Other Uncertain Accepted Rejected Uncertain 0.73; 1.21 0.61; 1.33 0.12 0.89
AG (n = 11) 10 0 1 10 0 1
Other (n = 58) 0 57 1 0 58 0
CA Full CA Other Uncertain Accepted Rejected Uncertain 0.71; 1.14 0.60; 1.25 0.16 0.84
CA (n = 15) 14 0 1 14 1 0
Other (n = 54) 0 52 2 0 54 0
Balanced CA Other Uncertain Accepted Rejected Uncertain 0.75; 1.19 0.64; 1.30 0.18 0.83
CA (n = 15) 14 0 1 14 1 0
Other (n = 54) 0 50 4 0 54 0
PI Full PI Other Uncertain Accepted Rejected Uncertain 0.45; 1.26 0.25; 1.46 0.19 0.77
PI (n = 13) 9 0 4 13 0 0
Other (n = 56) 0 52 4 1 49 6
Balanced PI Other Uncertain Accepted Rejected Uncertain 0.55; 1.34 0.35; 1.53 0.22 0.72
PI (n = 13) 11 0 2 12 0 1
Other (n = 56) 0 49 7 1 51 4
SA Full SA Other Uncertain Accepted Rejected Uncertain 0.68; 1.22 0.54; 1.36 0.13 0.89
SA (n = 14) 12 0 2 12 1 1
Other (n = 55) 0 55 0 0 55 0
Balanced SA Other Uncertain Accepted Rejected Uncertain 0.69; 1.26 0.55; 1.40 0.14 0.87
SA (n = 14) 12 0 2 13 1 0
Other (n = 55) 0 53 2 0 55 0
TA Full TA Other Uncertain Accepted Rejected Uncertain 0.52; 1.28 0.32; 1.47 0.16 0.85
TA (n = 16) 14 0 2 16 0 0
Other (n = 53) 0 50 3 0 52 1
Balanced TA Other Uncertain Accepted Rejected Uncertain 0.60; 1.30 0.42; 1.48 0.18 0.83
TA (n = 16) 15 0 1 15 0 1
0.70 for Tanche. Confusion matrices obtained with the classical threshold indicate fairly good predicting ability of the models based on the full calibration set, with no misclassified samples but some un-certain samples for each model: four in the Salonenque model, five in the Aglandau, and Cailletier models. Picholine and Tanche models give less satisfactory results, with twelve and thirteen uncertain samples respectively. Using models built with balanced calibration sets im-proves the results for the Cailletier and Tanche models, giving only two and seven uncertain samples respectively. However, more samples are found in the uncertainty zone for the Aglandau, Picholine and Salonenque models. Similarly to what was observed with the prediction set cleared of outliers, the use of the control chart approach allows a better pre-diction of the Tanche cultivar, and less uncertain samples for all models but the Picholine. Indeed, with the full calibration model for Picholine twelve uncertain samples are found, in addition to one outlying
Pi-choline sample and one other sample falsely predicted as PiPi-choline. The Aglandau model also finds three uncertain and four outlying samples.
The other models present no misclassified samples, but only three un-certain samples for Cailletier and one for Tanche. The Salonenque model results in perfect prediction with no misclassified or uncertain sample. Finally, contrary to what was observed with the prediction set, the results obtained with the control set indicate that using balanced cali-bration models could further improve the prediction with the control chart thresholds. The combination of both gives fewer uncertain sam-ples for all the models, even if three outliers are still detected with the
Aglandau model. Perfect predictions are obtained for the Cailletier, Salonenque and Tanche cultivars when applying the control chart
ap-proach to the models built with balanced calibration sets.
4. Conclusion
PLS1-DA models can predict the varietal origin of olive oils from five main French cultivars based on their fatty acid and squalene per-centages obtained by GC analysis. The classical PLS-DA approach is not well suited to unbalanced classes, which create a shift in the predicted values of the modelled cultivar. Building the calibration models with balanced classes results in better prediction of the modelled cultivar, however the variability of the other cultivars is not so well taken into account. This issue can be avoided by using the control chart approach proposed in this article. This approach focuses only on the recognition of the modelled cultivar, thus resulting in a more accurate dis-crimination. Samples that deviate from the typical characteristic of their cultivar can be uncovered by the control chart. These samples should be analyzed again with a different method, such as sensory analysis, infrared spectroscopy or genotyping, to confirm their origins. Moreover, future studies could focus on the application of the control chart approach to the detection of monovarietal olive oil adulteration with cheaper oils.
Funding
This work was supported by the French National Agency for Research (ANR) as part of the European Union’s Seventh Framework Program for research, technological development and demonstration (grant agreement number 618127).
Table 4
Confusion matrices and statistical parameters of the PLS1-DA models predicting the origin of each cultivar for the samples from the final year (AG: Aglandau, CA:
Cailletier, PI: Picholine, SA: Salonenque, TA: Tanche, n: number of samples).
Modelled cultivar Calibration Real class Predicted class [-0.3; 0.3]/[0.7; 1.3] Predicted class
Control chart 95% limits 99% limits RMSEP Q
2
AG Full AG Other Uncertain Accepted Rejected Uncertain 0.65; 1.22 0.51; 1.36 0.17 0.91
AG (n = 25) 20 0 5 18 4 3
Other (n = 49) 0 49 0 0 49 0
Balanced AG Other Uncertain Accepted Rejected Uncertain 0.73; 1.21 0.61; 1.33 0.20 0.90
AG (n = 25) 20 0 5 19 3 3
Other (n = 49) 0 44 5 0 49 0
CA Full CA Other Uncertain Accepted Rejected Uncertain 0.71; 1.14 0.60; 1.25 0.14 0.85
CA (n = 10) 7 0 3 7 0 3
Other (n = 64) 0 62 2 0 64 0
Balanced CA Other Uncertain Accepted Rejected Uncertain 0.75; 1.19 0.64; 1.30 0.17 0.82
CA (n = 10) 10 0 0 10 0 0
Other (n = 64) 0 62 2 0 64 0
PI Full PI Other Uncertain Accepted Rejected Uncertain 0.45; 1.26 0.25; 1.46 0.20 0.76
PI (n = 15) 14 0 1 14 1 0
Other (n = 59) 0 48 11 1 46 12
Balanced PI Other Uncertain Accepted Rejected Uncertain 0.55; 1.34 0.35; 1.53 0.26 0.73
PI (n = 15) 13 0 2 13 0 2
Other (n = 59) 0 48 11 1 54 4
SA Full SA Other Uncertain Accepted Rejected Uncertain 0.68; 1.22 0.54; 1.36 0.16 0.84
SA (n = 13) 13 0 0 13 0 0
Other (n = 61) 0 57 4 0 61 0
Balanced SA Other Uncertain Accepted Rejected Uncertain 0.69; 1.26 0.55; 1.40 0.19 0.82
SA (n = 13) 13 0 0 13 0 0
Other (n = 61) 0 54 7 0 61 0
TA Full TA Other Uncertain Accepted Rejected Uncertain 0.52; 1.28 0.32; 1.47 0.21 0.69
TA (n = 11) 5 0 6 11 0 0
Other (n = 63) 0 56 7 0 62 1
Balanced TA Other Uncertain Accepted Rejected Uncertain 0.60; 1.30 0.42; 1.48 0.21 0.70
TA (n = 11) 10 0 1 11 0 0
Other (n = 63) 0 57 6 0 63 0
A. Maléchaux, et al. Food Control 106 (2019) 106691
Acknowledgements
The authors thank Christian Pinatel from the AFIDOL (French in-terprofessional association of olive, Aix en Provence, France) for pro-viding the olive oil samples. Thank-you also to the trainee students, Cécile Grapeloup and Théo Brunet, for their invaluable help in carrying out the GC analyses.
References
Alli, I. (2004). Vocabulary of food quality assurance. Food quality assurance: Principles and
practices (pp. 1–26). Boca Raton: CRC Press LLC.
Bajoub, A., Bendini, A., Fernadez-Gutierrez, A., & Carrasco-Pancorbo, A. (2018). Olive oil authentication: A comparative analysis of regulatory frameworks with especial em-phasis on quality and authenticity indices, and recent analytical techniques devel-oped for their assessment. A review. Critical Reviews in Food Science and Nutrition,
58(5), 832–857.
Barker, M., & Rayens, W. (2003). Partial least squares for discrimination. Journal of
Chemometrics, 17, 166–173.
Borràs, E., Ferré, J., Boqué, R., Mestres, M., Aceña, L., Calvo, A., et al. (2016). Olive oil sensory defects classification with data fusion of instrumental techniques and mul-tivariate analysis (PLS-DA). Food Chemistry, 203, 314–322.
Bro, R., & Smilde, A. K. (2014). Principal component analysis. Anal. Methods, 6, 2812–2831.
Callao, M. P., & Ruisanchez, I. (2018). An overview of qualitative methods for food fraud detection. Food Control, 86, 283–293.
CAMO Software AS (2016). The Unscrambler® appendices: Method references.https://www. camo.com/TheUnscrambler/Appendices/, Accessed date: 7 March 2019. Galtier, O., Abbas, O., Le Dréau, Y., Rébufa, C., Kister, J., Artaud, J., et al. (2011).
Comparison of PLS1-DA PLS2-DA and SIMCA for classification by origin of crude petroleum oils by MIR and virgin olive oils by NIR for different spectral regions.
Vibrational Spectroscopy, 55, 132–140.
Garcia-Gonzalez, D. L., & Aparicio, R. (2010). Research in olive oil: Challenges for the near future. Journal of Agricultural and Food Chemistry, 58, 12569–12577. Gurdeniz, G., Ozen, B., & Tokatli, F. (2008). Classification of Turkish olive oils with
re-spect to cultivar, geographic origin and harvest year, using fatty acid profile and mid-IR spectroscopy. European Food Research and Technology, 227, 1275–1281. International Olive Council (2018). Trade standard applying to olive oils and olive pomace
oils. COI/T.15/NC No 3/Rev. 12.
Kontominas, M. G. (2019). Authentication and detection of the adulteration of olive oil. New York: Nova Science Publishers, Inc.
Kourti, T., & MacGregor, J. F. (1995). Process analysis, monitoring and diagnosis, using multivariate projection methods. Chemometrics and Intelligent Laboratory Systems, 28, 3–21.
Laroussi-Mezghani, S., Vanloot, P., Molinet, J., Dupuy, N., Hammami, M., Grati-Kamoun, N., et al. (2015). Authentication of Tunisian virgin olive oils by chemometric analysis of fatty acid compositions and NIR spectra. Comparison with Maghrebian and French virgin olive oils. Food Chemistry, 173, 122–132.
Lee, L. C., Liong, C.-Y., & Jemain, A. A. (2018). Partial least squares-discriminant analysis (PLS-DA) for classification of high-dimensional (HD) data: A review of contemporary practice strategies and knowledge gaps. Analyst, 143, 3526–3539.
Mannina, L., Dugo, G., Salvo, F., Cicero, L., Ansanelli, G., Calcagni, C., et al. (2003). Study of the cultivar-composition relationship in Sicilian olive oils by GC, NMR, and sta-tistical methods. Journal of Agricultural and Food Chemistry, 51, 120–127. Ollivier, D., Artaud, J., Pinatel, C., Durbec, J. P., & Guérère, M. (2003). Triacylglycerol
and fatty acid compositions of French virgin olive oils. Characterization by chemo-metrics. Journal of Agricultural and Food Chemistry, 51, 5723–5731.
Shewhart, W. A. (1926). Quality control charts. Bell Syst. Tech. J. 5(4), 593–603. Wold, S. (1987). Principal component analysis. Chemometrics and Intelligent Laboratory