HAL Id: hal-02349756
https://hal.archives-ouvertes.fr/hal-02349756v2
Submitted on 9 Nov 2020HAL is a multi-disciplinary open access archive for the deposit and dissemination of sci-entific research documents, whether they are pub-lished or not. The documents may come from teaching and research institutions in France or abroad, or from public or private research centers.
L’archive ouverte pluridisciplinaire HAL, est destinée au dépôt et à la diffusion de documents scientifiques de niveau recherche, publiés ou non, émanant des établissements d’enseignement et de recherche français ou étrangers, des laboratoires publics ou privés.
nanowires studied by combination of off-axis electron
holography imaging and micromagnetic simulations
Nicolas Biziere, David Fernando Reyes Vasquez, T. Wade, Bénédicte
Warot-Fonrose, Christophe Gatel
To cite this version:
Nicolas Biziere, David Fernando Reyes Vasquez, T. Wade, Bénédicte Warot-Fonrose, Christophe Gatel. Multi magnetic states in Co/Cu multilayered cylindrical nanowires studied by combination of off-axis electron holography imaging and micromagnetic simulations. Journal of Applied Physics, American Institute of Physics, 2019, 126 (16), pp.163906. �10.1063/1.5124620�. �hal-02349756v2�
1
Multi magnetic states in Co/Cu multilayered cylindrical nanowires studied by combination of off-axis electron holography imaging and micromagnetic simulations
N. Biziere1, D. Reyes1, T. L. Wade2, B. Warot-Fonrose1 and C. Gatel1
1CEMES CNRS-UPR 8011, Université de Toulouse, 31055 Toulouse, France
2Laboratoire des Solides Irradiés, Ecole Polytechnique, CNRS, CEA, Université Paris Saclay, F 91128 Palaiseau, France
Abstract: We report on a wide variety of magnetic states in Co/Cu multilayered nanocyli nders grown by electrodeposition with different thicknesses of both elements. The remnant magnetic states in individual Co layers have quantitatively been determined at the nanoscale by micromagnetic reconstruction of the magnetic phase shift image obtained by electron holography. We demonstrate that the magnetization in the Co layers can present either uniform or vortex states. Also, different magnetic configurations can be observed within the same nanocylinder. In the case of vortices, the direction of the core can rotate almost at 90° from the nanocylinder axis for layers with aspect ratio close to 1. We show that the occurrence of each magnetic configuration depends on the aspect ratio of the layers, the direction of magnetocrystalline anisotropy and in some cases on the interlayer dipolar coupling. Such a wide variety of magnetic states are observed due to lower values of the Co magnetic constants (magnetization, exchange, anisotropy) with respect to bulk, typical of electrodeposition process in a single bath, and to the local geometrical variation of the layers. We also calculated the phase diagram of the remnant magnetic states in a single layer for various amplitudes and orientations of the magnetocrystalline anisotropy and different directions of the saturation field. In particular cases, these phase diagrams in addition to statistics of occurrence of each kind of magnetic configurations in the multilayer and the application of a saturation field in different directions allows recovering information on the preferential orientation of the crystalline anisotropy.
I.
IntroductionThe understanding and observation of magnetic configurations in 3D nanostructures is a major topic in nanomagnetism. As recently pointed out in the review of Fernandez-Pacheco et al.1 3D magnetism
opens some new paths for magnetic sensors, high-density data storage or magnetic domain wall based devices. In particular, domain walls in cylindrical nanowires, i.e. nanocylinders (NC), and nanotubes2
are particularly attractive for developing Racetrack memory 3 as they can be manipulated with velocities
above the usual Walker limit encountered in nanostripes.
Despite the strong interest in these novel cylindrical nanostructures, the magnetic configurations in multilayered systems with such geometry have been poorly studied up to date while they present multiple advantages for many magnetic applications. Besides the possibility of having high Giant Magneto-Resistance4 at room temperature, they can be basic blocks for synchronized spin torque
nano-oscillators5. They are also interesting for developing thermoelectric applications6 or novel magnonic
devices7. In order to realize such applications, controlling the magnetic states of the different magnetic
layers is a crucial step. However, variations of structural, geometrical and chemical properties of the layer have a direct impact on its magnetic configuration and therefore on device performance. For example, it has been demonstrated that the remnant state in NC of uniform chemical composition can show different configurations due to variations of the magnetocrystalline anisotropy or NC diameter8-16.
In multilayers, interlayer dipolar coupling further complicates the understanding of the magnetic state as metastable states in the individual layers can be stabilized. It is then a key point to have a deeper knowledge of the interplay between magnetic states and local properties in multilayers in order to control the properties of the potential devices.
Several techniques can be used for elaborating multilayered nanowires. Among them, the electrodeposition method has been widely employed as it is particularly efficient to get tens of multilayers and quite easy to set-up. However, multilayers are generally grown from a single bath containing all chemical ions to be deposited. As a consequence, the co-deposition of at least one of the
2
chemical species in the other is very difficult to avoid17,18 inducing local variations of the chemistry of
the layers which might change the magnetic properties of the targeted material. Special care on the growth conditions has then to be performed to get reproducible devices, besides a fine structural, chemical and magnetic analysis on the artificial alloy.
To achieve this, one of the main challenges is the observation and determination of magnetic configurations at the nanometer scale in relation to the variation of the structural parameters. In this work, we combined different electron microscopy techniques and micromagnetic simulations for a deeper understanding of the magnetic states in Co/Cu multilayered nanocylinders. We used off-axis electron holography to study the remnant magnetic states and the structural parameters of different NCs varying the Co and Cu thicknesses with a spatial resolution of 2 nm. This is about 30 times better than pioneering studies19,20 of magnetic states in multi-layered wires by EH, and almost 5 times better than
recent experiments21. Complementary structural and chemical properties were determined by
conventional and high-resolution electron microscopy, Energy Filtered Transmission Electron Microscopy (EFTEM) and Electron Energy Loss Spectroscopy (EELS). Our methodology based on the quantitative comparison between the experimental and calculated magnetic phase shift image allows discriminating between different possible magnetic states. This work completes our previous report on the magnetic configurations in a Co25 nm/Cu15 n m electrodeposited nanocylinder22. Here we focused on
our attention on the influence of the dipolar coupling and aspect ratio of the different layers on the remnant states. All observed magnetic configurations are explained as a function of the intrinsic parameters of the layers. In particular, the role of the magnetocrystalline anisotropy, which is intrinsically related to the local structure of the layer, is found to play a major role.
II.
Experime ntal methodsNanocylinders were grown by electrodeposition in commercial polycarbonate membranes. Their diameters range between 70 and 90 nm. In order to study the effect of the aspect ratio and dipolar coupling on the magnetic states, four series of samples with different nominal Co and Cu t hicknesses have been realized, namely Co25 n m/Cu15 nm, Co25 nm/Cu45 n m, Co50 nm/Cu50 nm and Co100 nm/Cu100 nm. The
Co/Cu NCs were grown in a pulsed mode in a single bath solution containing 0.43 mol/L of CoSO4·H2O,
0.01 mol/L of CuSO4 and 0.58 mol/L of H3BO4. The potential of the electrical pulses used for the
deposition of the Co and Cu layers were -1.0 V and -0.3 V respectively. Removing as much as possible of the polycarbonate membrane is a crucial step for electron holography experiments allowing an increase in the signal/noise ratio of the magnetic image. Multiple washing of the samples in dichloromethane was then performed after the electrodeposition process to remove the polycarbonate from the NCs. The final step consisted to deposit the clean NCs on a holey carbon grid before electron microscopy studies.
Bright field, high resolution, EFTEM and EELS experiments were realized for structural and chemical studies using a Tecnai F20 microscope operating at 200 kV, fitted with an objective lens aberration corrector (CEOS) and a GIF Tridiem to acquire elementary maps of Cu and Co using the three windows method23 and filtering the signal coming from the Co-L edge (778eV) and Cu-L edge
(931eV).
Off-axis electron holography (EH) experiments were performed on the same NCs using a dedicated HF3300C Hitachi TEM fitted with a cold emission gun providing high spatial and temporal coherence for interferometric studies. Dedicated Lorentz modes combined with the B-core corrector were developed to achieve a 0.5 nm spatial resolution in a field-free magnetic environment. All the holograms were recorded in a 2 biprism configuration24 to avoid artefacts linked to Fresnel fringes and to set
separately the interference area size and the fringe spacing. The fringe spacing has been set to 1 nm in this study. Phase and amplitude images were extracted from the holograms using homemade software based on classical Fourier analysis (FFT). The size of the digital mask used in the FFT was chosen to obtain a spatial resolution of 2 nm on phase and amplitude images. The magnetic and electrostatic contributions to the phase shift were separated by switching the sample upside down. The Magnetic Phase Shift Image (MPSI) corresponds to the component of the magnetic induction B perpendicular to the electron beam direction and projected over the beam path. Prior to the EH observation of the remnant magnetic states, the NCs were saturated with a magnetic field of 1T produced by an external electromagnet. A first observation was performed with a saturation field (µ0Hs) applied in a direction
3
parallel (PL configuration) to the NC axis before a second observation after saturation perpendicular (PP configuration) to the NC axis. The precision of the alignment between the NC axis and the field is estimated to be lower than 10°. For all set of samples except Co100 nm/Cu100 nm, about 15 NCs were
observed in order to discuss the statistic of the appearance of the different magnetic configurations. To recover the magnetic configurations observed in the MPSI, we performed micromagnetic simulations of the magnetic remnant states and compute the corresponding simulated MPSI. We first sum the magnetization M and dipolar field Hd to calculate the induction field B=µ0(M+Hd). Then, the
corresponding MPSI was numerically computed by integrating the components of B parallel to the object plane along the electron path (Y direction in our experiment and simulations) using the following expression :
𝜙𝑀(𝑹) = − 𝑒
ℏ∬ 𝐁⊥(𝐫⊥, y)dr⊥dy (1)
were 𝜙𝑀 the magnetic phase shift, R the three-dimensional (3D) position vector, e the elementary
electron charge, ℏ the reduced Planck constant, 𝐁⊥the perpendicular magnetic components to the
electron path (i.e. parallel to the object plane) and 𝐫⊥ the position vector in the object plane (here the
x-z plane)
Micromagnetic simulations were realized using the 3D OOMMF package25, in a universe of 180 x
180 x 180 nm3 for the single layer phase diagram and 2400 x 600 x 600 nm3 for multilayers. The cell
size is 3 x 3 x 3 nm3, close to the spatial resolution of the experimental MPSI and below the exchange
length of the Cobalt (≈ 5 nm with our experimental values of magnetization and exchange given below). All 3D remnant magnetic states presented below were calculated after saturation with a 1T magnetic field applied parallel or perpendicular to the NC axis, and a misalignment of 10° to reproduce the uncertainty of the experimental conditions. The average structural parameters deduced from TEM experiments such as orientation, thickness, and diameter of the layers were implemented in OOMMF with a home-made script. In order to reproduce as much as possible the real geometry of the Co layers and in particular the orientation of the layers with respect to the NC axis, we applied the following procedure. We first defined a disc with nominal thickness and very large lateral dimensions with respect to the NC diameter. Then a cylinder with a nominal diameter of the NC obtained by TEM measurements is passed through the layer. The layer was tilted around the y and x axis with angles deduced from TEM analysis. Only the volume determined by the intersection of the initial layer and the cylinder was considered as the Co part. We then adjusted all the parameters (tilt angles, thickness) until the apparent thickness and orientation of the layer in the TEM image were respected. At the end of this process, a complex geometry similar to a cylinder with two tilted surfaces was recovered. In our simulations, the electron path corresponds to the + y to - y direction as shown in Fig 1.
4
Figure 1: Scheme of the procedure to define the geometry of one layer in the micromagnetic simulations.
n is the unit vector perpendicular to the plane of the layer. x’y’n corresponds to the orthogonal rotated
frame after rotation of the layer around the y and x axis respectively. θk is the relative angle between n and the direction of the magnetocrystalline anisotropy field Hk. Hs is the external saturation magnetic
field.
The magnetic parameters of the simulations are the magnetization amplitude Ms, the exchange constant A, and the direction θk and amplitude Ku of the magnetocrystalline anisotropy Hk. For the latter,
our model considers only an uniaxial crystal anisotropy. This assumption relies on the polycrystalline nature of the Co layers averaging the anisotropy. For every simulation, the starting values of Ms, A and Ku are respectively 1200.103 A/m (µ0Ms 1.5T), 22.10-12 J/m and 130.103 J/m3 (µ0Hk 1.5T). These values
are the ones obtained from our previous experiments on Co25nm/Cu15nm22. Finally, the value of Ms
corresponds to the averaged value measured using EH experiments on single Co NCs grown in the same electrochemical bath (not shown here). After the first simulation, the parameters are adjusted until the qualitative and quantitative agreement with the experimental MPSI. With this method, we recover the 3D magnetic configuration of the layers as well as the underlying magnetic parameters.
III.
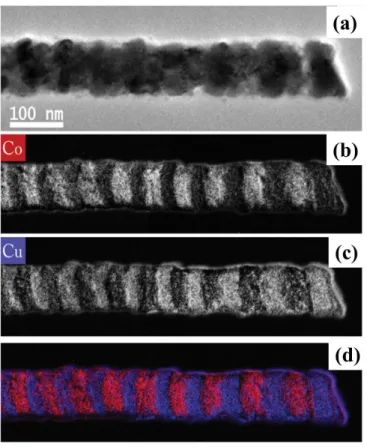
Structural analysisA bright field (BF) TEM image of a typical Co/Cu multilayered NC with 50 nm/50 nm of nominal thicknesses is shown in Fig. 2(a). It presents an average diameter of 85 ± 2 nm. It is obvious that the different layers are difficult to observe by conventional TEM techniques as the difference of contrast between the Co and the Cu is quite weak. In order to precisely determine the position and the shape of the different layers, we performed EFTEM experiments over the same area. Fig. 2(b) and (c) present the corresponding elemental maps of Co and Cu respectively. Fig. (2d) is the combination of the previous maps where the alternation of Co and Cu layers is clearly seen in red and blue, respectively. We observe that some of the layers are rotated a few degrees with respect to the expected position (90° respect to the wire axis). While Co impurities are barely visible in the Cu layers, a non-negligible amount of Cu seems to be present into the Co layers.
5
Figure 2 : (a) Bright field transmission image of a Co/Cu nanocylinder. EFTEM images of the same
NC recorded at the cobalt (b) and copper (c) edge. (d) Cobalt (red) and copper (blue) map as the result of the superimposition of (b) and (c).
To quantify the amount of the Cu impurities in the Co layers, EELS spectra have been recorded on different Co/Cu multilayered NCs (see supplementary material in ref 22). The extracted data confirm a very low Co amount in the Cu layers but give a Cu amount of about 15% in the Co part. This result has already been obtained in other works26-28 and is due to the lower Co deposition potential (-1.0 V)
compared to the Cu one (-0.3 V). As a consequence, a small amount of Cu is co-deposited during the Co deposition if a single bath method is used in the electrodeposition process.
Statistical analysis was performed from the EFTEM images on tens of layers observed in the different wires that give a distribution of apparent thickness for each set of samples. In TABLE I the relation of the nominal and measured thicknesses of the layers with the corresponding standard deviation are shown. The nominal thickness is defined as the one expected from the duration of the Co and Cu voltage pulses. The distribution indicates that the standard deviation increases with the increase of the NC thickness. However, the mean thickness of the electrodeposited layers remains in good agreement with the nominal thicknesses. The mean diameter for each set of samples and the standard deviation are presented in TABLE I. The NC diameter varies between 50 nm and 90 nm regardless of the thickness of the layers. These values are 2 to 3 times larger than the nominal pore size labeled by the manufacturer (30 nm). The difference between the real and the nominal pore size given by the manufacturer has been already observed29. Different explanations exist30,31 as for instance the variation of the cross-section of
the pores in the membrane pores which are not cylindrical.
TABLE I. Nominal and measured thicknesses for the different set of Co/Cu NCs with the corresponding
standard deviation extracted from the statistical TEM analysis.
Nominal thickness Co/Cu (nm/nm) Averaged measured thickness Co/Cu (nm/nm) Standard deviation (nm/nm) Mean diameter (nm) Standard deviation of the mean diameter (nm) 25/15 24/14 4/8 65 10 25/45 22/46 5/14 74 7 50/50 42/46 13/17 68 8 100/100 90/110 24/44 69 10
High Resolution (HR) TEM images demonstrate the polycrystalline structure of Co and Cu layers with grains randomly oriented presenting a mean size of 7 ± 2 nm (Fig. 3(a)). The polycrystalline character of the Co and Cu layers is confirmed calculating the FFT of HRTEM images as presented in Fig. 3(b). The analysis of the ring diameters and spacing indicates polycrystalline cubic (fcc) phases for Co and Cu as expected when some Cu is inserted into the Co layer32,33 which was confirmed by EFTEM
and EELS analysis. Similar characteristics as the ones presented in Fig. 3 are found for all multilayered Co/Cu NCs whatever the Co and Cu thicknesses.
6
Figure 3. (a) High resolution TEM image and (b) FFT pattern of a Co layer calculated from (a).
IV.
Magnetic properties of a single layerIn order to understand which magnetic configurations can be expected in our complex geometries and how they appear in the MPSI, we first present micromagnetic simulations of the phase diagram in a single layer, i.e. without taking into account the dipolar interaction between neighbouring Co layers. To reproduce the geometrical uncertainty of our real system, simulations were performed considering a tilt of 15° and 5° around the y and x axis respectively, z being the NC axis. The values of Ms, A and Ku
are respectively 1200.103 A/m (µ
0MS 1.5T), 22.10-12 J/m and 130.103 J/m3. These values correspond to
the one obtain to reproduce the magnetic configurations observed in Fig. 2 of reference 22. In the following, we will use and as the azimuthal and the longitudinal angles respectively (spherical coordinates) in the xyz reference frame. θk and φk are the azimuthal and the longitudinal angle
respectively in the rotated x’y’n frame related to the tilted surface of the layer (see Fig. 1). Here, we took different orientations of Hs either parallel (θ=10° φ =10°) or perpendicular (θ=80° φ=10°) from the
wire axis. Two different orientations θk of the crystal anisotropy Hk with respect to the normal of the
layer n has also been considered. However, all orientations (θk and φk) of the crystal anisotropy were
not tested to limit the simulation time. So we arbitrarily considered θk to be equal either to 10° or 80°
7
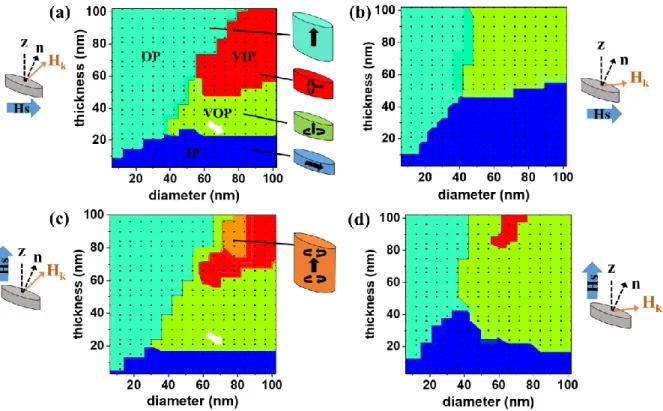
Figure 4: Remnant state phase diagrams of a single tilted layer for different orientations of Hk and Hs.
θk is equal to 10° in a) and c) and 80° in b) and d). The different magnetic configurations are color coded in the diagrams and schematically represented with the same color code beside in a) and c). The black points in the diagram corresponds to the simulated data. Legend IP (In plane), OP (Out of Plane), VIP (Vortex In Plane), VOP (Vortex Out of Plane). The white arrow in (a) and (c) shows the parameters used for the simulation of the multilayers system in Reference 22.
Basically, we can observe four different states which are color coded in Fig. 4. We will not focus on transition states (orange in Fig. 4(c)) which appear in particular cases we did not experimentally observe. The blue and turquoise colors correspond to uniform magnetic configurations, with the magnetization pointing either in the Co layer plane (In-plane “IP” state) or along the NC axis, i.e. z direction (Out-of-Plane “OP” state) respectively. The green and red colors represent vortex states with the core pointing either perpendicular (VOP state) to the layer plane or roughly in the layer plane (VIP state, the angle between the direction of the core and n being at least > 45 °). It is worth noting that micromagnetic simulations show the appearance of vortices for thicknesses down to 25 nm. For perfect layers, i.e. with surfaces perfectly perpendicular to the z axis (flat discs) the limit thickness to get vortices is at least 30 nm. The fact that vortex states are favoured in our particular geometry demonstrates the importance of being as close as possible of the real geometry of the sample in micromagnetic simulations at very small scales.
The occurrence of the different states is related to the aspect ratio (thickness/diameter) of the layer and the competition between the shape and magnetocrystalline anisotropies with the direction of the applied saturation field Hs. For example, these diagrams emphasize the importance of the direction of
both Hk and Hs. When Hk rotates from out of plane axis to in-plane axis, the area corresponding to the
IP state grows as expected. Interestingly, Hk also influences the orientation of the vortex core. As shown
in Fig. 4(a) and (c), for small values of θk and aspect ratio close to 1, the vortex core rotates toward the
layer plane, with a typical angle between n and the vortex core > 60°, in order to decrease the magnetocrystalline energy. Indeed, when the core rotates, a bigger portion of the magnetic volume aligns with Hk. As observed in Fig. 4(c) and (d), such feature almost disappears for θk= 80°. Typically, we
verified that it strongly reduces when θk is above 30°.
We also observed a strong effect of the Hs direction on the remnant states. Indeed, for both
8
perpendicular to the layer plane. Interestingly, for particular aspect ratios, the system can switch from IP to VOP states by tunning Hs. This behaviour already observed in our previous report22 shows that the
application of a saturation magnetic field in different directions might be a tool to recover information on the intrinsic parameters of the nano-objects.
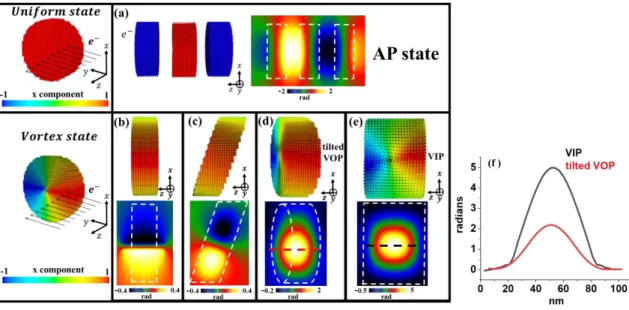
In order to determine the different magnetic configurations of the layers, we first need to define how they appear in the MPSI. It is first important to remember that the images recorded in off-axis EH corresponds to the 2D projection of the magnetic induction field B perpendicular to the electron beam and integrated over the entire path. This 2D projection can lead to misinterpretations in the determination of the remnant states. To give simple examples, we present in Fig. 5 the MPSI of different simulated magnetic configurations. The simplest configuration corresponds to the case of the IP state for which the magnetization is uniform in the layer plane and oriented perpendicular to the direction of the electron path. The IP state of each Co layer favors an antiparallel coupling (AP state) between them due to inter layer dipolar coupling. In such a case, the MPSI will appear as presented in Fig. 5(a). Following the isophase lines, corresponding to the color lines in the Figure, which follows the direction of the 𝐁⊥components, we observe a magnetization in the Co layers perpendicular to the NC axis (corresponding to the z-axis in Fig. 5 which alternately changes its direction from a Co layer to the other. This variation of direction induces the change of color in each layer.
Fig. 5(b-e) show the variation of the MPSI for a perfect vortex state observed for different orientations of the layer. Fig. 5(b) and (c) correspond respectively to a perfect alignment of the layer in relation to the NC axis and to a rotation around the y-axis. In these cases, the only non-null averaged component of the magnetization perpendicular to the electron path is the core of the vortex inducing a strong gradient of the phase shift at the centre of the layer in the MPSI. The vortex core is recognized by following the isophase lines in the center of the layer. The situation is very different in Fig. 5(d) and e). The layer in Fig. 5(d) is a 35 nm thick layer tilted around the x axis (≈ 15°) while the one in Fig. 5 (e) corresponds to a 55 nm thick layer which is not tilted at all. The direction of the vortex core is different between these configurations, pointing either perpendicular (VOP state) or parallel (VIP state) to the layer plane. However, they both appear qualitatively similar with a circular shape of comparable thickness in the MPSI after the 2D projection. In the 55 nm thick layer (Fig. 5(e)), the vortex core points in the direction of the electron path and the magnetic phase shift is only due to the rotating component of the vortex at the origin of the observed circular shape. In the tilted 35 nm thick layer (Fig. 5 (d)), the electrons travel slightly across the plane of the layer allowing recovering a small part of the rotating components of the vortex. Therefore, the only possibility to diffrentiate between both states is to measure the amplitude of the corresponding phase shift at particular points, which is very different as shown in Fig. 5(f). This example demonstrates the importance of the quantitative analysis of the MPSI in order to determine the exact magnetic configurations.
9
Figure 5. MPSI of different magnetic states for the electron path along the y direction. (a) MPSI for
three layers with uniform IP states with an antiparallel coupling (AP state). The layers are 20 nm thick and their diameter is 70 nm. (b-e) MPSI images calculated for a magnetic vortex state observed in four different layers with different orientations and thicknesses. The diameter of the layers is 84 nm. The thickness of the layers is 30 nm for (b) and (c), 35 nm for (d) and 55 nm for (d). (b) Orientation of the layer as expected perpendicular to the NC axis (corresponding to z). Layers tilted around the y (c) and x (d) axis. (e) Layer of 55 nm thickness not tilted showing a vortex with the core pointing in the y direction (VIP state). f) Phase shift amplitude at the positions defined by the colored dotted line in d) and e). The white dotted boxes in the MPSI are guide for the eyes and correspond to the contours of the Co layers.
V.
Magnetic properties of multi-layersThe situation is, of course, more complex in multilayered systems where Co layers can magnetically interact through dipolar field. In reference 22, we have studied the remnant magnetic states in Co25 nm/Cu15 nm multilayers. We found that whatever the direction of Hs, about 70% of the layers showed the
IP state leading to an antiparallel coupling (AP state) of the magnetization from one layer to the other such as in Fig. 5(a). For Hs applied parallel to the NC axis, we observed a change of the magnetic
configuration from AP to VOP states for only about 20% of the Co layers. Such transition in multilayers was quantitatively simulated with the set of parameters used to calculate the phase diagram of Fig. 4(a) and (c) (see white arrows). For thicknesses around 25 nm, such transitions are not allowed in a single layer as the VOP state is stable. This demonstrates that the inter-layer dipolar coupling in a multilayered system with thin non-magnetic spacer such as Co25 nm/Cu15 nm favours the IP states with an antiparallel
coupling of the magnetizations (AP state). Another demonstration of the importance of the inter-layer coupling was the observation in some rare cases of the OP state in Co25 nm/Cu15 nm multilayers for NCs
with a diameter of about 70-80 nm. Such configurations were reproduced in the simulation of multilayers considering θk < 20° in each layer and Ku ≈ 200 .103 J/m3 but was impossible to recover in a single layer.
A. Co25 nm/Cu45 nm multilayered nanocylinders
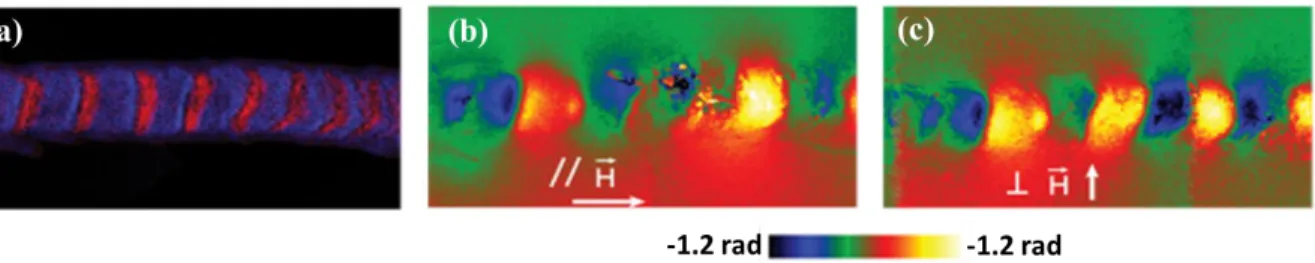
In the present article, we have first studied Co25 nm/Cu45 nm multilayers to investigate the effect of the
dipolar coupling. In these NCs, we did not observe any effect of the direction of Hs on the remnant state.
This can be seen in Fig. 6 showing the MPSI obtained at remanence in a NC with a diameter of about 80 nm. In particular, we did not find neither the AP to VOP transition nor the OP state. The reduction of the interlayer dipolar coupling with respect to the Co25 nm/Cu15 n m multilayers is accounted for
explaining this difference with the Co25 n m/Cu15 nm multilayers. Indeed, micromagnetic calculations
performed on two 25 nm thick Co layers with a 45 nm spacer (Cu thickness) show that the dipolar coupling energy in the AP state is roughly divided by 3 as compared to a 15 nm spacer. Let’s note that for such Cu thickness, the 1/r3 dependence of the dipolar energy is not recovered as the “punctual
magnetic dipole” approximation does not hold. Therefore, the dipolar coupling is no longer sufficient to stabilize the OP state, or to favor the transition between AP to VOP states. However, as experimentally observed, the magnetization is not randomly distributed in the Co layer plane proving that the dipolar coupling is still sufficient to induce the AP configuration between layers.
Figure 6. (a) EFTEM image of a 80 +/- 2 nm diameter Co25 nm/Cu45 nm nanocylinder showing the copper (blue) and cobalt (red) layers. MPSI at remanence after 1 Tesla saturation field applied parallel (b) or perpendicular (c) to the wire axis.
10
Therefore, in this system, we can assume that the magnetic behaviour of the layers is mainly governed by the shape and magnetocrystalline anisotropies. Also, information on the direction of Hk in
the individual layer has to be recovered using the phase diagram of Fig. 4. Typical magnetic configurations encountered in this set of samples are shown in Fig. 7. We noticed that AP and VOP states can coexist in the same NC depending on the position in the wire. For both experimental MPSI in Fig. 7 obtained on 80 nm diameter NCs, we performed micromagnetic simulations to reproduce the corresponding AP and VOP states qualitatively and quantitatively, allowing to differentiate them. For example, while the MPSI in Fig. 7(c) seems to present only AP states, our micromagnetic analysis shows that a canted vortex is visible in the second Co layers. Such feature appears for isolated vortices for which the core is not centered in the middle of the layer because of the stray field of surrounding layers. Therefore, the averaged component of the magnetization in the x direction is non-null (the component of the vortex in the + x and – x directions does not fully compensate each other) leading to the measured phase shift profile.
In Fig. 7(d), we recover a situation similar to the case of Fig. 5(c), i.e. a VOP states in layers slightly tilted around the x axis (about 10°). Then, the vortices appear as a rather circular shape in the MPSI. Simulations performed on 20 layers show that the VOP configurations are reproduced only if θk ≤ 20°
with an amplitude of at least 130. 103 J/m3. This result is in good agreement with simulations performed
on a single layer, which show that the lower limit value of Ku to obtain the VIP state for each direction
of Hs is about 100. 103 J/m3 (not sown here). To obtain the AP states, it is sufficient that θk ≥ 20°
whatever the amplitude of Ku.
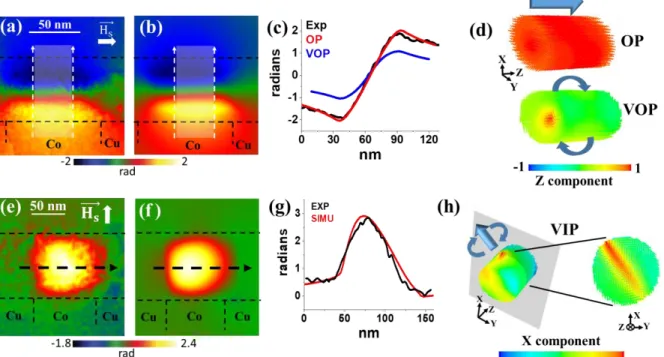
Figure 7. (a,b) EFTEM image of two Co25 nm/Cu45 nm NCs with a diameter of 80+/- 2 nm. Experimental (c,d) and simulated (e,f) MPSI of the nanocylinders for Hs applied perpendicular to the wire axis. (g)
Experimental and simulated MPSI amplitudes at the position denoted by the white arrow in (c) and (e). (h) Experimental and simulated MPSI amplitudes at the position denoted by the white arrow in (d) and (f). (i,j) Corresponding 3D magnetic states in each Co layer.
Statistical analysis performed on more than 50 layers from different wires allows estimating that the AP configuration appears in about 60 % of the layers and VOP state in about 40%. This result is quite surprising if we consider that the remnant states of each layer are governed by their intrinsic properties. Indeed, the average magnetocrystalline anisotropy should be randomly distributed from one Co layer to the other to reflect the random orientation of the polycrystals. This should favors the AP and IP states. To highlight this point, we performed micromagnetic simulations of the remnant state in a single layer with a diameter of 72 nm and a thickness of 24 nm as a function of Ku and θk. The results
11
states are stable whatever the direction of Hs only if the anisotropy direction is close to the normal of
the layer plane. However, the layers we observed can show small change of thickness, orientation and even intrinsic magnetic parameters (Ms, A) due to local variations of the Cu impurities leading to different remnant states. But our observations suggest a preferential orientation of the magnetic anisotropy of Co layers along the NC axis in this system.
13
Figure 8. Phase diagrams as a function of Ku and θk for Hs applied perpendicular (θ=10°, left column) or parallel (θ=80°, right column) to the plane of the layer. The thickness (t) and diameter (ϕ) of the layer is given above the diagrams.The layer is tilted by 15° and 5° around the y and x axis respectively. The color code is the same as in Fig. 5 and the different states are reminded at the bottom of the Figure.
B. Co50 nm/Cu50 nm multilayered nanocylinders
The study of Co50 nm/Cu50 nm multilayered nanocylinders allowed us to investigate the effect of the
aspect ratio. As compared to the 25 nm/15 nm case, the Co layers present an aspect ratio multiplied by two while micromagnetic calculations show that the dipolar coupling energy is roughly constant (≈ 20 % lower than the 25 nm/15 nm case) in the AP state. Once again, no modification of the remnant states with the direction of Hs is observed. A typical feature of the different magnetic configurations
encountered in all wires is presented in Fig. 9 (images recorded on a 84 +/- 2 nm diameter NC). The EFTEM experiment shows that all layers present different apparent thickness and orientation, in agreement with the dispersion given in table 1. In order to recover the magnetic states of all layers, we performed micromagnetic simulations with individual set of structural and magnetic parameters for each of the 5 Co layers (see TABLE II). These remnant states have been simulated for Hs parallel to the wire
axis.
The qualitative and quantitative agreement between the experimental and simulated MPSI (Fig. 9 (b) and (d) respectively) allows to state that almost all layers present VOP states, even if the vortex cores are not always centered in the middle of the layer as shown in the 3D magnetic configuration in Fig. 9(f). The position of the cores is settled by the complex dipolar coupling between layers related to their variable orientations. This NC gives a clear example of the difficulty related to the 2D projection problem presented in Fig. 5. For instance, at first sight, the Co layer #4 should correspond to a thick layer (≈ 58 nm) with a VIP state (similar to Fig. 5(d)). However, we could not fit the experimental phase shift amplitude with this configuration without decreasing the amplitude of the magnetization and the exchange down to 800.103 A/m (µ
0MS 1T) and 12.10-12 J/m respectively. Such a strong difference with
the magnetic properties of the other layers is surprising for a thick layer. But a very good quantitative agreement with a VOP state is obtained using the magnetic parameters of neighbouring Co layers if considering that the layer is tilted around the x axis with an angle about 20°.
The presence of almost only VOP states is common to all studied NCs as only 2 IP states were observed over more than 50 layers investigated on different NCs. In particular, the IP state of the Co layer #1 in Fig. 9 was reproduced considering a much lower magnetization than for the other layers. This most probably comes from more Cu in the layer. This was confirmed by the EFTEM profile (not shown here). However, the phase shift amplitude is still about 20 % higher than in the experiment. This might be due to a wrong estimation of the diameter of this layer if this one is surrounded by some Cu.
In order to understand further the quasi-absence of IP states, we have performed micromagnetic simulations of the remnant state of a tilted single layer as a function of the Ku and θk. The diameter of
the layer is 84 nm and the thickness equal to 42 nm. The layer is tilted by 15° and 5° around the y and x axis respectively. As can be seen from Fig. 8(c) and (d), VOP states are expected whatever the direction of Hs only if Ku is weak (below 100.103 J/m3 in the geometry of Fig. 8. This result indicates an averaged
magnetocrystalline anisotropy weaker than the one of Co25 nm/Cu45 nm NCs, in good agreement with the
assumption that a thicker layer contains more grains and then a stronger averaging of Hk.
Finally, when the layers are tilted around x, information about the chirality of the vortices can be recovered as the component of the magnetization in the layer plane can be measured. For example, the chiralities of the vortices in the Co layers #3 and #4 are opposite (Fig. 9(f)) as shown by the blue to red contrast between the two layers. However, over all the nanocylinders studied, we did not find any clear tendency of a preferential chirality. This is due to the fact that the chirality is partially dependent on the relative angle between Hs and Hk directions with Hk being randomly distributed from one layer to the
other.
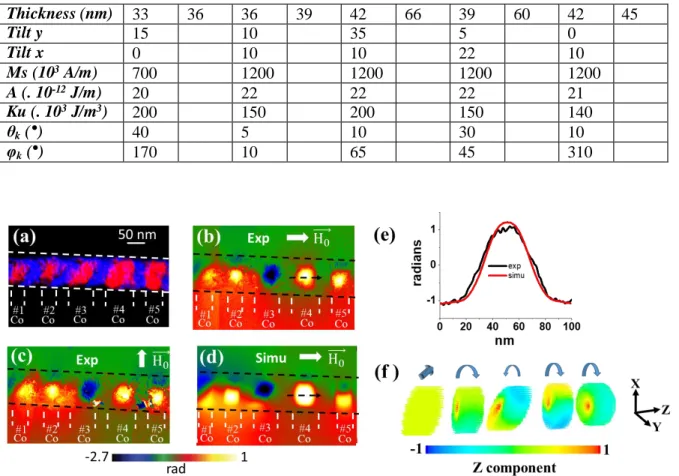
TABLE II: Structural and magnetic parameters for each layer in the simulation presented in Fig. 9 Co1 Cu1 Co2 Cu2 Co3 Cu3 Co4 Cu4 Co5 Cu5
14 Thickness (nm) 33 36 36 39 42 66 39 60 42 45 Tilt y 15 10 35 5 0 Tilt x 0 10 10 22 10 Ms (103 A/m) 700 1200 1200 1200 1200 A (. 10-12 J/m) 20 22 22 22 21 Ku (. 103 J/m3) 200 150 200 150 140 θk (°) 40 5 10 30 10 φk (°) 170 10 65 45 310
Figure 9: (a) EFTEM image of a 84 +/- 2 nm diameter Co50 nm/Cu50 nm nanocylinder. Experimental MPSI for Hs parallel (b) or perpendicular (c) to the wire axis and simulated MPSI (d) for Hs parallel to the
wire axis. (e) Experimental (black) and simulated (red) amplitude of the MPSI at the position denoted by the dotted arrow in (b) and (d). (f) Corresponding 3D magnetic state for the 5 Co layers.
C. Co100 nm/Cu100 nm multilayered nanocylinders
The last system we studied concerned Co100 nm/Cu100 nm NCs for which the aspect ratio is > 1. Fig.
10 shows the two types of magnetic configurations we observed in different NCs, whatever the direction of Hs. The NCs presented at the top and bottom of Fig. 10 have diameters of 60 and 90 nm respectively.
In the first case (60 nm diameter), the MPSI shows a uniform feature inside the layer. This distribution of isophase lines is expected in the case of a vortex state with the core aligned in the direction of the NC axis (VOP state) or if the magnetization is uniformly parallel to the NC axis (OP state). The comparison between the experimental and simulated amplitudes calculated for either the OP or the VOP states demonstrates that this magnetic configuration corresponds to the OP state. The best quantitative agreement between experimental and simulated data has been achieved with Ms, A and Ku equal to
1100.103 A/m, 22.10-12 J/m, 130.103 J/m3 as magnetic parameters. The anisotropy is randomly
distributed from one layer to the other within a cone centred on n with an aperture angle θk = 10°.
The MPSI of the second nanocylinder presenting the largest diameter (90nm) shows a circular shape, typical of VIP state such as in Fig. 5(d). This has been confirmed by our simulation on 20 layers for which the best quantitative agreement corresponds to a vortex core in the xy plane, roughly at 45° from the y axis. The simulation parameters are the same than previously. The layers have been tilted around the y axis by 5° only. For such a large thickness, the central part of the layer shows a cylindrical symmetry and only the surfaces are still tilted. Therefore, the potential problem of the orientation of the Co layer, as discussed in Fig. 9, in the understanding of the remnant state in the MPSI does not interfere. However, tilted surfaces still play a role as they favor the nucleation of vortex states.
We only observed the OP state in the studied NCs with diameters ranging between 50 to 70 nm. To understand this observation, we have then calculated the phase diagram as a function of Ku and θk for a
15
Co layer with diameter and thickness of 72 nm and 99 nm respectively. The results are shown in Fig. 8(e) and (f). Let’s note that in this thickness range, the boundaries between the different regions of the diagrams vary rapidly with the diameter of the layer. However, some tendencies can be obtained. First, it appears that OP or VIP states are stable whatever the direction of Hs only if the direction of Hk is close
to the normal of the surface (θk = 10°). The difference in the occurrence of each state is therefore related
to the Ku value. The VIP state seems to be a transient state between the VOP and OP states. For example,
for the particular aspect ratio of Fig. 8(e) and (f), the OP state is stable for high values (> 100.103 J/m3)
of Ku. In this case, the magnetocrystalline energy counter-balance the cost in dipolar energy. When
decreasing the value of Ku, the magnetization has to adopt a vortex structure to decrease the dipolar
energy. The core of the vortex aligns perpendicularly to Hk in order to minimize the magnetocrystalline
energy as most of the magnetic volume is kept aligned with Hk.
Based on Fig. 8(e) and (f), we could expect to observe more VOP and VIP states in Co100 n m/Cu100 nm NCs as the thick Co layers exhibit more grains, resulting in lower Ku values due to the random
distribution of the grains. As already mentioned, we observed the opposite case for NCs with diameters between 50 and 70 nm. To understand this discrepancy between the single layer and the multilayer systems, we performed simulations on 20 Co100 n m/Cu100 nm layers of 60 nm diameter. For each layer, Hk
is randomly distributed in a cone centred on n and with an aperture angle θk of 10° or 80°. In the absence
of crystal anisotropy (Ku = 0), the VOP state is the most stable configuration for all layers whatever Hs.
For θk = 80° and Ku ≠ 0, VOP states are still stable for both direction of Hs. However, the OP state
becomes the most stable configuration whatever the direction of Hs as soon as values of Ku as low as
50.103 J/m3 with θ
k close from n are used. This is partially in agreement with the single phase diagram.
The main differences are first the reduction of the value of Ku to recover the OP state and second the
fact that we did not observe anymore the creation of VIP states stable for both directions of Hs in the
multilayered structure. The explanation relies on the strong interlayer dipolar coupling which favors the alignment of the magnetization along the NC axis to reduce the dipolar energy. These simulations on multilayers are then in good agreement with the assumption of weak Ku values for very thick layers, for
which the shape anisotropy and interlayer coupling stabilize the OP states. However, further investigation and statistics on these systems are required to state on this point.
Figure 10: Experimental (a) and simulated (b) MPSI for a Co100 nm/Cu100 n m nanocylinder with diameter
60 nm. (c) Phase shift amplitude averaged in the shaded area shown in (a) and (b). The blue curve corresponds to the phase shift amplitude for a VOP state with the same qualitative MPSI. (d) 3D magnetic representation of the OP state corresponding to (b) and the VOP state used to calculate the MPSI amplitude shown in (c). Experimental (e) and simulated (f) MPSI for a Co100 nm/Cu100 n m
16
in e) and f). h) 3D magnetic representation of the VOP state with the core of the vortex pointing in the xy plane. The figure at the right is a projection of the grey cut plane shown in the left figure.
VI.
ConclusionCo/Cu multilayered nanocylinders have been grown by electrodeposition in commercial polycarbonate membranes. We developed a methodology to study with a spatial resolution of few nanometers the magnetic states of these systems. To achieve this we have combined electron holography, structural and chemical TEM studies with micromagnetic simulations. Simulations of the phase diagram of the remnant magnetic states of a single layer predicted four possible magnetic states depending on the aspect ratio of the layer, the application of a saturation field and the direction of magnetocrystalline anisotropy. The magnetization can be either uniform within the layer or adopt a vortex structure with different orientation of the core. Such variations of magnetic states can be observed because of the low values of the Co magnetic constants with respect to bulk, typical of el ectrodeposition process in a single bath.
We observed all these states by studying nanocylinders with different aspect ratios of the Co and Cu layers. We demonstrated that information on the crystal anisotropy, and then potentially on the local structure of the Co layers, can be recovered by applying a saturation magnetic field in different directions. Our observation seems to prove that the amplitude of the magnetocrystalline anisotropy decreases when increasing the thickness of the Co layer, in agreement with an averaging due to the random distribution of the crystallographic grains. However, the interlayer dipolar coupling can strongly modify the remnant state of a system as compared to the case of a single layer. For instance, we demonstrated that an antiparallel coupling of uniform states in very thin Co layers is favored, even for Cu thickness up to 40 nm. But in a very thick layers with aspect ratio close to 1, the dipolar coupling stabilizes the magnetization along the direction of the NC axis.
While electrodeposited nanocylinders are a nice playground for fundamental studies because of the wide variety of states, their use for potential applications requires further co ntrol of the structural properties of the layers. As an example, we often observed different configurations within the same nanocylinder due to the local variations of geometry and/or chemical composition. This might be a problem for applications such as spin torque oscillators. Indeed, the geometry and chemical composition of the layers must be the same for all layers in order to ensure the same resonance frequency, precession amplitude and to allow phase locking between layers. Several strategies could be tested. To reduce the dispersion in the layer geometry, different templates should be tested such as porous alumina membranes which are known to have a small dispersion of the diameter along the pore and reduced roughness as compared to polycarbonate. For single bath deposition, the concentration of the normal metal to deposi t has to be as low as possible to reduce interdiffusion and co-deposition into the ferromagnetic material. Finally, we also discussed experimental difficulties to discriminate between different magnetic states when observed by electron holography due to the uncertainty in the real geometry of the layers. 3D tomography is a solution to solve this problem34, allowing at the same time a much better
determination of the magnetic constants of the layers.
VII.
AcknowledgmentsThis work was performed using HPC resources from CALMIP (Grant 2018-[1428-1554]). We acknowledge the French National Research Agency under the "Investissement d'Avenir" program reference No. ANR-10-EQPX-38-01" and No. 11-IDEX-0002, the "Conseil Regional Midi-Pyrénées" and the European FEDER for financial support within the CPER program. This work was also supported by the international associated laboratory M²OZART.
17
1 A. Fernandez-Pacheco, R. Streubel, O. Fruchart, R. Hertel, P. Fischer and R. P. Cowburn, Nature Communications 8, 15756 (2017).
2 R. Hertel, J. Phys.: Condens. Matter 28, 483002 (2016).
3 Parkin S. S. P., Hayashi M. and Thomas L., Science, 320, 190 (2008). 4 N. Biziere, E. Murè and J.-Ph. Ansermet, Phys. Rev. B., 79, 012404 (2009). 5 F. Abreu Araujo and L. Piraux, SPIN, 7, 1740007 (2007).
6 T. Bohnert, A. C. Niemann, A-K. Michel, S. Babler, J. Gooth, B. G. Toth, K. Neurohr, L. Peter, I. Bakonyi, V. Vega, V. M. Prida and K. Nielsch, Physical Review B, 90, 165416 (2014).
7 M. Krawczyk and D. Grundler, Journal of Physics: Condensed Matter, 26, 123202 (2014).
8 Y. P. Ivanov, L. G. Vivas, A. Asenjo, A. Chuvilin, O. Chubykalo-fesenko and M. Vázquez, Europhys. Lett., 102, 17009 (2013).
9 Y. P. Ivanov, A. Chuvilin, S. Lopatin and J. Kosel, ACS Nano, 10, 5326 (2016).
10 A. Akhtari-Zavareh, L. P. Carignan, A. Yelon, D. Ménard, T. Kasama, R. Herring, R. E. Dunin-Borkowski, M. R. McCartney and K. L. Kavanagh, J. Appl. Phys., 116, 023902 (2014).
11 Y. Henry, K. Ounadjela, L. Piraux, S. Dubois, J.-M. George and J.-L. Duvail, Eur. Phys. J. B - Condens. Matter Complex Syst., 20, 35 (2001).
12 L. G. Vivas, J. Escrig, D. G. Trabada, G. A. Badini-Confalonieri and M. Vázquez, Appl. Phys. Lett., 100, 252405 (2012).
13 J. Cantu-Valle, I. Betancourt, J. E. Sanchez, F. Ruiz-Zepeda, M. M. Maqableh, F. Mendoza-Santoyo, B. J. H. Stadler and A. Ponce, J. Appl. Phys., 118, 24302 (2015).
14 J. Cantu-Valle, E. D. Barriga-Castro, V. Vega, J. García, R. Mendoza-Reséndez, C. Luna, V. M. Prida, K. Nielsch, F. Mendoza-Santoyo, M. Jose-Yacaman and A. Ponce, J. Magn. Magn. Mater., 379, 294 (2015).
15 H. Schlorb et al., Phys. Status Solidi B, 247, 2364 (2010). 16 L. A. Rodríguez et al., ACS Nano, 10, 9669 (2016).
17 S. Zsurzsa, E. Pellicer, J. Sort, L. Peter and I. Bakonyi, Journal of The Electrochemical Society, 165, D536 (2018).
18
18 F. S. Fedorov, I. Monch, C. Mickel, K. Tschulik, B. Zhao, M. Uhlemann, A. Gebert and Jurgen Eckerta, Journal of The Electrochemical Society, 160, D13 (2013).
19 C. Beeli, B. Doudin, J. -Ph. Ansermet, and P. Stadelmann. Journal of Magnetism and Magnetic Materials 164, 77, (1996).
20 C. Beeli, B. Doudin, J. P. Ansermet, and P. A. Stadelmann, Ultramicroscopy 67, 143 (1997). 21 Azadeh Akhtari-Zavareh, , L. P. Carignan, A. Yelon, D. Ménard, T. Kasama, R. Herring, R. E. Dunin-Borkowski, M. R. McCartney, and K. L. Kavanagh. Journal of Applied Physics 116, 023902, 2014. 22 D. Reyes, N. Biziere, B. Warot-Fonrose, T. Wade, and C. Gatel, Nanoletters, 16, 1230 (2016). 23 J. Verbeeck, D. Van Dyck, and G. Van Tendeloo, 59, 1529 (2004).
24 K. Harada, A. Tonomura, Y. Togawa, T. Akashi, and T. Matsuda, Appl. Phys. Lett., 84, 3229 (2004). 25 M. J. Donahue and D. G. Porter, “OOMMF User’s Guide, Version 1.0, Interagency Report NISTIR 6376.” (1999).
26 M. Darques et al., J. Phys. Appl. Phys., 39, 5025 (2006).
27 M. Almasi Kashi, A. Ramazani, F. A. Najafabadi, and Z. Heydari, Appl. Surf. Sci., 257, 9347 (2011). 28 M. T. Bryan, S. Bance, J. Dean, T. Schrefl, and D. A. Allwood, J. Phys. Condens. Matter, 24, 24205 (2012).
29 I. Chlebny, B. Doudin, and J.-P. Ansermet, Nanostructured Mater., 2, 637 (1993). 30 C. Schönenberger et al., J. Phys. Chem. B, 101, 5497 (1997).
31 D. Pullini, G. Innocenti, D. Busquets, and A. Ruotolo, Appl. Phys. Lett., 90, 133106 (2007). 32 J.-L. Maurice et al., J. Magn. Magn. Mater., 184, 1 (1998).
33 V. Scarani, B. Doudin, and J.-P. Ansermet, J. Magn. Magn. Mater., 205, 241 (1999).
34 A. Lubk, D. Wolf, P. Simon, C. Wang, S. Sturm, and C. Felser, Appl. Phys. Lett., 105, 173110 (2014).