HAL Id: hal-00301579
https://hal.archives-ouvertes.fr/hal-00301579
Submitted on 1 Jan 2001
HAL is a multi-disciplinary open access
archive for the deposit and dissemination of
sci-entific research documents, whether they are
pub-lished or not. The documents may come from
teaching and research institutions in France or
abroad, or from public or private research centers.
L’archive ouverte pluridisciplinaire HAL, est
destinée au dépôt et à la diffusion de documents
scientifiques de niveau recherche, publiés ou non,
émanant des établissements d’enseignement et de
recherche français ou étrangers, des laboratoires
publics ou privés.
Electromagnetic-wave radiation due to diastrophism of
magma dike growth in Izu-Miyake volcanic eruptions in
Japan in 2000
M. Hata, I. Takumi, H. Yasukawa
To cite this version:
M. Hata, I. Takumi, H. Yasukawa. Electromagnetic-wave radiation due to diastrophism of magma
dike growth in Izu-Miyake volcanic eruptions in Japan in 2000. Natural Hazards and Earth System
Science, Copernicus Publications on behalf of the European Geosciences Union, 2001, 1 (1/2),
pp.43-51. �hal-00301579�
Natural Hazards and Earth System Sciences (2001) 1: 43–51 c
European Geophysical Society 2001
Natural Hazards
and Earth
System Sciences
Electromagnetic-wave radiation due to diastrophism of magma dike
growth in Izu-Miyake volcanic eruptions in Japan in 2000
M. Hata1, I. Takumi2, and H. Yasukawa1
1Aichi Prefectural University, Nagakute, Aichi 480-1198, Japan 2Nagoya Institute of Technology, Nagoya 466-8555, Japan
Received: 28 August 2000 – Revised: 15 September 2000 – Accepted: 30 September 2000
Abstract. A large 10 cm per day diastrophism of the crust
was experienced between Kozu and Niijima Islands during the Izu-Miyake volcanic eruptions in Japan on 3–4 August 2000. The diastrophism was detected through GPS obser-vation. The seismometer also complied a swarm of earth-quakes at this time. Our electromagnetic wave data, observed at 223 Hz at the Omaezaki site, about 110 km and 150 km northwest of the Kozu and Miyake Islands, respectively, de-tected a clear, anomalous magnetic flux radiation that corre-sponded well with the seismographic and GPS data. Similar radiation was received for about one week preceding the big volcanic eruption that occurred on 18 August 2000. These observations indicate that the electromagnetic wave monitor-ing system has the potential to monitor and/or warn of vol-canic activity, and the facts disclose one of the mysterious ra-diation mechanisms of electromagnetic waves emitted from the Earth.
1 Introduction
In recent years, electromagnetic wave radiation, in the case of volcanic activity and preceding earthquakes, has attracted great interest around the world. Only a limited number of papers have been presented on electromagnetic wave radia-tion due to volcanic erupradia-tions. To study the electromagnetic induction and radiation which takes place during a swarm of earthquakes and volcanic eruptions, we have been conduct-ing electromagnetic observations for a swarm of earthquakes that occurred in Itoh-city, Shizuoka, central Japan, in 1989 (Hata, Yabashi, 1994). These were followed by eruptions in Unzen in Nagasaki prefecture on Kyushu Island, west-ern Japan, which took place from 1991 to 1995 (Hata et al., 1998), and more recently, the eruption that occurred on Izu-Miyake Island, central Japan, in the summer of 2000.
The most important aspect of electromagnetic wave obser-vation of volcanic and earthquake activities was the
develop-Correspondence to: M. Hata ([email protected])
ment of a receiver with a high sensitivity capable of picking up weak radiation by eliminating atmospheric radio waves, lightning and manmade noise. For that purpose, selection of the observation frequency was the dominant issue. Below the ULF band of less than 10 Hz, atmospheric radio waves due to magnetospheric and ionospheric perturbations were predom-inant, and above the VLF band exceeding 300 Hz, lightening noise was fatal. Therefore, we selected the extremely low frequency (ELF) band of 10–300 Hz as a window observa-tion frequency for observing volcanic and earthquake activi-ties. Furthermore, to reduce manmade noise, the observation frequency selected was the prime number of 223 Hz to the power line frequencies of 50 Hz and 60 Hz, with a narrow amplification bandwidth of less than 1 Hz. By making use of the highly sensitive electromagnetic wave receiver in the extremely low frequency band of 223 Hz, it was only pos-sible to detect electromagnetic radiation in the cases of the Itoh-city earthquake swarm and the eruption in Unsen (Hata et al., 1998).
At the time of the severe earthquake swarm in Itoh-city ac-companied by an undersea volcanic eruption just in front of the city on 13 July 1989, we started our first electromagnetic observation as a field trial for monitoring volcanic activities through the use of the electromagnetic method. Up to that time, trials for detecting earthquake precursors had been car-ried out in the Soviet Union, America and Japan (Gokhberg et al., 1982; Fraser-Smith et al., 1990; Fujinawa and Taka-hashi, 1990). With regard to earthquake swarms and volcanic eruptions, details were unavailable, and the magnitude and way of radiation were hardly known. The volcanic activities lasted for years, almost in the same area; in the case of Itoh-city, they occurred several times, every two years. There-fore, from a research standpoint, monitoring volcanic activ-ities provided a good opportunity to study and develop an observation method and apparatus. As a result, we were able to discover many relevancies between volcanic electromag-netic radiation and earthquakes. Electromagelectromag-netic radiation was primarily generated several months prior to the event and the earthquake swarms were followed by radiation. The
ra-44 M. Hata et al.: Electromagnetic-wave radiation
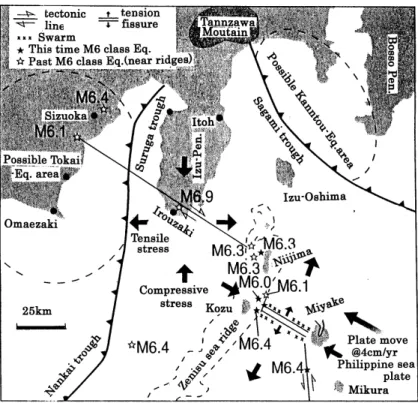
Fig. 1. The stages of the Miyaka
vol-canic eruption in the south central part of Japan.
diation amplitude of the magnetic flux density was small, of the order of pico Tesla (pT) per root Hz in the ELF band.
Observations in Unzen started in December 1991 and the receiver had a high sensitivity of 0.025 pT per root Hz for a 6 s integration time and 0.125 pT per root Hz for 150 s at the observation frequency of 223 Hz with a free-space wave-length of about 1300 km. The receiver consists of a three-axial loop coil antenna that is sensitive to magnetic fields. Magnetic field observation was much more stable than in the electric field due to the low wave impedance in the near field, i.e. the distance from the site to the volcano and/or earth-quake preparing area is generally set closer than the obser-vation wavelength. By the end of 1992, the volcano showed a clear decline in lava supply, a collapse of the dome and less frequent earthquakes, following severe activities for one and a half years from the time the first dome was formed on 20 May 1991. It was believed that the activity would cease by early 1993. Similarly, we detected decreasing ra-diation signals from the volcano. Therefore, we were able to clearly identify newly generated radiation due to new as-cending lava movement. At that time, our vertical magnetic sensor started to record small but clearly peculiar anoma-lies. Eventually, the anomalies were followed by the 10th and 11th dome formations about 40 and 75 days later, re-spectively. The time difference between the anomalies and the dome formation corresponded well with the passing time of lava at the summit. There were no other remarkable activi-ties during the period until the dome formation. About 800 m below, it was confirmed that an aquifer about one kilometer thick was present and the ascending speed of the magma was estimated to be approximately 20 m per day after passing the
aquifer (Kagiyama, et al. 1995). The anomalous radiation was considered to correspond with the passage of magma across the aquifer zone. We assumed that the vertical flux anomaly was due to a conductivity anomaly of rock distor-tion propagated at a measuring spot 4.5 km away from the center by the penetration of magma (Hata et al., 1998).
In this paper, we discuss the related electromagnetic (EM) wave radiation with volcanic activity that might be generated by crust distortion on the diastrophism, which occurred dur-ing the Miyake eruptions in Japan in the summer of 2000. The radiation was analyzed through the differences in the radiation amplitudes among the three-axial magnetic fluxes, and through the differences in radiation patterns obtained at the 14 observation sites that were setup on the central main island of Japan. Furthermore, consideration was given to the detailed correspondence of the radiation with each phase of the volcanic activity, such as volcano top depression, dias-trophism of the islands and the eruption.
2 Description of the Izu-Miyake eruption
In 2000, Japan experienced big volcanic eruptions, one on Mt. Usu in Hokkaido in northern Japan in the spring, and an-other on the Izu-Miyake Island in central Japan in the sum-mer, as well as a big M7.3 earthquake in West-Tottori in western Japan on 6 October.
A swarm of volcanic earthquakes due to ascending magma suddenly started on the Miyake Islands at about 18:30 JST on 26 June 2000. At that time, volcanists and geologists were very anxious about the possibility of an eruption, since the last eruption, which occurred in 1983, happened just after a
M. Hata et al.: Electromagnetic-wave radiation 45 swarm lasting only two to three hours. This time, however,
the magma, which had ascended and penetrated the west side of the mountain on the night of 26 June, shifted to the west sea area of the Miyake Islands without surfacing on or af-ter 27 June. On the morning of 27 June, an undersea erup-tion occurred on the west shore, 1.2 km away from the is-lands, which quickly flowed from the volcano and entered the dike which extends between Miyake and Kozu Islands, about 30 km northwest of Miyake. These magma activities were fairly clearly observed by the focus movements of the swarms, decline-meter indications and through GPS observa-tions that were jointly conducted with the Japanese govern-ment and university groups (JMA 2000; Sasai et al., 2001). Figure 1 shows the stages of the Miyake volcanic eruption in south-central Japan. The figure, originally shown by Mizoue (2001), indicates the reference chart of the trough, dike, tec-tonic line, swarm and earthquakes exceeding M6.0 that were experienced in the past, as well as this time.
Observing the fact that the magma first started to flow in some way into the dike from the Miyake Islands, many re-searchers expected at the early stage of the volcanic activity that the volcanic eruption would not take place. The expec-tation turned out to be true, even though the Miyake volcano would eventually erupt.
The magma flow then reached the Zenisu Sea ridge and stopped there, and the first large M6.4 earthquake occurred near the Kozu Islands on 1 July, which was one of five large earthquakes exceeding M6.0 resulting from the activities.
After the earthquakes on 1 July, the phase of the Miyake volcano changed. On 8 July, the first depression on top of the volcano on Mt. Oyama on the Miyake Islands suddenly appeared, and a more than 500 m in diameter, and 200 m in deep crater was formed in a single day. After the depres-sion was formed, frequent phreatic explodepres-sions occurred. The crater grew to 1500 m in diameter and 450 m in depth within one month and finally to the size of the caldera. Volcanic ash and cinders covered all the entire islands; however, the to-tal quantity of extrusive ash and cinders was estimated to be less than 10% of the total depression volume. The depression volume has generally been based on the extrusion volume of the magma, but this proved not to be true. Therefore, this mysterious volume has been eagerly discussed. It was as-sumed that the serious activities that resulted in the eruption started after the depression was formed. The magma supply continued after the depression was formed and the thickness of the dike grew, accompanied by a considerable number of earthquakes. Particularly during the afternoon of 3 August to the morning of 4 August, the distance between the Kozu and Nijima Islands was confirmed through GPS positioning to have separated by 10 cm within one day, with the distance finally extending to about 60 cm on 13 August. The cause was estimated by Dr. Yamaoka to be due to the gradual plas-tic zone displacement of the crust between the islands. The dissipated energy is estimated to have been equivalent to a big M7 earthquake (Yamaoka et al., 2001).
Without a definite insight into the movements of the vol-cano during the period from the middle of July to August,
the areas affected widened and things became serious. The course of the volcano could not be estimated, but the situa-tion was definitely progressing toward an erupsitua-tion.
Finally, a sign of severe magma activity of the Miyake vol-cano was revealed when an 8000 m high smoke explosion occurred on 18 August 2000. All inhabitants of the Miyake Islands were forced to evacuate and were still unable to re-turn home as of the end of April 2001 (JMA, 2000).
3 Electromagnetic wave observation system
A three-axial tuned solenoid coil antenna with a diameter of about 45 cm and 7000 turns, was set up about 2 m high for the horizontal magnetic flux and 30 cm above the ground for the vertical flux. The observation frequency selected was 223 Hz in the ELF (extremely low frequency) band of 30–300 Hz. The reason for this was that unstable, misleading noise be-comes extremely low in the ELF band compared with the ULF band of less than several tens of Hz. The principal noise originated in the amplitude spectrum for geomagnetic varia-tions resulting from the magnetosphere and ionosphere. In the ELF band, atmospherics are the principal noise with an amplitude of the order of pT per root Hz, and for the ULF band, pulsations are dominant at several tens of nT per root Hz (Rokityanski, 1982). Furthermore, antenna moving noise produced by cutting geomagnetism due to wind vibration of the antenna coil becomes quite low in the ELF band com-pared with the ULF band. The vibration frequency of the antenna supported in the vertical direction is generally in the range of 6–15 Hz. For example, suppose the antenna at rest causes a d-inch deflection of its supporting springs; the nat-ural oscillation frequency f o of the antenna, when damping is neglected, is given by f o = 3.13/root d. For d = 0.25-inch, then f o = 6.26 Hz, which is in the ULF band (Ref-erence Data 939, 1956). In addition, the receiver fluctuat-ing noise power of the top amplifier is inversely proportional to the frequency (1/f noise) at the low frequency bands of ELF and ULF. Therefore, the receiver noise is much more decreased in the ELF band than in the ULF band (Reference Data 496, 1956). On the other hand, at higher frequencies exceeding 1000 Hz in the VLF (very low frequency) band of 300 Hz to 3 kHz, lightning and manmade noise increase severely, so much so that the source is more liable to radiate at shorter wavelengths. Furthermore, in order to decrease the manmade noise, the observation frequency was set at 223 Hz in the ELF band, which was the prime commercial power line frequency of 50 Hz and 60 Hz, so as to eliminate high-order interaction noise produced by the nonlinearity of the power systems. The selected bandwidth of the receiver was narrow at about 1 Hz to remove the noise spectrum.
Since the wavelength of 223 Hz is about 1300 km, the propagated noise components of that frequency hardly exist inside the narrow parallel plate waveguide, consisting of the conductive ground and the ionosphere to a height of 60 km to 250 km, thus forming D and E layers.
46 M. Hata et al.: Electromagnetic-wave radiation
Fig. 2. Diastrophism observed by VLBI measurement conducted
by the Communication Research Laboratory, Japan on the baseline between Kasima and Tateyama for a distance of about 130 km.
The electron density of the D layer is high in the daytime and the height is also as low as 60 km to 80 km. However, the density becomes very low at night and the height increases. Therefore, the noise of tropical thunder in the ELF band, with a long wavelength of about 1300 km, propagates with a low loss at night compared to the daytime.
The noise level with the daily change also shows seasonal changes. The lowest level in the winter is 0.5 to l, and 1.5 to 2.5 pico Tesla per root Hz in the summer.
The spectrum of the possible EM precursor also decreases generally at higher frequencies according to the generating mechanism. However, the noise-decreasing factor for vari-ous noise sources mentioned above was experimentally more rapid, so we could attain a high signal-to-noise power ratio for the precursory signal in the ELF band. We could say that the ELF band is a window frequency for precursor detection. We could attain a high sensitivity of one pico Tesla per root Hz at 223 Hz.
Over the years, our electromagnetic observation sites have been extended to over forty locations from Hokkaido in the north to Kyushu in the southwest. These sites are connected via public telephone lines to a central computer.
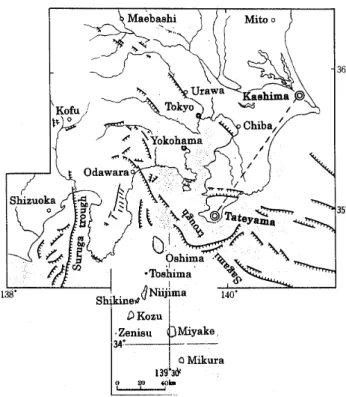
Fig. 3. Location map of the VLBI measurement set up at Kashima
and Tateyama in the central Japan. The base line is about 130 km in length and the extension line is almost on the enlargement line of the Kozu to Niijima Islands.
4 Diastrophism and EM radiation
4.1 Diastrophism observed by VLBI and GPS
The crust change of the diastrophism was monitored by a new measuring scheme, such as GPS and VLBI, very long baseline interferometers, which measure crust change using interferences from Quasar radio star signals, and observa-tions conducted by Japanese government projects.
Figure 2 shows the diastrophism observed by the VLBI measurement conducted by the Communication Research Laboratory, Japan, on the baseline between Kasima and Tateyama for a distance of about 130 km (Yoshino, http). The location of the VLBI measurement is shown in Fig. 3. The extension line of the baseline was almost on the enlargement line of the Kozu to the Niijima Islands. The data showed that the distance between Kashima and Tateyama simultane-ously shrunk at a high rate, exceeding the ordinal shrinking rate from the time the Miyake volcanic earthquake swarm started.
Figure 4 shows the detail of the diastrophism of the Izu-Miyake Islands, observed by GPS observation. The figure shows the movements of each island by the arrows and the di-rection of the diastrophism at that time instant of 12 Septem-ber 2000. As shown in Fig. 1, magma spewed from Miyake on 27 June, penetrating the dike between the Kozu and Ni-ijima Islands, and the M6.4 earthquakes occurred on 1 July in the sea area southeast of Kozu Island. The distance between
M. Hata et al.: Electromagnetic-wave radiation 47
Fig. 4. Detail of the diastrophism of Izu Islands observed by GPS
observation.
the Kozu and Niijima Islands was enlarged, but the other is-lands of Shikine, Miyake and Mikura were drawn together. Prior to the state of diastrophism shown in Fig. 4, the great enlargement of about 10 cm per day of the distance between Kozu and Niijima took place on 3 to 4 August according to GPS observation, and about 100 cm in total over a period of two and a half months.
4.2 EM radiation received on diastrophism
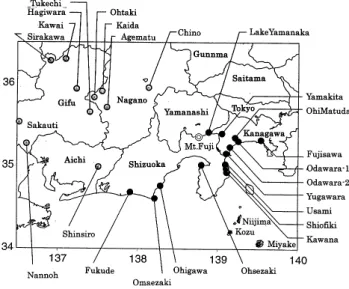
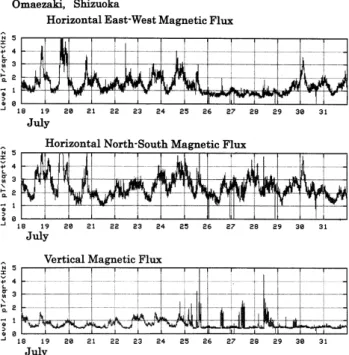
Figure 5 shows the arrangement of our observation sites in central Japan. The fourteen sites, marked by black circles were somewhat related to the EM radiation of the Miyake volcanic eruptions. The observed three-axial magnetic flux data of only two (Omaezaki, Sizuoka and Usami, Itoh-city) of the fourteen sites are shown in Figs. 6 and 7 for the three-month period from 7 June to 7 October, including the active period of June to August 2000. The records should be shown for a much longer period for comparison, and explained with all of the events that occurred at those sites in central Japan that experienced frequent, severe earthquakes and vol-canic activities in the neighboring areas, such as Shizuoka and West Kanagawa, and the Mts. Fuji and Hakone volcanic zones. For the above period, there were no other severe ac-tivities in the neighboring areas of the sites.
The Omaezaki spot, Fig. 6, clearly detected the vertical and north–south magnetic flux anomalous radiation in the case of the diastrophism. The Usami, Itoh-city site in Fig. 7, was cited as a reference for comparing the obtained data, al-though the site was not sensitive to the diastrophism. These two sites were located on the east and west sides of the Izu peninsula, roughly the same distances from the Izu Islands. As for the horizontal east–west and north–south magnetic fluxes of the two sites, the amplitude variations coincided fairly well with each other, although small gain differences
Fig. 5. Arrangement of observation sites in central Japan.
were recognized between the two sites. The sharp, large ra-diation that appeared in the horizontal magnetic fluxes that were non-existent in the vertical flux was due to a severe electrical storm that hit the Tokyo metropolitan area on 1 to 5 July. The radiation level was much stronger in Usami, Itoh-city than in Omaezaki, Sizuoka. This fact was due to the short distance from the Usami spot to the lightning strikes that hit the Tokyo area.
It should be remembered that the vertical lightening radia-tion from 1 to 5 July at Usami was small, approximately one-third of the horizontal radiation. The fact is generally correct for the horizontally propagated radiation waves. This is due to the Earth’s conductivity that works to suppress the vertical components by introducing a current inside the crust, which produces a reversing vertical flux. While the vertical lighten-ing radiation at the far Omaezaki site was hardly detected, the horizontally propagated lightening radiation quickly decayed with the distance, especially in the near field, within the dis-tance of the wavelength divided by 6.28. The disdis-tances be-tween the sites and the Tokyo area were about 100 km north-east for Usami and 200 km northnorth-east for Omaezaki, respec-tively. The same lightening radiation patterns were observed in the evening from 17 to 19 July. Bigger lightning radia-tion was again observed in the evening to nightfall from 4 to 9 August. The lightning on 4 August caused damage in the Tokyo metropolitan area with severe flooding.
The relationship between the strong lightning which lasted for five days and the volcanic activities was not clear, but any relationship was suspicious. As shown later, a big di-astrophism took place on the Kozu and Niijima Islands just before the heavy lightening on 4 August.
48 M. Hata et al.: Electromagnetic-wave radiation
Fig. 6. Three-axial magnetic flux data of Omaezaki, Shizuoka for the three-month period of 7 June to 7 September 2000. The flux density is
pico Tesla per root Hz in a 150 s integration.
Fig. 7. Three-axial magnetic flux data of Usami, Itoh-city for the three-month period of 7 June to 7 September 2000. The flux density is pico
Tesla per root Hz in a 150 s integration.
4.3 Correspondence of EM radiation with volcanic activi-ties
4.3.1 Daily change in vertical magnetic flux in the case of volcano depression
First, vertical radiation is discussed with respect to its rela-tionship with the seismograph and the activity of the Miyake volcano. The vertical magnetic flux corresponded well with the volcanic activities, since the vertical fluxes are generally not dependent on the propagated horizontal magnetic fluxes and they have a stable behaviour to the Earth’s conductivity. Therefore, the vertical fluxes are separated from the propa-gated horizontal turbulence components due to the near front genesis and far off tropical lightning radiation.
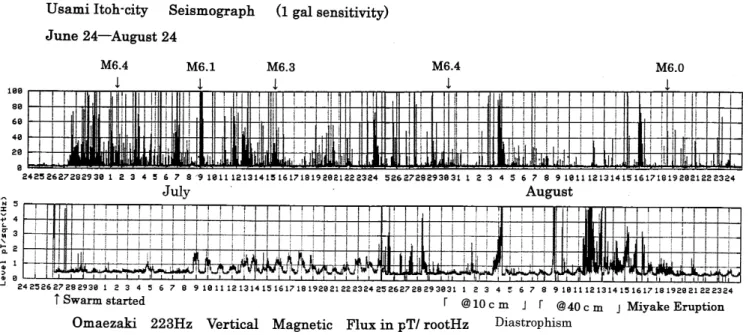
Figure 8 shows the correspondence between the observed
records of the seismograph taken at Usami, upper trace, and the vertical magnetic flux radiation observed at Omaezaki, lower trace. Our seismometer, which is part of a network system, was located only at the Usami spot. At the beginning of the swarm activities during the period from 26 June to 8 July, the seismograph picked up the activities at a distance of 110 km; however, the vertical magnetic flux radiation at the Omaezaki spot detected hardly any change. It is consid-ered that this was due to the fact that the initially propagated mechanical or electrical energy at the observation site from the volcano was too weak to produce EM radiation. Conse-quently, it was concluded that the direct radiation from the volcano was too small to be detected.
However, soon after the first big depression of the top of the volcano on Oyama of Miyake Islands occurred on 8 July, vertical radiation with a unique daily change began to appear.
M. Hata et al.: Electromagnetic-wave radiation 49
Fig. 8. Earthquakes and EM radiations for the event of the Miyaka Island Eruption during the summer of 2000.
Daily change is generally non-existent in vertical magnetic flux. It generally appears in the horizontal magnetic flux just like a background noise level change. The cause of the daily change in the horizontal magnetic flux was due to tropical storm noise propagating from the tropical thunderous zones of the east and south in the Pacific Ocean. The received level is dependent on the height of the ionosphere, consisting of a parallel plate transmission guide formed between the iono-sphere and the Earth. The lowest ionoiono-sphere, which is known as the D layer, is as low as 60 km–70 km in the daytime due to the ionization of the air by solar radiation, and becomes high or disappears at night. Therefore, the propagated hori-zontal magnetic flux is generally low in the daytime due to the high transmission loss and high at night.
On the other hand, the vertical magnetic flux does not show any daily change, because the propagated waves do not have any vertical magnetic components caused by the conductivity of the Earth, but instead have a perpendicular electric field and horizontal magnetic flux components. The propagation is known as zero-order transmission in cases where the wavelengths of the propagated signals are much longer than the width of the parallel guide.
However, vertical magnetic flux can exist where there is large-scale non-uniformity of the Earth’s conductivity with the size of the wavelength. Another case is the presence of an Earth current generating a vertical magnetic flux. When the Earth’s conductivity changes anomalously along the propa-gating path, the propapropa-gating vertical electric field and the horizontal magnetic flux stagger along the anomalous zone and produce orthogonal components of the original as the horizontal electric field and the vertical magnetic flux com-ponents. This fact is well-known in EM wave theory (Wait, 1970). Therefore, the propagated tropical thunder noise could produce a vertical magnetic flux component with a
daily change. Therefore, the appearance of vertical magnetic flux with a daily change could mean a conductivity anomaly along the propagation path. This fact could show that the conductivity anomaly extends over a wide area of the Earth surrounding the volcano due to unbalanced gravity stresses or some other factors as in the case of the formation of a crater on the Miyake Islands.
4.3.2 Spike-like vertical radiation in case of crust enlarge-ment
Other than the appearance of the vertical daily change, the radiation phases of the vertical magnetic flux changed again from 24 to 25 July. The daily change disappeared at that time and a new phase of sharp, spike-like radiation appeared and lasted until the big volcanic eruption occurred on 18 Au-gust. The transitional phases of the vertical magnetic flux for 25–29 July are shown in Fig. 9. The phases correspond to the simultaneous decrease in the horizontal east–west mag-netic flux, which means the cancellation of the orthogonal component produced by the conductivity anomaly. The new volcanic event was a diastrophism, which occurred on 3–4 August, ten days after the vertical radiation phase changed. The diastrophism caused a large enlargement of the distance between the Koze and Niijima Islands. As Fig. 9 shows, sim-ilar spike-like radiation preceded the big diastrophism which occurred on 3–4 August. Therefore, we could presume that the small diastrophism started the instant the daily change in the vertical radiation disappeared. The distortion that had been producing the conductivity anomaly was quickly re-leased when the diastrophism began. The sharp radiation was possibly due to some mechanical stress and/or electri-cal changes when the crust movement took place.
50 M. Hata et al.: Electromagnetic-wave radiation
Fig. 9. Transitional phases of the vertical magnetic flux for 25–29
July correspond to the simultaneous decrease in the horizontal east-west magnetic flux, which means the cancellation of the orthogonal component produced by the conductivity anomaly.
propagated from the diastrophism area, but instead generated near the observation site through mechanical to electrical en-ergy conversion. This is due to the following three facts. The first fact is that the propagation loss in the crust was too large to radiate EM waves directly from the diastrophism area. The second fact is that the amplitude ratio of the verti-cal to the horizontal magnetic flux should be less than unity for the propagated signal, but the ratio of the observed data was almost the same, since the propagated vertical magnetic component was greatly decreased by the induced current in the Earth. The third fact is that the Omaezaki spot detected clear vertical radiation corresponding to the swarm at the di-astrophism, but not for the Usami, Itoh site, notwithstand-ing the longer distance from the Kozu Islands. If the radia-tion had been propagated directly from the diastrophism area, then the amplitudes for both sites would have been almost the same, but the fact is that the amplitudes for both sites differed. Therefore, we concluded that the vertical radiation detected at the Omaezaki spot at the diastrophism resulted from some kind of energy transmitted directly from the Kozu Islands via the tectonic line and converted to EM waves near the observation spot.
The detailed mechanism of the generating electromagnetic radiation is not yet known. However, we can see many sibilities of generating it through the tectonic line. One pos-sibility of the energy transmission is the mechanical energy of the diastrophism propagated to the Omaezaki spot through lateral displacement along the tectonic line. Other candidates are forming a channel by the tectonic line that conveys an electric charge and/or current through the high electric
con-Fig. 10. EM radiation due to the diastrophism of 3–4 August 2000
and the corresponding seismograph. The vertical and horizontal north–south magnetic fluxes radiated, but not for the east–west flux. The direction of the flux is defined by the center axis of the loop coil antenna. The large horizontal radiations after the diastrophism during the afternoon of 4–6 August were due to the severe lightning that hit the Tokyo metropolitan area with severe flooding.
ductivity of faults or cracked rocks filled with water. Such channels may act as paths to convey a electro-chemical en-ergy through ion and/or gaseous flow generated in the hot and high-pressure deep zone.
When the diastrophism started on 3–4 August, we could see that the vertical radiation appeared simultaneously with the earthquake swarm, as shown in Fig. 10. The record was taken by the seismometer setup in Usami, Itoh-city, approx-imately 85 km north of the islands. The remarkable ver-tical and north–south horizontal magnetic fluxes were ob-served only at the Omaezaki observation spot, but not at the other three Kawanazaki, Shiofuki and Usami sites in Itoh-city, which were located about 80 km to 85 km to the north of the Kozu Islands. The most sensitive observation site for the diastrophism was the Omaezaki site, located about 110 km northwest of the Kozu Islands. The radiation inten-sity showed a parabolic increasing waveform and abruptly decreased with the end of the diastrophism. The parabolic increasing radiation pattern is suggestive of accumulation of the effects due to crust distortion produced at the Omaezaki
M. Hata et al.: Electromagnetic-wave radiation 51 site with the diastrophism. The reason was thought to be due
to the presence of a tectonic line between the Shizuoka Yaizu and Niijima Islands, and the Omezaki spot was close to the tectonic line. The presence of a tectonic line as a type of lateral fault extending from the Niijima Islands to inland of Shizuoka across the Suruga trough, was proposed by Mogi in 1977 (Mogi, 1981, 1986). It has been confirmed by the Japan Meteorological Agency and other researchers that the seismicity of the Suruga Bay area has been forming a marked contrast on both sides of the tectonic line. The southern part of the line has been more active in the seismicity than the northern part. These facts show the presence of a tectonic line.
These corresponding facts, the seismograph records and the vertical radiation show that the eruption on the Miyake Islands was detected by electromagnetic radiation. After the first diastrophism, radiation continued until the eruption oc-curred on 18 August 2000. Based on the observed EM radi-ation, we could see that the corresponding severe EM radia-tion preceded the erupradia-tion for a period of about one week.
5 Conclusion
Through observations of electromagnetic wave radiation from the Earth using a highly sensitive receiver in the ELF band, we could detect anomalous EM radiation and analyze the phases of activities with respect to the Miyake volcanic eruptions. The EM monitoring system in the ELF band might be valuable for warning and/or monitoring volcanic erup-tions. The anomalous radiation could also tell us valuable information on the mysterious generation mechanism of EM radiation and the phases of volcanic activities. A concrete model of the EM radiation mechanism remains to be ana-lyzed, and detailed analyses using more closely meshed ob-servation sites are required.
Acknowledgements. This work was supported by Grant-in-Aid for
Scientific Research (A) (1) 11305031 of the Ministry of Education, Culture, Sports, Science and Technology of Japan.
References
Fraser-Smith, A. C., Bernardi, A., McGil, P. R., Ladd, M. E., Hel-liwell, R. A., and Villard, Jr., O. G.: Low-frequency magnetic field measurements near the epicenter of the Ms 7.1 Loma Prieta earthquake, Geophys. Res. Lett., 17, 1465–1468, 1990. Fujinawa, Y. and Takahashi, K.: Emission of electromagnetic
ra-diation preceding the Ito seismic swarm of 1989, Nature, 347, 376–378, 1990.
Gokhberg, M. B., Morgounov, V. A., Yoshino, T., and Tomizawa, I.: Experimental measurements of electromagnetic emission pos-sibly related to earthquakes in Japan, Geophys. Res., 87, B9, 7824–7828, 1982.
Hata, M., Takumi, I., Yabashi, S., and Tian, X.: An anomaly of ELF band vertical magnetic flux as a precursor of dome formation at Unzen volcano and its model analysis, Physics of the Earth and Planetary Interiors 105, 271–277, 1998.
Hata, M. and Yabashi, S.: Observation of ELF radiation related to volcanic and earthquake activities, in: Electromagnetic phe-nomena related to earthquake prediction, (Eds) Hayakawa, M. and Fujinawa, Y., Terra Scientific (TERAPUB), Tokyo, 159–174, 1994.
JMA (Japan Meteorological Agency): Recent seismic activity in the Miyakejima and Niijima-Kozushima region, Japan—The largest earthquake swarm ever recorded, Earth Planets Space, 52, 1–8, 2000.
Kagiyama, T., Utada, H., and Yamamoto, T.: Electromagnetic struc-ture ang magma ascending process, in: Unzen volcano: The 1990-1992 Eruption, (Ed) Ohta, K., Nishinippon and Kyushu Univ. Press, Fukuoka, 74–79, 1995.
Mizoue, M.: Tokyo inland big earthquakes, Shogakukan, Tokyo, in Japanese, 2001.
Mogi, K.: Earthquake Prediction, Mauris Ewing Volume, AGU, Washington D. C., 4, 43–51, 1981.
Mogi, K.: Earthquake Source Mechanics, Mauris Ewing Volume, AGU, Washington D. C. 6, 183–194, 1986.
Reference Data for Radio Engineers, forth edition Ch. 32, Vibration and shock isolation, ITT Corporation, Stanford Press Inc., pp. 939, 1956.
Reference Data for Radio Engineers, forth edition Ch. 17, Transis-tors, ITT Corporation, Stanford Press Inc., pp.496, 1956. Rokityanski, I. I.: Geoelectromagnetic investigation of the Earth’s
crust and mantle, Springer-Verlag, 1982.
Sasai, Y., Ueshima, M., Utada, H., Kagiyama, T., Zlotnicki, J., Hashimoto, T., and Takahashi, Y.: The 2000 activity of Miyake-jima volcano as inferred electric and magnetic field observations, Journal of Geography, 110, 2, 226–244, 2001.
Wait, J. R.: Electromagnetic waves in stratified media, Pergmaon Press, 1970.
Yamaoka, K., Fujii, N., Kimata, F., Kudo, T., Takai, K., Tabei, T., and Nakano, S.: Long-lasting dike intrusion causing large crustal deformation and active earthquake swarm in Izu volcanic island, Japan, Eos, Transaction AGU, 81, 48, F1260, 2001.
Yoshida, A.: Precursory activity in seismic belts containing the fo-cal region of forthcoming large intraplate earthquakes, Tectono-physics, 140, 2–4, 131–143, 1987.
Yoshino, T.: http://ksp.crl.go.jp/index-j.html, The number six re-search team of the Communication Rere-search Laboratory, the Ministry of Post and Telecommunications, Japan.