HAL Id: hal-00304143
https://hal.archives-ouvertes.fr/hal-00304143
Submitted on 6 May 2008HAL is a multi-disciplinary open access
archive for the deposit and dissemination of sci-entific research documents, whether they are pub-lished or not. The documents may come from teaching and research institutions in France or abroad, or from public or private research centers.
L’archive ouverte pluridisciplinaire HAL, est destinée au dépôt et à la diffusion de documents scientifiques de niveau recherche, publiés ou non, émanant des établissements d’enseignement et de recherche français ou étrangers, des laboratoires publics ou privés.
Global temperature estimates in the troposphere and
stratosphere: a validation study of
COSMIC/FORMOSAT-3 measurements
P. Kishore, S. P. Namboothiri, J. H. Jiang, Venkataraman Sivakumar, K.
Igarashi
To cite this version:
P. Kishore, S. P. Namboothiri, J. H. Jiang, Venkataraman Sivakumar, K. Igarashi. Global temper-ature estimates in the troposphere and stratosphere: a validation study of COSMIC/FORMOSAT-3 measurements. Atmospheric Chemistry and Physics Discussions, European Geosciences Union, 2008, 8 (3), pp.8327-8355. �hal-00304143�
ACPD
8, 8327–8355, 2008 COSMIC validation studies P. Kishore et al. Title Page Abstract Introduction Conclusions References Tables Figures ◭ ◮ ◭ ◮ Back CloseFull Screen / Esc
Printer-friendly Version
Interactive Discussion
EGU
Atmos. Chem. Phys. Discuss., 8, 8327–8355, 2008 www.atmos-chem-phys-discuss.net/8/8327/2008/ © Author(s) 2008. This work is licensed
under a Creative Commons License.
Atmospheric Chemistry and Physics Discussions
Global temperature estimates in the
troposphere and stratosphere: a
validation study of COSMIC/FORMOSAT-3
measurements
P. Kishore1, S. P. Namboothiri2, J. H. Jiang3, V. Sivakumar4, and K. Igarashi2
1
Dept. of Physics and Atmospheric Science, Dalhousie University, Halifax, Canada
2
National Institute of Information and Communications Technology, Tokyo, Japan
3
Jet Propulsion Laboratory, Pasadena, CA, USA
4
National Laser Centre, CSIR, Pretoria, South Africa
Received: 13 November 2007 – Accepted: 4 April 2008 – Published: 6 May 2008 Correspondence to: P. Kishore ([email protected])
ACPD
8, 8327–8355, 2008 COSMIC validation studies P. Kishore et al. Title Page Abstract Introduction Conclusions References Tables Figures ◭ ◮ ◭ ◮ Back CloseFull Screen / Esc
Printer-friendly Version
Interactive Discussion
EGU
Abstract
This paper mainly focuses on the validation of temperature estimates derived with the newly launched Constellation Observing System for Meteorology Ionosphere and Cli-mate (COSMIC)/Formosa Satellite 3 (FORMOSAT-3) system. The analysis is based on the radio occultation (RO) data sample collected during the first year observation 5
from April 2006 to April 2007. For the validation, we have used the operational strato-spheric analyses (models) including the National Centers for Environmental Prediction-Reanalysis (NCEP-Prediction-Reanalysis), the Japanese 25-year Prediction-Reanalysis (JRA-25), and the United Kingdom Met Office (MetO) data sets. Comparisons done in different for-mats reveal excellent agreement between the COSMIC and model outputs. Spatially, 10
the largest deviations are noted in the polar latitudes, and height-wise, the tropical tropopause region noted the maximum differences. However, these differences are only 2–4 K. We found that among the three models the NCEP data sets have the best resemblance with the COSMIC measurements. We also have done comparison of specific humidity and refractivity profiles with other measurements/models. Specific 15
humidity profiles show comparatively large differences at altitudes below 5 km. Refrac-tivity profiles derived by the COSMIC and other datasets show very good agreement.
1 Introduction
Temperatures are important in many aspects of atmospheric research and many stud-ies have investigated the accuracy of derived temperature profiles (e.g., Hertzog et al., 20
2003; Pommerau et al., 2002; Knudsen et al., 2002). Knowledge of the upper tropo-spheric and lower stratotropo-spheric temperatures is important for understanding the struc-ture and dynamics of the region, and is related to the issues connected to global cli-mate change and the stratosphere-troposphere exchanges (Holton et al., 1995; Baray et al., 1998; Burris et al., 1998; Steinbrecht et al., 1998). A wide variety of obser-25
ACPD
8, 8327–8355, 2008 COSMIC validation studies P. Kishore et al. Title Page Abstract Introduction Conclusions References Tables Figures ◭ ◮ ◭ ◮ Back CloseFull Screen / Esc
Printer-friendly Version
Interactive Discussion
EGU
lower stratosphere and their variations in time and space. These techniques include balloon soundings (e.g., Kitamura and Hirota, 1989; Tsuda et al., 1991), rocketsonde measurements (e.g., Dewan et al., 1984; Hamilton, 1991; Eckermann et al., 1995), and lidar studies (e.g., Wilson et al., 1991; Hauchecorne and Chanin, 1980; Chanin and Hauchecorne, 1991; Whiteway and Carswell, 1994; LeBlanc et al., 1998; Sivaku-5
mar et al., 2003) etc. Most of these observations are mainly over land areas of the Northern Hemisphere (NH) and the period of observations has been limited. This raises the problem of insufficient data for establishing climatology for a global scale, despite the good results from many of the ground-based and space-borne instruments (Steiner and Kirchengast, 2000). Recently Global Positioning Systems (GPS) Radio 10
occultation (RO) observations started offering several important and unique features complementary to other methods of observing the Earth’s atmosphere. The GPS-RO technique has the advantages of global coverage, high accuracy, high vertical reso-lution (less than 1 km), long-term stability, self-calibration and capability to operate in all-weather conditions (Kursinski et al., 1997; Wickert et al., 2001; Hajj et al., 2002). 15
The GPS-RO technique has been very useful in collecting the global high-resolution data sets of atmospheric refractivity, temperature, pressure, and water vapour pro-files. Using the GPS/MET data, initial investigations of the temperature variations in the tropical tropopause region were performed by Nishida et al. (2000) and Randel et al. (2003). The CHAMP and SAC-C profiles occurring within 30 min and 200 km are 20
compared and agreed to better than 0.86 K and to within 0.1 K in the mean between 5 and 15 km altitude, after removing the expected variability of the atmosphere (Hajj et al., 2004). Wang et al. (2004) compared more than 100 temperature profiles collected using the Michelson Interferometer for Passive Atmospheric Sounding (MIPAS) and the Challenging Mini-Satellite Payload (CHAMP) during 14 days in September/October 25
2002. They found good agreement in the upper troposphere and lower stratosphere. The US/Taiwanese Constellation Observing System for Meteorology Ionosphere and Climate (COSMIC/FORMOSAT-3) satellite was successfully launched on 15 April 2006. This mission is expected to bring the use of the innovative use of GPS RO data for
ACPD
8, 8327–8355, 2008 COSMIC validation studies P. Kishore et al. Title Page Abstract Introduction Conclusions References Tables Figures ◭ ◮ ◭ ◮ Back CloseFull Screen / Esc
Printer-friendly Version
Interactive Discussion
EGU
atmospheric and ionospheric research, for improving global weather forecasts and cli-mate change related studies. A distinctive feature of the COSMIC mission, compared to previous RO missions, is tracking both setting and rising neutral atmospheric occul-tations in the lower troposphere in an open-loop (OL) mode (Schreiner et al., 2007). This is very important for detecting the moisture variation in the lower troposphere, 5
which is very important for weather prediction and climate analysis.
In this paper, we use COSMIC and operational stratospheric analyses data sets (hereafter models) for the validation of upper troposphere and lower stratosphere tem-perature profiles. The model data sets include those implemented at the National Centers for Environmental Prediction-Reanalysis (NCEP-Reanalysis), the Japanese 10
25-year Reanalysis (JRA-25), and the UK Met Office (MetO). In the next section we provide some details of the data analysis. Results obtained from the present analysis in terms of comparison between COSMIC satellite and models are described in Sect. 3. We describe the global temperature behaviour noted by each measurement and their differences of temperatures with respect to the COSMIC, for summer and winter sea-15
sons for particular pressure levels. Comparison of the latitudinal temperature has been carried out for different pressure levels. We also made an attempt to compare the height profiles of specific humidity and refractivity derived by the COSMIC, model data sets, and TES-AURA and MLS-AURA satellite measurements. Finally, the conclusions of the present analysis are summarized in Sect. 4.
20
2 Data analysis
2.1 (a) COSMIC
GPS-RO measurements are active limb sounding measurements of the Earth’s atmo-sphere. This technique has emerged as a promising approach for global atmospheric measurements. Under the assumption of geometric optics and local spherical symme-25
ACPD
8, 8327–8355, 2008 COSMIC validation studies P. Kishore et al. Title Page Abstract Introduction Conclusions References Tables Figures ◭ ◮ ◭ ◮ Back CloseFull Screen / Esc
Printer-friendly Version
Interactive Discussion
EGU
the index of refraction profile with vertical resolution that varies from about 50 m in the lower troposphere to about 200–300 m in the lower stratosphere. As mentioned pre-viously, the COSMIC satellite system (Rocken et al., 2000), a constellation of 6 LEO micro-satellites, was put into orbit on 15 April 2006. Since 21 April 2006, GPS-RO technique has been providing accurate and high vertical resolution global data sets of 5
atmospheric parameters. In the present study, we used the COSMIC RO data collected during the one year period from 21 April 2006 to 30 April 2007.
Figure 1 shows the histogram of number of occultations (per day) made by COSMIC soundings that cover the period from 21 April 2006 to 30 April 2007. The total number of occultations is 425 797 during this period of observation. During the initial months 10
the daily occultations were less than 400, and it has increased enormously, from August 2006, to about 1400–1600 soundings within the height interval 0–40 km. The maximum number of occultations (per day) is observed on 4 March 2007 and is 2493.
2.2 (b) NCEP-Reanalysis (NCEP)
The reanalysis data set was created through the cooperative efforts of the National 15
Centers for Environmental Prediction (NCEP) and National Center for Atmospheric Research (NCAR) to produce relatively high-resolution global analyses of atmospheric fields over a long time period (Kalnay et al., 1996; Kistler et al., 2001). Data from many different sources (including rawinsondes, balloons, aircrafts, ships, surface stations and satellites) were put through a quality check, fed into an assimilation model that includes 20
parameterizations for all major physical processes, and finally examined again for self consistency. The data sets contain daily averages of geopotential height, wind, and temperature on 17 pressure levels above the surface (from 1000 hpa to 10 hPa) with spatial resolution of 2.5◦
ACPD
8, 8327–8355, 2008 COSMIC validation studies P. Kishore et al. Title Page Abstract Introduction Conclusions References Tables Figures ◭ ◮ ◭ ◮ Back CloseFull Screen / Esc
Printer-friendly Version
Interactive Discussion
EGU
2.3 (c) JRA-25 Reanalysis (JRA-25)
The Japanese 25-year reanalysis (JRA-25) is an up-to-date data set produced by the Japan Meteorological Agency (JMA) and the Central Research Institute of Electrical Power Industry (CRIEPI). The main components of the system are a spectral forecast model, various quality control (QC) processes, a three dimensional variational (3D-Var) 5
data assimilation process, and a land surface model. JRA-25 reanalysis is a basic me-teorological grid point data set with uniform resolution of 120 km in the horizontal and from the surface to about 50 km in the vertical. The output contains over 200 meteo-rological parameters globally with 23 vertical levels from 1000 hPa to 0.4 hPa and the resolution of 2.5◦
×2.5◦ intervals in longitude/latitude wise. A 3D-Var data assimilation 10
system is adopted for assimilating various kinds of satellite data effectively (Onogi et al., 2005, 2007).
2.4 (d) UK Met Observations (MetO)
A data assimilation system has been developed at the UK Meteorological Office (UKMO) to analyze the various observations available in the troposphere and strato-15
sphere. The data assimilation system is based on the analysis correction scheme used at the UKMO for operational weather forecasting (Swinbank and O’Neill, 1994). The analysis consists of temperatures, wind components, and geopotential heights on a global grid of resolution 2.5×3.75◦ (latitude/longitude) with 22 vertical pressure lev-els from 1000 to 0.32 hPa corresponds to the altitude range of 0–55 km. The aim of 20
the assimilation project is to provide a self-consistent sequence of three-dimensional grid point analyses of the atmosphere, up to the lower mesosphere. The sequence of synoptic analyses is constructed from a heterogeneous mixture of observational data. Since November 2000, the MetO stratospheric analyses have been produced using a new three-dimensional variational data assimilation system (Lorenc et al., 2000). 25
ACPD
8, 8327–8355, 2008 COSMIC validation studies P. Kishore et al. Title Page Abstract Introduction Conclusions References Tables Figures ◭ ◮ ◭ ◮ Back CloseFull Screen / Esc
Printer-friendly Version
Interactive Discussion
EGU
3 Results and discussion
In this section we focus on comparison of COSMIC temperature profiles with the NCEP, MetO and JRA-25 reanalysis data sets. Prior to the comparisons with models, for each RO profile a coinciding profile was extracted from the model values, i.e., by spatially interpolating the model values of nearest coordinates (time and locations) to the loca-5
tions of the RO soundings.
In order to note the global coverage of COSMIC RO, an example of the global oc-cultations for the NH summer season is shown in Fig. 2, where the total number of occultations is 49 302. Here the NH summer season represents the period covered from June to August. In Fig. 2 (right panel) we also show the histogram of number of 10
occultation occurred at every 10◦latitude range. It is evident in the figure that the data coverage is very good for the latitude sector 80◦S–80◦N. The coverage in the equa-torial region is lesser than the midlatitude regions. The near Polar regions (80◦–90◦)
are marked with very low coverage. The summer occultation coverage at the midlati-tudes of the NH and SH is more than 3000 occultations, whereas the equatorial region 15
shows a comparatively smaller number (little more than 1000). We have examined the winter coverage and found that the number of occultation is more than the summer occultations.
3.1 (a) Mean temperature
First, we compare the mean temperature profiles retrieved from COSMIC RO measure-20
ments with models. Figure 3 shows the height profiles of zonal-mean temperatures for five different latitude bands during the one week period 10 April 2007 to 16 April 2007. Here we present the data sets of COSMIC, NCEP, JRA-25, and MetO. To de-termine the mean temperatures, all the available longitudinal data at individual height are sorted into latitude bins of a specified width. The selected latitudinal ranges cover 25
the high-, mid- and low-latitude regions in both Northern and Southern Hemispheres, and they are 50◦N–80◦N, 20◦N–50◦N, 20◦N–20◦S, 20◦S–50◦S, and 50◦S–80◦S. In
ACPD
8, 8327–8355, 2008 COSMIC validation studies P. Kishore et al. Title Page Abstract Introduction Conclusions References Tables Figures ◭ ◮ ◭ ◮ Back CloseFull Screen / Esc
Printer-friendly Version
Interactive Discussion
EGU
Fig. 3 in addition to the mean temperature profiles (left sub-panel) we also show the differences (right sub-panel) with respect to the COSMIC temperatures. In general, comparison of the COSMIC and model temperatures reveals very good agreement. There exists some difference at altitudes below 8 km, which is due to interference from water vapor existence and thus temperature retrieval is incomplete at those heights. 5
Also the correction due to ionospheric residuals will create issues at altitudes above 45 km, and sometimes even from 35 km and above (Rocken et al., 1997; Syndergaard 2000). Hence, we have restricted our comparisons to the height range between 8 and 30 km. The mean differences between COSMIC and models at most of the individual heights vary between 1–2 K, and the mean difference averaged over the height region 10
8–30 km is noted as values between −0.75 and 0.9 K for all the five latitude bands. Larger deviations are seen in the equatorial (20◦S–20◦N) troposphere region, where the data sets exhibit differences of about 2.5–4 K. It is not clear whether these differ-ences are due to larger uncertainties in the COSMIC data or based on the performed analyses. The enhanced gravity wave activity near the equator could also introduce 15
larger differences. These differences are expected to be significantly reduced when large data sets are averaged. Using the CHAMP data, it has been shown that the in-crease of the tropical bias and root mean square (rms) deviation is related to gravity waves (Marquardt et al., 2002). Comparing the models, the NCEP model shows the least difference than all other models. The figure demonstrates positive differences in 20
the troposphere and negative differences stratosphere heights indicating warmer and colder temperatures by COSMIC. The warming is larger in the upper troposphere than in the lower troposphere is due to the moist adiabatic lapse rate decreasing with the increasing temperatures and lower stratosphere the cooling due to increased longwave emission is to a large◦ offset by increased absorption of upwelling longwave radiation 25
from the troposphere (Ringer and Healy, 2008). Schmidt et al. (2004) compared the CHAMP temperature data with nearby radiosonde observations and they found that temperature bias is less than 0.5 K in the upper troposphere and lower stratosphere region. The cold bias above 20 km is related to the bending angle smoothing and the
ACPD
8, 8327–8355, 2008 COSMIC validation studies P. Kishore et al. Title Page Abstract Introduction Conclusions References Tables Figures ◭ ◮ ◭ ◮ Back CloseFull Screen / Esc
Printer-friendly Version
Interactive Discussion
EGU
interpolation procedure for the downward integration of the refractivity profile. Recently, Kishore et al. (2006) made statistical estimates of the bias between the CHAMP, SAC-C, and radiosonde temperature measurements obtained for different latitude sectors during the period from March 2002 to December 2003. Their results demonstrated that the mean bias in the troposphere is less than 0.7 K and it is comparatively larger 5
in the stratosphere (between 0.9–1.5 K).
3.2 (b) Longitudinal – Latitudinal temperature variation
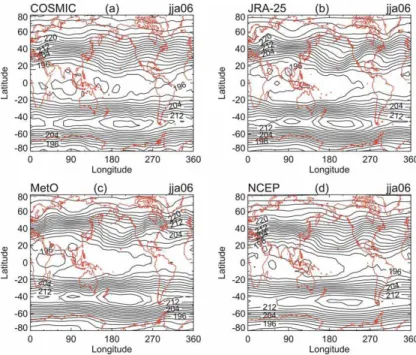
Here we would like to describe the spatial structure of the temperatures derived from COSMIC RO measurements and comparison with the models JRA-25, MetO, and NCEP during the NH summer (June, July, and August) of 2006. Figure 4a–d represents 10
the temperature contours (at 100 hPa) derived by the COSMIC, JRA-25, MetO and NCEP data sets, respectively, during 2006 summer. The data used in this study have been obtained on standard pressure levels, and interpolated onto a 5◦×5◦ longitude-latitude grid. Describing the features, it can be seen that the temperature structure of the COSMIC and models looks similar. The northern Polar region temperature is 15
close to 228 K (−45C) whereas the temperature at southern Polar region is about 28 K lower (Note that the northern summer corresponds to the southern winter.). In southern midlatitudes (35◦S–45◦S) the maximum temperatures is about 216 K for COSMIC and
model observations. The tropical minimum temperature is about 194 K (−79C), which is observed over the eastern Pacific. Therefore the tropical tropopause is expected to 20
occur at about 16 km. Hoinka (1998) reported that for all latitudes the temperature at 100 hPa level provides a first estimate of tropopause temperature.
The global temperature structure generated by the COSMIC and model values for the northern winter (December 2006, January and February 2007) at 100 hPa pressure level is shown in Fig. 5a–d. Looking at the temperature pattern at the Polar regions we 25
can see that the Arctic temperature is about 206 K, whereas it is close to 228 K in the Antarctic region. In the tropics, temperature reaches about 192 K (−81C), which is ob-served in the western Pacific. Newell et al. (1972) had reported that the largest region
ACPD
8, 8327–8355, 2008 COSMIC validation studies P. Kishore et al. Title Page Abstract Introduction Conclusions References Tables Figures ◭ ◮ ◭ ◮ Back CloseFull Screen / Esc
Printer-friendly Version
Interactive Discussion
EGU
of lowest temperatures (colder than −82.5C in the seasonal mean) at 100 hPa occurs over the western Pacific Ocean in winter. Secondary regions of limited extent appear over Northern South America and Africa. Newell and Gould-Stewart (1981) presumed a significant water vapor transport from the troposphere into the stratosphere in these regions and it is most active in the west Pacific in winter and moves to the monsoon 5
region for the NH summer. Both COSMIC and model noticed the NH maximum tem-peratures of ∼224 K at 50◦N. Concluding the summer and winter temperature features observed in the contours, it can be stated that the structure generated by the COSMIC and models has encouraging similarity, which is further established with the tempera-ture differences explained below.
10
The longitude-latitude structure of the temperature differences between COSMIC and model data sets at 100 hPa level are shown in Fig. 6 and Fig. 7, for summer and winter, respectively. In each figure, (a) corresponds to COSMIC–JRA-25, (b) denotes COSMIC–MetO, and (c) represents the COSMIC–NCEP data sets. Examining the Fig. 6 we can see that the difference between the COSMIC and other measurements is 15
not very large. Maximum deviation of 2 K is observed in limited areas. Such deviations are generally observed in the high latitudes in the Southern Hemisphere (SH). It is evident that the COSMIC and the NCEP model values match better than the other two pairs. Note that the solid line denotes warmer COSMIC temperature and dotted line denotes colder COSMIC temperature. For a large latitude/longitude sector, the 20
summer temperature difference is about 0.75–1.25 K. Schmidt et al. (2004) compared the CHAMP with ECMWF analyses data sets in the troposphere and lower stratosphere for the period of May 2001 and September 2002 and they mentioned that the average bias in the upper troposphere and lower stratosphere (250–30 hPa) is less than 1.5 K. Gobiet et al. (2005) made a seasonal latitude-height temperature structure of CHAMP 25
and compared with ECMWF operational analysis using 2.5 year data sets. They noted mean temperature cold biases of −2.5 K (maximum) and warm biases up to +3.5 K in the Austral polar vortex region.
ACPD
8, 8327–8355, 2008 COSMIC validation studies P. Kishore et al. Title Page Abstract Introduction Conclusions References Tables Figures ◭ ◮ ◭ ◮ Back CloseFull Screen / Esc
Printer-friendly Version
Interactive Discussion
EGU
COSMIC and models. It illustrates that in the NH the largest differences occur with cold biases of −4.5 K with MetO and JRA-25. However, the NCEP data show differences of only about −1.5 to −2.5 K over the Arctic region. The corresponding differences observed in the SH are smaller, typically ranging between −1.5 and −2.5 K for all the models. The mean differences are relatively small between 30◦S and 30◦N at about 5
1.0–1.25 K. Figure 7 further indicates that the COSMIC temperature observed to be warmer in the latitude range of 30◦S–30◦N and colder in the northern and southern polar regions. In the beginning of winter the polar vortex edge was located at the north-ern high latitudes especially above Europe, but moved significantly as the warming progressed and it might be one of the causes for increased temperature differences. 10
From the summer and winter patterns shown in Figs. 6 and 7, it can be seen that the differences observed in NH winter (SH summer) are significantly larger than the NH summer (SH winter) and this reflects the SH winter circulation in the upper tropo-sphere and lower stratotropo-sphere is less disturbed than in the NH winter. We note that the maxima of the seasonal mean differences between COSMIC and models at 100 hPa 15
is larger during NH winter than summer season. The MIPAS and CHAMP comparison studies demonstrated a maximum bias of ∼1–1.5 K at 30 km (Wang et al., 2004). Fur-ther, using the MIPAS and SAC-C data sets, Jiang et al. (2004) estimated the mean differences for 5–30 km and for two different seasons. Their estimate was less than ∼2 K.
20
It is appropriate to show the statistical estimates of the bias between the COSMIC– NCEP, COSMIC–MetO and COSMIC–JRA-25 measurements obtained for different lat-itude sectors for summer and winter seasons at 100 hPa and 50 hPa, and are shown in Tables 1 and 2. The tables depict that the winter differences are consistently larger than the summer for both pressure levels. The RMS deviations are in the range of 1.5– 25
2.25 K. The mean differences are larger at high latitudes in both summer and winter seasons for both pressure levels, especially for the MetO values.
ACPD
8, 8327–8355, 2008 COSMIC validation studies P. Kishore et al. Title Page Abstract Introduction Conclusions References Tables Figures ◭ ◮ ◭ ◮ Back CloseFull Screen / Esc
Printer-friendly Version
Interactive Discussion
EGU
3.3 (c) Latitudinal temperature variations at three different pressure levels
The latitudinal temperature structure, at three different pressure levels in December 2006, observed by the models and satellite measurements is shown in Fig. 8a–c. The three chosen pressure levels are 100 hPa, 50 hPa and 20 hPa. In the right panel Fig. 8d–f we show the differences with respect to the COSMIC measurements for the 5
corresponding pressure levels. From Fig. 8a–c it is evident that the overall latitudinal structure is similar in each pressure level. Looking at the differences (Fig. 8d–f), large temperature differences are observed at 100 hPa and less at 20 hPa level. The TES-AURA data exhibit cold biases up to ∼5 K in the southern latitude (50◦S) region and ∼4 K in the NH (70◦N) region. The MLS-AURA is illustrating cold bias for all the pres-10
sure levels and at almost all latitudes. The maximum difference observed in this case is ∼4 K in the upper troposphere and lower stratosphere. In the case of radiosonde tem-peratures, the differences are little larger at 100 hPa level where it exemplifies warm bias of ∼4 K over the Arctic and cold bias over the Antarctic (∼4 K). In particular, the NCEP, NCEP 2, JRA-25 data agree well with COSMIC measurements and they show 15
warm bias of 1.5 to 2 K and cold bias of 1 to 2 K. The MetO data sets are consistent with COSMIC in the latitude range of 60◦S–60◦N with a warm bias of 2–3.5 K and cold bias of 1–2 K. Overall, it can be concluded that the temperature differences are comparatively smaller over the latitude sector 60◦N–60◦S.
3.4 (d) Comparison of vertical profiles of temperature, specific humidity and 20
refractivity
Comparison of vertical specific humidity, temperature and refractivity profiles derived from COSMIC, CHAMP, ECMWF, NCEP, Radiosonde and TES-AURA data sets are discussed here. The data sets correspond to September 2006 and for the equatorial region from (20◦S to 20◦N). Figure 9a–c shows the height profiles of specific humidity, 25
temperature and refractivity profiles. For estimating the specific humidity profile, we followed the method reported by Heise et al. (2006). They explained the method using
ACPD
8, 8327–8355, 2008 COSMIC validation studies P. Kishore et al. Title Page Abstract Introduction Conclusions References Tables Figures ◭ ◮ ◭ ◮ Back CloseFull Screen / Esc
Printer-friendly Version
Interactive Discussion
EGU
the CHAMP data and compared with radiosonde and ECMWF data sets. Our results suggest that the COSMIC and other data sets have identical humidity values except for the altitudes lower than 4 km. The mean temperature profiles (Fig. 9b) derived from various data sets show excellent similarity. The only slight difference is noted in TES-AURA measurements at altitudes below the tropopause. Finally, the refractivity profiles 5
shown in Fig. 9c also reveal similar values. We have conducted similar analysis for other months also and found impressive alikeness among various measurements.
4 Conclusions
By April 2007 nearly half a million COSMIC radio occultations have been collected high-quality temperature profiles in the troposphere and lower stratosphere. Aiming a 10
validation of the COSMIC temperature profiles, at first we have compared the COSMIC temperature profiles averaged for five different latitude bands with model data sets such as NCEP, JRA-25 and MetO. For the troposphere and stratosphere heights (8–30 km) considered in the present study, we found good agreement among various data sets. The mean differences averaged globally and over height region between 8 and 30 km 15
are estimated as 0.55 ± 0.015 K and 0.65 ± 0.02 K, respectively.
The global temperature structures at 100 hPa level revealed by the COSMIC and models, for the northern summer and winter seasons, again show very good similarities in most of the latitude/longitude sectors. Further, we have given attention to note the difference between the COSMIC measurements and the model values obtained for 20
the northern summer and winter seasons. For the summer season, the maximum differences are relatively smaller at about 0.75–1.25 K for the 70◦S–70◦N latitude range and it increased to 1–2.5 K in the Polar region. Larger differences at the Polar latitudes are caused by the less RO coverage or lower vertical resolution of model values. Also the SH is less covered with regular meteorological observations. The MetO data show 25
comparatively larger differences (2.0–2.5 K) in the equatorial latitudes.
ACPD
8, 8327–8355, 2008 COSMIC validation studies P. Kishore et al. Title Page Abstract Introduction Conclusions References Tables Figures ◭ ◮ ◭ ◮ Back CloseFull Screen / Esc
Printer-friendly Version
Interactive Discussion
EGU
MetO data sets. In the Arctic region the JRA-25 and MetO data sets show cold biases up to 4.5 K. However, the NCEP data show better resemblance with the COSMIC data. The observed differences can be attributed to the low vertical resolution of the model measurements or error introduced by the spherical symmetry assumption when making the COSMIC retrieval. It is also probably affected by the stratospheric circulation in the 5
NH characterized by strong major warming or strong planetary wave activity. Model data sets may not take into account such effects of rapid synoptic developments.
Comparison of latitudinal distribution of zonal mean temperatures performed for the 100 hPA, 50 hPa, and 20 hPa levels mostly show encouraging agreements. Noticeable differences of 3–4 K are noted in the Polar regions. TES-AURA measurements depict 10
comparatively larger differences than other measurements. Finally, comparison studies did for the specific humidity and refractivity profiles also reveals very good agreements between the COSMIC and other measurements. In the future we look forward to per-form further investigations with additional COSMIC and other GPS RO measurements.
Acknowledgements. The authors would like to thank all members of CDAAC team for providing
15
the COSMIC data sets. The authors thanks to the JRA-25 execution team of JMA and CRIEPI for providing data. We thank the UK Met Office and British Atmospheric Data Centre for allowing the use of radiosonde data and MetO data sets. We thank the NCEP Reanalysis data were provided by the NOAA-CIRES Climate Diagnostic Centre, Boulder, Colorado, USA, from their web site athttp://www.cdc.noaa.gov/. We thank the TES Science team and MLS Science for 20
access to their data sets. The first author deeply appreciates and is grateful to the National Institute of Information and Communications Technology (NICT), for their financial support. J. H. Jiang thanks the support by the Microwave Atmospheric Science Team at Jet Propulsion Laboratory, California Institute of Technology, under contract with NASA.
References
25
Baray, J. L., Ancellet, G., Taupin, F. G., Bessafi, M., Baldy, S., and Keckhut, P.: Subtropical tropopause break as a possible stratospheric source of ozone in the tropical tropopause, J. Atmos. Sol.-Terr. Phy., 60, 27–36, 1998.
ACPD
8, 8327–8355, 2008 COSMIC validation studies P. Kishore et al. Title Page Abstract Introduction Conclusions References Tables Figures ◭ ◮ ◭ ◮ Back CloseFull Screen / Esc
Printer-friendly Version
Interactive Discussion
EGU
Burris, J., Heaps, W., Gary, B., Hoegy, W., Lait, L., McGee, T., Gross, M., and Singh, U. N.: Lidar temperature measurements during the tropical ozone transport experiment (TOTE)/vortex ozone transport experiment (VOTE) mission, J. Geophys. Res., 103, 3505–3510, 1998. Chanin, M. L. and Hauchecorne, A.: Lidar study of the structure and dynamics of the middle
atmosphere, Indian J. Radio Space Phys., 20, 1–11, 1991. 5
Dewan, E. M., Grossbard, N., Quesada, A. F., and Good, R. E.: Spectral analysis of 10-m resolution scalar velocity profiles in the stratosphere, Geophys. Res. Lett., 11, 80–83, 1984. Eckermann, S. D., Hirota, I., and Hocking, W. K.: Gravity wave and equatorial wave morphology
of the stratosphere derived from long-term rocket sounding. Q. J. R. Meteorol. Soc., 121, 149–186, 1995.
10
Gobiet, A., Foelsche, U., Steiner, A. K., Borsche, M., Kirchengast, G., and Wickert, J.: Cli-matological validation of stratospheric temperatures in ECMWF operational analyses with CHAMP radio occultation data, Geophys. Res. Lett., 32, doi:10.1029/2005GL022617, 2005. Hajj, G. A., Kursinski, E. R., Romans, L. J., Betiger, W. I., and Leroy, S. S.: A technical
descrip-tion of atmospheric sounding by GPS occultadescrip-tion, J. Atmos. Sol.-Terr. Phy., 64, 451–469, 15
2002.
Hajj, G. A., Ao, C. O., Iijima, B. A., Juang, D., Kursinski, E. R., Mannucci, A. J., Mee-han, T. K., Romans, L. J., de le Torre Juarez, M., and Yunck, T. P.: CHAMP and SAC-C atmospheric occultation results and intercomparisons, J. Geophys. Res., 109, D06109, doi:10.1029/2003JD003909, 2004.
20
Hamilton, K.: Climatological statistics of stratospheric inertia gravity waves deduced from his-torical rocketsonde wind and temperature data, J. Geophys. Res., 96, 831–839, 1991. Hauchecorne, A. and Chanin, M. L.: Density and temperature profiles obtained by lidar between
35 and 70 km, Geophys. Res. Lett., 8, 565–568, 1980.
Heise, S., Wickert, J., Beyerle, G., Schmidt, T., and Reigber, C.: Global monitoring of tro-25
pospheric water vapor with GPS radio occultation aboard CHAMP, Adv. Space Res., 37, 2222–2227, 2006.
Hertzog, A., Basdevant, C., Vial, F., and Mechoso, C. R.: Some results on the accuracy of stratospheric analyses in the Northern Hemisphere inferred from long-duration balloon flights, Q. J. R. Meteor. Soc., 130, 607–626, 2003.
30
Hoinka, K. P.: Statistics of the global tropopause pressure, Mon. Weather. Rev., 126, 3303– 3325, 1998.
ACPD
8, 8327–8355, 2008 COSMIC validation studies P. Kishore et al. Title Page Abstract Introduction Conclusions References Tables Figures ◭ ◮ ◭ ◮ Back CloseFull Screen / Esc
Printer-friendly Version
Interactive Discussion
EGU
Stratosphere-troposphere exchange, Rev. Geophys., 33, 403–439, 1995.
Jiang, J. H., Wang, D. Y., Romans, L. J., Ao, C. O., Schwartz, M. J., Stiller, G. P., von Clar-mann, T., Puertas, M. L., Funke, B., Lopez, S. G., Glatthor, N., Grabowski, U., H ¨opfner, M. Kellmann, S., Kiefer, M., Linden, A., Mengistu-Tsidu, G., Milz, M., Steck, T., and Fischer, H.: Comparison of GPS / SAC-C and MIPAS/ ENVISAT Temperature Profiles and Its Pos-5
sible Implementation for EOS MLS Observations, in: CHAMP Mission Results for Gravity and, Magnetic Field Maping, and GPS Atmospheric sounding, edited by: Reigber, C., Luehr, H., Schwintzer, P., and Wickert, J., Springer-Verlag, Berline/Heidelberg/New York, 573–578, 2004.
Kalnay, E., Kanamitsu, M., Kistler, R., et al.: The NCEP/NCAR 40-year reanalysis project, Bull. 10
Am. Meteorol. Soc., 77, 437–471, 1996.
Kishore, P., Namboothiri, S. P., Igarashi, K., Jiang, J. H., Ao, C. O., and Romans, L. J.: Cli-matological characteristics of the tropopause parameters derived from GPS/CHAMP and GPS/SAC-C measurements, J. Geophys. Res., 111, D20110, doi:10.1029/2005JD006827, 2006.
15
Kistler, R., Kalnay, E., Collins, W., et al.: The NCEP-NCAR reanalysis: Monthly means CD-ROM and documentation, Bull. Am. Meteorol. Soc., 82, 247–267, 2001.
Kitamura, Y. and Hirota, I.: Small-scale disturbances in the lower stratosphere revealed by daily rawinsonde observations, J. Meteorol. Soc. Japan, 67, 817–831, 1989.
Knudsen, B. M., Pommereau, J. P., Garnier, A., Nunes-Pinharandra, M., Denis, L., Newman, 20
P., Letrenne, G., and Durand, M.: Accuracy of analyzed stratospheric temperatures in the winter arctic vortex from infra red montgolfer long duration balloon flights, Part II: Results, J. Geophys. Res., 107, D20, doi:10.1029/2001JD001329, 2002.
Kursinski, E. R., Hajj, G. A., Hardy, K. R., Schofield, J. T., and Linfield, R.: Observing Earth’s atmosphere with radio occultation measurements using the Global Positioning System, J. 25
Geophys. Res., 102, 23 429–23 465, 1997.
Leblanc, L. S., Mcdermid, L. S., Hauchecorne, A., and Keckhut, P.: Evaluation and optimization of lidar temperature analysis algorithms using simulated lidar data, J. Geophys. Res., 103, 6177–6187, 1998.
Lorenc, A. C., Ballard, S. P., Bell, R. S., et al.: The Met Office global 3-dimensional variational 30
data assimilation scheme, Q. J. R. Meteor. Soc., 126, 2991–3012, 2000.
Marquardt, C., Schoellhammer, K., Beyerle, G., Schmidt, T., Wickert, J., and Reigber, C.: Val-idation and data quality of CHAMP radio occultation data, in First CHAMP Mission Results
ACPD
8, 8327–8355, 2008 COSMIC validation studies P. Kishore et al. Title Page Abstract Introduction Conclusions References Tables Figures ◭ ◮ ◭ ◮ Back CloseFull Screen / Esc
Printer-friendly Version
Interactive Discussion
EGU
for Gravity, Magnetic and Atmospheric Studies, 384–396, Springer, New York, 2003.
Newell, R. E., Kidson, J. W., Vincent, D. G., and Boer, G. J.: The general circulation of the tropical atmosphere and interactions with extratropical latitudes, The MIT Press, 258 pp., 1972.
Newell, R. E. and Gould-Stewart, S.: A stratospheric fountain?, J. Atmos. Sci., 38, 2789–2797, 5
1981.
Nishida, M., Shimizu, A., Tsuda, T., Rocken, R., and Ware, R. H.: Seasonal and longitu-dinal variations in the tropical tropopause observed with the GPS occultation technique (GPS/MET), J. Meteor. Soc. Jpn., 78, 691–700, 2000.
Onogi, K., Koide, H., Sakamoto, M., Kobayashi, S., Tsutsui, J., Hatsushika, H., Matsumoto, 10
T., Yamazaki, N., Kamahori, H., Takahashi, K., Kato, K., Ose, T., Kadokura, S., and Wada, K.: JRA-25; Japanese 25-year Reanalysis progress and status, Q. J. R. Meteor. Soc., 131, 3259–3268, 2005.
Onogi, K., Tsutsui, J., Koide, H., Sakamoto, M., Kobayashi, S., Hatsushika, H., Matsumoto, T., Yamazaki, N., Kamahori, H., Takahashi, K., Kadokura, S., Wada, K., Kato, K., Oyama, 15
R., Ose, T., Mannoji, N., and Taira, R.: The JRA-25 Reanalysis, Q. J. R. Meteor. Soc., 85, 369–432, 2007.
Pommereau, J. P., Garnier, A., Knudsen, B. M., et al.: Accuracy of analyzed stratospheric temperatures in the winter arctic vortex from infra red montgolfer long duration balloon flights Part I: Measurements, J. Geophys. Res., 107, D20, doi:10.1029/2001JD001379, 2002. 20
Randel, W. J., Wu, F., and Rios, W. R.: Thermal variability of the tropical tropopause region derived from GPS/MET observations, J. Geophys. Res., 108, 4024, doi:10.1029/2002JD002595, 2003.
Ringer, M. A. and Healy, S. B.: Monitoring twenty-first century climate using GPS radio occul-tation bending angles, Geophys. Res. Lett., 35, L05708, doi:10.1029/2007GL032462, 2008. 25
Rocken, C., Anthes, R., Exner, M., et al.: Analysis and validation of GPS/MET data in the neutral atmosphere, J. Geophys. Res., 102, D25, 29 849–29 866, 1997.
Rocken, C., Kuo, Y. H., Schreiner, W., Hunt, D., Sokolovskiy, S., and McCormick, C.: COSMIC System Description, Terr. Atmos. Oceanic Sci., 11, 21–52, 2000.
Schmidt, T., Wickert, J., Beyerle, G., and Reigber, C.: Tropical tropopause parameters derived 30
from GPS radio occultation measurements with CHAMP, J. Geophys. Res., 109, D13105, doi:10.1029/2004JD004566, 2004.
pre-ACPD
8, 8327–8355, 2008 COSMIC validation studies P. Kishore et al. Title Page Abstract Introduction Conclusions References Tables Figures ◭ ◮ ◭ ◮ Back CloseFull Screen / Esc
Printer-friendly Version
Interactive Discussion
EGU
cision of GPS radio occultations from the COSMIC/FORMOSAT-3 mission, Geophys. Res. Lett., 34, L04808, doi:10.1029/2006GL027557, 2007.
Sivakumar, V., Rao, P. B., and Krishnaiah, M.: Lidar measurements of stratosphere-mesosphere thermal structure over a low latitude: Comparison with satellite data and mod-els, J. Geophys. Res., 108, D11, doi:10.1029/2002JD003029, 2003.
5
Steinbrecht, W., Claude, H., Kohler, U., and Hoinka, K. P.: Correction between tropopause height and total ozone: Implication for long-term changes, J. Geophys. Res., 103, 19 183– 19 192, 1998.
Steiner, A. K. and Kirchengast, G.: Gravity wave spectra from GPS/MET occultation observa-tions, J. Atmos. Oceanic Tech., 17, 495–503, 2000.
10
Swinbank, R. and O’Neill, A.: A stratosphere-troposphere data assimilation system, Mon. Weather. Rev., 122, 686–702, 1994.
Syndergaard, S.: On the ionosphere calibration in GPS radio occultation measurements, Radio. Sci., 35, 865–884, 2000.
Tsuda, T., VanZandt, T. E., Mizumoto, M., Kato, S., and Fukao, S.: Spectral analysis of temper-15
ature and Brunt-Vaisala frequency fluctuations observed by radiosondes, J. Geophys. Res., 96, 17 265–17 278, 1991.
Wang, D. Y., Stiller, G. P., Clarmann, T. V., Fischer, H., Lopez-Puertas, M., Funke, B., Glatthor, N., Grabowski, U., Hopfner, M., Kellmann, S., Kiefer, M., Linden, A., Tsidu, G. M., Milz, M., Steck, T., Jiang, J. H., Ao., C. O., Manney, G., Hocke, K., Wu, D. L., Romans, L. J., Wickert, 20
J., and Schmidt, T.: Cross validation of MIPAS/ENVISAT and GPS/CHAMP temperature profiles, J. Geophys. Res., 109, D19311, doi:10.1029/2004JD004963, 2004.
Whiteway, J. A. and Carswell, A. I.: Rayleigh lidar observations of thermal structure and gravity wave activity in the high Arctic during a stratospheric warming, J. Atmos. Sci., 51, 3122– 3136, 1994.
25
Wickert, J., Reigber, C., Beyerle, G., et al.: Atmosphere sounding by GPS radio occultation: First results from CHAMP, Geophys. Res. Lett., 28, 3263–3266, 2001.
Wilson, R., Hauchecorne, A., and Chanin, M. L.: Gravity wave spectra in the middle atmo-sphere as observed by Rayleigh lidar, J. Geophys. Res., 96, 5153–5167, 1991.
ACPD
8, 8327–8355, 2008 COSMIC validation studies P. Kishore et al. Title Page Abstract Introduction Conclusions References Tables Figures ◭ ◮ ◭ ◮ Back CloseFull Screen / Esc
Printer-friendly Version
Interactive Discussion
EGU
Table 1. The temperature bias between the COSMIC and model data sets calculated for differ-ent latitude sectors during summer and winter seasons and at 100 hPa.
Summer (100 hPa) Winter (100 hPa)
Latitude COSMIC –NCEP COSMIC – MetO COSMIC – JRA25 COSMIC – NCEP COSMIC – MetO COSMIC – JRA25 (K) (K) (K) (K) (K) (K) 50◦N–80◦N −0.043 ± 0.69 0.993 ± 0.78 0.346 ± 0.46 −0.066 ± 0.43 −0.981 ± 1.03 −1.479 ± 1.23 20◦N–50◦N −0.184 ± 0.45 0.752 ± 0.76 0.053 ± 0.74 −0.324 ± 0.78 −0.187 ± 0.56 −0.727 ± 1.45 20◦N–20◦S 0.296 ± 0.78 −0.531 ± 0.89 −0.602 ± 0.98 −0.245 ± 0.77 0.614 ± 0.88 0.140 ± 0.49 20◦S–50◦S −0.478 ± 0.88 0.261 ± 0.55 −0.401 ± 0.67 −0.332 ± 0.72 0.350 ± 0.78 0.722 ± 1.15 50◦S–80◦S −0.854 ± 1.23 1.921 ± 2.01 1.381 ± 1.44 −1.078 ± 1.56 −0.602 ± 1.49 −0.543 ± 1.47
ACPD
8, 8327–8355, 2008 COSMIC validation studies P. Kishore et al. Title Page Abstract Introduction Conclusions References Tables Figures ◭ ◮ ◭ ◮ Back CloseFull Screen / Esc
Printer-friendly Version
Interactive Discussion
EGU
Table 2. Temperature bias between the COSMIC and model data sets calculated for different latitude sectors during summer and winter seasons and at 50 hPa.
Summer (50 hPa) Winter (50 hPa)
Latitude COSMIC –NCEP COSMIC – MetO COSMIC – JRA25 COSMIC – NCEP COSMIC – MetO COSMIC – JRA25 (K) (K) (K) (K) (K) (K) 50◦N–80◦N −0.672 ± 1.29 0.562 ± 0.89 0.391 ± 0.66 −1.094 ± 2.13 −1.594 ± 2.43 −1.302 ± 1.97 20◦ N–50◦ N −0.196 ± 0.58 −0.346 ± 0.75 −0.246 ± 0.59 −0.052 ± 0.89 −0.075 ± 1.16 0.093 ± 0.45 20◦ N–20◦ S −0.227 ± 0.65 −0.213 ± 0.79 −0.313 ± 0.88 0.066 ± 0.99 0.087 ± 0.45 0.811 ± 1.39 20◦S–50◦S −0.162 ± 0.66 −0.780 ± 1.05 −0.880 ± 1.47 −0.164 ± 0.82 −0.145 ± 0.74 0.235 ± 0.89 50◦S–80◦S −0.279 ± 0.73 1.252 ± 1.62 1.452 ± 1.78 0.609 ± 1.19 1.775 ± 2.09 1.805 ± 2.26
ACPD
8, 8327–8355, 2008 COSMIC validation studies P. Kishore et al. Title Page Abstract Introduction Conclusions References Tables Figures ◭ ◮ ◭ ◮ Back CloseFull Screen / Esc
Printer-friendly Version
Interactive Discussion
EGU
Fig. 1. Histogram of number of occultations (per day) for the period from 21 April 2006 to 30 April 2007.
ACPD
8, 8327–8355, 2008 COSMIC validation studies P. Kishore et al. Title Page Abstract Introduction Conclusions References Tables Figures ◭ ◮ ◭ ◮ Back CloseFull Screen / Esc
Printer-friendly Version
Interactive Discussion
EGU
Fig. 2. Global coverage of COSMIC occultations for the Northern Hemisphere summer (1 June 2006–31 August 2006). Histogram of total number of occultations occurred in every 10◦latitude
ACPD
8, 8327–8355, 2008 COSMIC validation studies P. Kishore et al. Title Page Abstract Introduction Conclusions References Tables Figures ◭ ◮ ◭ ◮ Back CloseFull Screen / Esc
Printer-friendly Version
Interactive Discussion
EGU
Fig. 3. Height profiles of the COSMIC and model temperatures derived for various latitude bands and for the period 10 April 2007–16 April 2007. In each right sub panel the difference in temperature with respect to COSMIC measurements and model values is plotted.
ACPD
8, 8327–8355, 2008 COSMIC validation studies P. Kishore et al. Title Page Abstract Introduction Conclusions References Tables Figures ◭ ◮ ◭ ◮ Back CloseFull Screen / Esc
Printer-friendly Version
Interactive Discussion
EGU
Figure 4. Mean global temperatures at 100 hPa by (a) COSMIC, (b) JRA-25, (c)
Fig. 4. Mean global temperatures at 100 hPa by (a) COSMIC, (b) JRA-25, (c) MetO and (d) NCEP data sets during Northern Hemisphere summer (June–August, 2006). The contour in-terval is 2 K.
ACPD
8, 8327–8355, 2008 COSMIC validation studies P. Kishore et al. Title Page Abstract Introduction Conclusions References Tables Figures ◭ ◮ ◭ ◮ Back CloseFull Screen / Esc
Printer-friendly Version
Interactive Discussion
EGU
Fig. 5. Same as Fig. 4, but for the Northern Hemisphere winter (December 2006, January, February 2007).
ACPD
8, 8327–8355, 2008 COSMIC validation studies P. Kishore et al. Title Page Abstract Introduction Conclusions References Tables Figures ◭ ◮ ◭ ◮ Back CloseFull Screen / Esc
Printer-friendly Version
Interactive Discussion
EGU
Fig. 6. Global zonal mean temperature differences (in Kelvin) between (a) COSMIC–JRA-25, (b) COSMIC–MetO, and (c) COSMIC–NCEP during Northern Hemisphere summer (June– August, 2006). The contour interval is 1 K.
ACPD
8, 8327–8355, 2008 COSMIC validation studies P. Kishore et al. Title Page Abstract Introduction Conclusions References Tables Figures ◭ ◮ ◭ ◮ Back CloseFull Screen / Esc
Printer-friendly Version
Interactive Discussion
EGU
Fig. 7. Same as Fig. 6, but for Northern Hemisphere winter (December 2006, January, Febru-ary 2007). The contour interval is 1 K.
ACPD
8, 8327–8355, 2008 COSMIC validation studies P. Kishore et al. Title Page Abstract Introduction Conclusions References Tables Figures ◭ ◮ ◭ ◮ Back CloseFull Screen / Esc
Printer-friendly Version
Interactive Discussion
EGU
Fig. 8. Latitudinal distribution of mean zonal temperatures for (a) 100 hPa, (b) 50 hPa, and (c) 20 hPa. Various data sets shown in the figure correspond to December 2006. Distribution of differences with respect to COSMIC measurements and other data sets are given in the right panel (d–f).
ACPD
8, 8327–8355, 2008 COSMIC validation studies P. Kishore et al. Title Page Abstract Introduction Conclusions References Tables Figures ◭ ◮ ◭ ◮ Back CloseFull Screen / Esc
Printer-friendly Version
Interactive Discussion
EGU
Fig. 9. Comparison of average vertical height profiles of (a) specific humidity, (b) temperature, and (c) refractivity profiles derived from COSMIC, CHAMP, ECMWF, NCEP, Radiosonde, and TES-AURA data sets for the latitude sector 20◦S–20◦N during September 2006.