Factors That Influence the Immune Response to Vaccination
Petra Zimmermann,
a,b,c,d,eNigel Curtis
a,b,caDepartment of Paediatrics, The University of Melbourne, Parkville, Australia
bInfectious Diseases & Microbiology Research Group, Murdoch Children’s Research Institute, Parkville, Australia
cInfectious Diseases Unit, The Royal Children’s Hospital Melbourne, Parkville, Australia
dDepartment of Pediatrics, Fribourg Hospital HFR, Fribourg, Switzerland
eFaculty of Science and Medicine, University of Fribourg, Fribourg, Switzerland
SUMMARY . . . 2
INTRODUCTION . . . 2
FACTORS INFLUENCING VACCINE RESPONSES. . . 2
Intrinsic Host Factors . . . 2
Age. . . 2
Sex . . . 5
Genetics. . . 5
Comorbidities . . . 5
Perinatal Host Factors. . . 10
Gestational age . . . 10
Birth weight. . . 12
Breastfeeding . . . 12
Maternal antibodies . . . 12
Maternal infections during pregnancy . . . 13
Other maternal factors . . . 14
Extrinsic Factors . . . 14
Infections. . . 14
Parasites . . . 16
Antibiotics, probiotics, and prebiotics . . . 16
Microbiota. . . 20 Preexisting immunity. . . 21 Behavioral Factors. . . 21 Smoking . . . 21 Alcohol consumption . . . 21 Exercise. . . 21
Acute psychological stress . . . 21
Chronic psychological stress. . . 24
Sleep. . . 24
Nutritional Factors . . . 24
Body mass index . . . 24
Nutritional status . . . 25
Micronutrients (vitamins A, D, and E and zinc) . . . 25
Enteropathy . . . 25
Environmental Factors . . . 25
Rural versus urban environment . . . 25
Geographic location . . . 27
Season. . . 27
Family size . . . 27
Toxins . . . 27
Vaccine Factors . . . 27
Vaccine type, product, and strain . . . 27
Adjuvants . . . 27 Vaccine dose . . . 29 Administration Factors . . . 29 Vaccination schedule . . . 29 Vaccination site . . . 29 Vaccination route. . . 29 Needle size. . . 30 Time of day . . . 30 Coadministered vaccines. . . 30 Coadministered drugs. . . 31 (continued)
Address correspondence to Petra Zimmermann, petra.zimmermann@mcri.edu.au.
http://doc.rero.ch
Published in "Clinical Microbiology Reviews 32(2): e00084-18, 2019"
which should be cited to refer to this work.
CONCLUDING REMARKS . . . 31
ACKNOWLEDGMENTS . . . 33
REFERENCES . . . 33
AUTHOR BIOS . . . 50
SUMMARY
There is substantial variation between individuals in the immune
re-sponse to vaccination. In this review, we provide an overview of the plethora of
studies that have investigated factors that influence humoral and cellular vaccine
re-sponses in humans. These include intrinsic host factors (such as age, sex, genetics,
and comorbidities), perinatal factors (such as gestational age, birth weight, feeding
method, and maternal factors), and extrinsic factors (such as preexisting immunity,
microbiota, infections, and antibiotics). Further, environmental factors (such as
geo-graphic location, season, family size, and toxins), behavioral factors (such as
smok-ing, alcohol consumption, exercise, and sleep), and nutritional factors (such as body
mass index, micronutrients, and enteropathy) also influence how individuals respond
to vaccines. Moreover, vaccine factors (such as vaccine type, product, adjuvant, and
dose) and administration factors (schedule, site, route, time of vaccination, and
coad-ministered vaccines and other drugs) are also important. An understanding of all
these factors and their impacts in the design of vaccine studies and decisions on
vaccination schedules offers ways to improve vaccine immunogenicity and efficacy.
KEYWORDS
antibodies, cellular, cytokines, humoral, immunization, immunoglobulin
INTRODUCTION
V
accination is the most cost-effective life-saving medical intervention and is
esti-mated to save at least 2.5 million lives each year (1,
2). Protection induced by
vaccinations is mediated through a complex interplay between innate, humoral, and
cell-mediated immunity (3,
4). Methods to quantify vaccine responses include
measur-ing geometric mean antibody titers (GMTs), seroconversion rates (SCRs), seroprotection
rates (SPRs), functional antibodies (by flow cytometric opsonophagocytosis assays),
antibody avidity, B and T cell activation, lymphoproliferation, and cytokine responses.
There is substantial variation between individuals in the immune response to
vaccina-tion, in both quantity and quality. For example, the antibody responses to yellow fever
(YF) vaccination vary
⬎10-fold between individuals (5), those to 7- and 13-valent
conjugated pneumococcal (PCV7 and PCV13) and Haemophilus influenzae type b (Hib)
vaccination up to 40-fold (6), and those to trivalent inactivated influenza vaccine (TIV)
(7) and hepatitis B (HepB) vaccination
⬎100-fold (6,
8). Similarly, cytokine responses to
Mycobacterium bovis bacillus Calmette-Guérin (BCG) vaccination vary up to 10-fold (
9).
Other examples of differences in the quality of vaccine responses include a lower
avidity of antibodies (10) or strength of cell-mediated immune responses (11) in
neonates. These variations in vaccine responses have consequences for both protective
efficacy and the duration of protection. Worryingly, a significant proportion of
vaccine-preventable infections occur in vaccinated individuals (12). It is estimated that large
numbers of vaccinated children are unprotected due to vaccine ineffectiveness,
includ-ing 77 million from tuberculosis (TB) (followinclud-ing BCG vaccination), 19 million from
measles, 18 million from poliomyelitis (following vaccination with inactivated polio
vaccine [IPV]), and 10 million from pertussis and from pneumococcus (13).
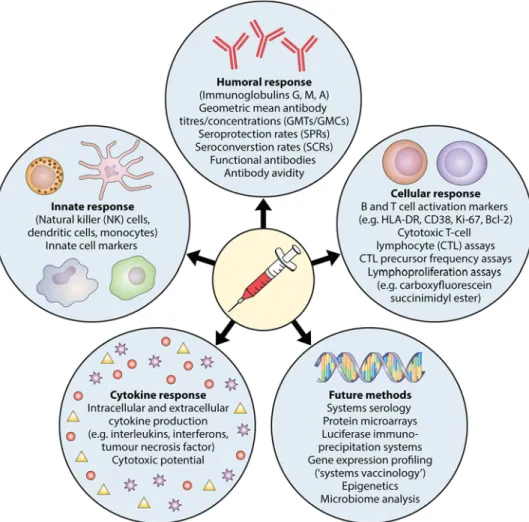
In this review, we provide a general overview of factors that influence the immune
response to vaccination (Fig. 1). A greater understanding of these factors offers
opportunities to improve vaccine immunogenicity and efficacy.
FACTORS INFLUENCING VACCINE RESPONSES
Intrinsic Host Factors
Age. Age is an important factor that influences vaccine responses, especially in the
extreme ages of life. Infants should receive immunizations as early as possible to
minimize the time that they are susceptible to infections. However, neonates have a
lower level of antibody production and, moreover, passively acquired maternal
anti-bodies interfere with vaccine responses (14; P. Zimmermann, K. Perrett, N. Messina, S.
Donath, N. Ritz, F. R. M. van der Klis, and N. Curtis, submitted for publication).
Additionally, cell-mediated immune responses are less strong, and the response to
T-independent polysaccharide antigens is poor (11). Studies in the 1950s sought to
establish the optimal age to start vaccination (15,
16). These studies showed, for
example, that oral polio vaccine (OPV) given during the first week of life leads to
adequate serum antibody responses in only 30% to 70% of infants but that, when it is
given after 4 to 8 weeks of age, it leads to adequate responses in nearly all infants (15).
Similarly, the diphtheria-tetanus-pertussis (DTP) vaccine is less effective when the first
dose is given within the first week of life than when it is given at 6 months of age (16)
(Table 1). Results of studies investigating the immunogenicity of BCG given at different
ages are conflicting, with some studies showing better immunogenicity when the
vaccine is given after the age of 2 months than when it is given at birth (17) and others
reporting lower immunogenicity when the vaccine is given at 4 months than when it
is given at birth (18). HepB vaccine given in the first year of life leads to lower long-term
antibody responses than those obtained when it is given later in childhood: only 40%
of adolescents who were HepB vaccinated at birth had antibody levels of
⬎10 mIU/ml
at the age of 15 years (19), and after a booster dose, antibodies rose above this
protective level in only half of individuals (19,
20). However, importantly, in contrast to
antibody levels, the number of memory B cells does not decrease over time (21), and
hence booster doses of this vaccine are not necessary.
The most-studied vaccine in relation to the effect of age on vaccine responses, by
far, is the measles vaccine (10,
22–48). A meta-analysis of 20 studies shows that the
proportion of infants seroconverting after one dose of measles vaccination increases
from 50% at 4 months of age to 85% at 8 months and that GMTs are lower in children
who receive their first dose before 9 months of age than in those who receive their first
dose at an older age (49). Additionally, antibodies wane significantly more quickly in
infants who receive the first dose of measles vaccine before the age of 9 months (49),
and antibodies have significantly lower avidity when the first dose of measles vaccine
is given before the age of 6 months than when it is given at 9 to 12 months of age (10).
FIG 1 Factors that influence the immune response to vaccination.
A recent large study summarizing randomized controlled trials (RCTs) shows that
children who receive their first measles vaccine before the age of 12 months have lower
SCRs and geometric mean concentrations (GMCs) than those of children who receive
their first measles vaccine after the age of 15 months (50). Lower antibody
concentra-tions persist after the second dose of measles vaccine (49,
50). In contrast, age at first
measles vaccination does not influence cellular responses: no differences in in vitro T
cell proliferation in response to measles virus were observed after starting vaccination
at 4, 6, 9, or 12 months (30,
37,
38,
51).
Despite the fact that many vaccines have lower immunogenicity in neonates, it has
been shown that for acellular pertussis (aP) (52,
53), BCG (54), HepB (55), and OPV (15)
vaccines, vaccination can be effective in the neonatal age group when adjuvants and
formulations are adapted to the function of the early immune system (56) (Table 1). The
early neonatal immune system shows suboptimal interaction between
antigen-presenting cells and T cells, leading to impairment of CD4 and CD8 T cell function and
a polarization toward T helper type 2 (Th2) cells (57) and toward induction of memory
B cells rather than antibody-secreting plasma cells (58,
59). T cells largely remain
unaffected by passively acquired maternal antibodies.
In addition to those in early life, vaccine responses are also diminished in the elderly,
who also have more rapid waning of antibodies. Elderly people have lower antibody
responses to diphtheria (60), hepatitis A (HepA) (61–65), HepB (61,
62,
66–81),
pneu-mococcal polysaccharide vaccine (PPV23) (82–84), TIV (85–87), tick-borne encephalitis
(TBE) (88), and tetanus (60,
88,
89) vaccination (Table 1). After vaccination with TIV,
elderly people also have lower cellular vaccine responses (85–87,
90). In contrast, one
study reports higher antibody responses to TIV vaccination in elderly people, with a
higher avidity of antibodies and slower antibody dissociation (91). Aging is
accompa-nied by a shift toward anti-inflammatory interleukin-10 (IL-10), which is associated with
a decline in CD8 T cells responsible for clearing influenza virus. Hence, adjuvants in TIV
that stimulate inflammatory cytokines and suppress the IL-10 response would
poten-tially enhance protection in this age group (92).
Notably, the influence of age on vaccine responses is not seen just at the extremes
of age. For example, antibody responses to TIV are higher in children of 2 to 4 years of
TABLE 1 Results with regard to age from studies investigating intrinsic host factors that influence vaccine responsesa
Type of response
Vaccine: measurement [reference(s)]
Effective when given at birth
Lower vaccine responses in neonates
and young infants Lower vaccine responses in elderly people
Humoral responses aP: GMTs (52,53) HepB: SPRs (55) OPV: SPRs (15) Diphtheria: SPRs (16) OPV: SPRs (15) Tetanus: SPRs (16) wP: SPRs (16) Diphtheria: SPRs (60) HepA: GMTs (61,63,65,142), SCRs (63,76), SPRs (61,62,65,142) HepB: GMTs (61,69,71,73,75,77), SCRs (70,71,75,80,110), SPRs (61,62,66–69, 72–75,77–79,81) PPV23: GMTs (82–84) TBE: GMTs (88) Tetanus: GMTs (88), SPRs (60,89) TIV: GMTs (87)
Cellular responses BCG: Th1, Th2, Treg responses (18)
BCG: CD4 T cell response (17) TIV: Th cell and cytotoxic T cell responses (86), lymphoproliferative responses (87) Cytokine responses BCG: IL-6 and IL-17
production (18)
TIV: IL-2 (85), IL-10 (87), and IFN-␥ (87) production
aAGGs, agglutinogens; aP, acellular pertussis; BCG, bacillus Calmette-Guérin; CD, cluster of differentiation; FHA, filamentous hemagglutinin; GMTs, geometric mean antibody titers; HepA, hepatitis A; HepB, hepatitis B; Hib, Haemophilus influenzae type b; HLA, human leukocyte antigen; HSV, herpes simplex virus; MHC, major histocompatibility complex; IFN, interferon; IL, interleukin; IPV, inactivated polio vaccine; MCV, meningococcal conjugate vaccine; MPV, meningococcal polysaccharide vaccine; OCV, oral cholera vaccine; OPV, oral polio vaccine; ORV, oral rotavirus vaccine; PCV7, 7-valent pneumococcal conjugate vaccine; PCV13, 13-valent
pneumococcal conjugate vaccine; PPV23, 23-valent pneumococcal polysaccharide vaccine; PRN, pertactin; PRR, pattern recognition receptor; PT, pertussis toxin; SCRs, seroconversion rates; SPRs, seroprotection rates; TBE, tick-borne encephalitis; TGF, transforming growth factor; Th, T helper; TIV, trivalent inactivated influenza vaccine; TLR, Toll-like receptor; TNF, tumor necrosis factor; Treg, T regulatory cell; wP, whole-cell pertussis.
age than in younger children (93), and GMTs after meningococcal conjugate vaccine
(MCV-C) vaccination are higher in children over the age of 10 years than in younger
children (94). The findings of studies that investigated the influence of age on vaccine
responses are summarized in
Table 1.
Sex. The findings across studies and meta-analyses investigating the effect of sex on
vaccine responses are largely consistent (Table 2). Females have higher antibody responses
to dengue (95), HepA (61–65,
96–104), HepB (61,
62,
66–78,
80,
100,
101,
105–117), Hib
(118), IPV (119), rabies (120–122), smallpox (123), and TIV (124–134) vaccination, while males
have higher antibody responses to diphtheria (135–138), MCV-A (139), PCV7 (140), PPV23
(83,
122,
140–144), and tetanus (88,
89,
119) vaccination. Additionally, females also have
higher cellular responses to a herpes simplex virus (HSV) vaccine that is not currently used
(145). Only a few studies report opposite findings, with higher antibody responses to
diphtheria (60,
146), PCV13 (118), and tetanus (60,
147) vaccination in females, higher
antibody responses to TIV (91) vaccination in males, or no difference between sexes in
antibody responses to rabies (148) vaccination (Table 2).
Notably, even though females have an overall tendency to have higher antibody
responses, faster waning of antibodies has been shown following HepA (103) and
PPV23 (83,
144) vaccination.
Studies investigating sex differences in response to the measles-mumps-rubella
(MMR) vaccine report less consistent findings. Some studies report higher GMTs or SPRs
after measles (149), mumps (150), and rubella (151) vaccination and higher cytokine
responses after measles (152) vaccination in females, while other studies report
tran-siently higher GMTs and lymphoproliferative responses after rubella (153) vaccination
and higher SCRs after measles (154) vaccination in males or no sex differences in GMTs
after mumps (155) and rubella (156) vaccination or cytokine responses after rubella
(156) vaccination (Table 2).
Reported sex differences in antibody responses to YF vaccine vary depending on the
vaccine used (157–159). Interestingly, 3 to 10 days after YF vaccination, expression of
660 genes changes in women, while only 67 genes are expressed differently in men
(160). Many of these differentially expressed genes are involved in the early innate
immune response (160).
Genetics. Different ethnic groups living in the same location have varied responses
to vaccination (64,
89,
161–166) and decline of antibodies (89), indicating a genetic
influence on vaccine responses. Studies of twins estimate the degree of heritability to
be 36 to 90% for humoral responses (167–173) and 39 to 90% for cellular responses,
depending on the specific vaccine (167,
169) (Table 3).
One mechanism identified with variations in humoral (150,
174–190) and cellular
(145,
150,
186,
191) vaccine responses is polymorphism in major histocompatibility
complex (MHC) genes (summarized in
Table 3). Further genetic factors are
polymor-phisms in pattern recognition receptors (PRRs), such as Toll-like receptor (TLR) or
RIG-like receptor (RLR) genes (192–195) (Table 3). In addition, many single-nucleotide
polymorphisms (SNPs) in other genes, for example, those coding for cytokines or
cytokine, viral, or vitamin receptors, are also associated with variations in vaccine
responses (182,
190,
192,
193,
196–211) (Table 3). Further, different expression levels of
genes also influence vaccine responses. For example, individuals with increased
ex-pression of genes involved in early interferon signaling, antigen processing, and
antigen presentation have higher antibody responses to TIV (194,
212).
Blood group antigens are important receptors or coreceptors for microorganisms.
Additionally, they can also modify the innate immune response to infection (213). It is
therefore likely that blood group antigens influence responses to vaccination. It has
been suggested that a cholera subunit-killed oral vaccine is less efficient in individuals
with blood group O (214,
215). In contrast, the oral cholera vaccine (OCV) has been
reported to induce higher antibody concentrations in individuals with blood group O
(216). This has not, however, been a consistent finding (217).
Comorbidities. Numerous studies have investigated vaccine responses in children
with celiac disease (CD) (218–233) (Table 4). Most found that children with CD have
TABLE 2 Results with regard to sex from studies investigating intrinsic host factors that influence vaccine responses
Type of response
Vaccine and age group: measurement [reference(s)] Higher vaccine responses in
females
Higher vaccine responses in males
No difference in vaccine responses between females and males
Inconsistent findings in vaccine responses between females and males
Humoral responses Dengue
Adults: GMTs (95) Diphtheria Adults: SPRs (60), GMTs (146) HepA Children: GMTs (63,142), SCRs (63), SPRs (142) Adults: GMTs (63,65,96–101, 142), SCRs (63,101,106), SPRs (65,101,103,142)
Adults with chronic liver
disease: GMTs (102), SCRs (102) HIV-positive adults: SPRs (104) Elderly: GMTs (61), SPRs (61,62) HepB Infants: GMTs (116) Children: GMTs (114,115,117) Adolescents: GMTs (105), SCRs (105) Adults: GMTs (69–71,73,76, 80,100,101,107,111), SCRs (70,71,76,80,101), SPRs (67–69,72–75,77,78, 101,107,110,111,113) Adults on hemodialysis: SCRs (112) Diabetic adults: GMTs (108, 109), SPRs (108) Elderly: GMTs (61), SPRs (61) Hib Infants: GMTs (118) IPV Adults: SPRs (119) Measles Adolescents: GMTs (149) Mumps Children: GMTs (150) PCV13 Infants: GMTs (118) Rabies Children: SCRs (122) Adults: GMTs (120,121) Rubella Children: SPRs (151) Adults: SPRs (151) Smallpox Adults: GMTs (123) Tetanus Adults: GMTs (60), SPRs (60), titers (147) TIV Adults: GMTs (90,124,126, 127,129,131,133,134), SPRs (90,129,133,134) Elderly: GMTs (125,130,132), SCRs (130), SPRs (128) Diphtheria Adolescents: titers (137) Adults: titers (135) Elderly: GMTs (138) MCV-A Adolescents: GMTs (139) Measles Infants: SCRs (154) PCV7 Elderly: GMTs (140) PPV23 Children: SCRs (122) Adult alcoholics: GMTs (142) Elderly: GMTs (83,140, 141,143,144) Rubella Adolescents: GMTs (153) Tetanus Children: SPRs (89) Adults: GMTs (88), SPRs (89,119) TIV Adults: GMTs (91) Mumps Children: GMTs (155) Rabies Children: GMTs (148) Adults: GMTs (148) Rubella Children: GMTs (156) YF Adults: GMTs (158,159), SCRs (159), SPRs (157, 158) Cellular responses HSV
Adults: CD4 T cell responses
(145)
Rubella Adolescents:
lymphoproliferative
responses (153)
Cytokine responses Measles
Children: IL-6 (152), IFN-␥
(152), and TNF-␣ (152) production Rubella Children: IL-10 (156) and IFN-␥ (156) production
http://doc.rero.ch
TABLE 3 Results with regard to genetics from studies investigating intrinsic host factors that influence vaccine responses Type of response Vaccine (estimated degree of heritability in vaccine responses [%]) [reference(s)] Variation in vaccine response and vaccine: MHC genes for which polymorphisms have been identified to be associated with variation in vaccine response [reference(s)] Variation in vaccine response and vaccine: PRR genes for which polymorphisms have been identified to be associated with variation in vaccine response [reference(s)] Variation in vaccine response and vaccine: proteins for which single-nucleotide polymorphisms in genes are associated with variations in vaccine responses [reference(s)] Humoral responses aP (53– 65) ( 169 ) Diphtheria (49) ( 169 ) HepA (36) ( 170 ) HepB (61–91) ( 169–171 ) Hib (51) ( 172 ) Measles (90) ( 167 , 168 ) Mumps (39) ( 168 ) OPV (60) ( 169 ) Rubella (46) ( 168 ) Tetanus (44) ( 169 ) Varicella (45) ( 173 ) Higher antibody production HepB: HLA-DQB1 *05 ( 178 ), HLA-DQB1 *0602 ( 178 ), HLA-DQB1 *0603 ( 178 ), HLA-DRB1 *0102 ( 178 ), HLA-DRB1 *0103 ( 178 ), HLA-DRB1 *02 ( 176 ), HLA-DRB1 *1301 ( 177 , 178 ), HLA-DRB1 *15 ( 178 ), HLA-DR7; DQ2, DR4; DQ3, DR15; DQ6, DR3; DQ2 ( 55 ) Rubella: HLA-A *02-C *03-B *15-AAAACGGGGC-DRB1 *04-DQA1 *03-DQB1 *03-DPA1 *01-DPB1 *04 ( 190 ), A *02-C* 03-B *15-DRB1 *04-DQA1 *03-DQB1 *03-DPA1 *01-DPB1 *04 ( 190 ), HLA-DPB1, rs2064479 ( 188 ) TIV: HLA-DPB1 *0401 ( 187 ), HLA-DQB1 *0603 ( 186 ), HLA-DRB1 *040 ( 187 ) Lower antibody production HepB: C4ADel ( 181 ), C4AQ0 ( 179–181 ), HLA-B8, SC01, DR3 ( 235 ), HLA-DPB *0201 ( 180 ), HLA-DRA, rs5000563 ( 182 ), HLA-DRB1 *07(01) ( 174 , 176 , 177 , 180 , 181 ), HLA-DQA1 *0201 ( 180 ), HLA-DQB1 *0102 ( 178 ), HLA-DQB1 *02(01) ( 174 , 175 , 179 , 180 ), HLA-DQB1 *0604 ( 178 ), HLA-DRB1 *03 ( 177 , 181 ), HLA-DRB1 *1301 ( 181 ), HLA-DRB1 *1302 ( 178 ), HLA-DR3 (extended B8, SC01) ( 183 , 184 ), HLA-DR7 (extended B44, FC31) ( 184 ) Measles: HLA-DPA1 *0201 ( 185 ), HLA-DRB1 *03 ( 185 ) Mumps: HLA-DQB1 *0303 ( 150 ), HLA-A *29-Cw *16-B *44 ( 569 ) Rubella: DRB1 *13-DQA1 *01-DQB1 *06-DPA1 *01-DPB1 *04 ( 190 ), DRB1 *15/16-DQB1 *06-DPB1 *03 ( 569 ), DRB1 *04-DQB1 *03-DPB1 *03 ( 569 ) TIV: HLA-DRB1 *07 ( 186 ) Higher antibody production MCV-C: TRL3 ( 193 ) Lower antibody production Measles: TLR3 ( 192 ) Variations in antibody production Diphtheria: IL-10 ( 196 ) HepB: FOXP1 ( 182 ), IL-4 ( 197 ), IL-4R ( 197 ), IL-10 promotor ( 198 ), IL-12B ( 196 ), TNF-␣ ( 196 ) TIV: IL-28B ( 199 ) Measles: CD46 ( 200 , 201 ), CD209 ( 200 ), IL-2 ( 202 ), IL-6 ( 192 ), IL-7R ( 203 ), IL-10 ( 202 , 203 ), IL-12RB ( 202–204 ), SLAM ( 201 ), TNF-␣ ( 192 ) MCV-C: CD44 ( 193 ) Mumps: IL-10RA, IL-12RB1 ( 150 ) PCV7/PPV23: IL-1  ( 196 ), IL-4 ( 205 ), IL-4R ( 196 , 205 ), IL-10 ( 196 ), IL-12RB1 ( 196 ), IL-13 ( 196 , 205 ) Rubella: CD209/DC-SIGN ( 206 ), IL-6 ( 206 ), leukocyte specific transcript 1 ( 190 ), lymphotoxin alpha ( 190 , 207 ), MOG ( 206 ), PVR ( 206 ), PVRL2 ( 206 ), RARB ( 206 ), TNF-␣ ( 190 ) Smallpox: IL-18 ( 208 ) Tetanus: IL-4R ( 196 ) Cellular responses Higher lymphoproliferative responses Measles: HLA-A *26-Cw *12-B *28 ( 569 ), DRB1 *03-DQB1 *02-DPB1 *04 ( 569 ), DRB1 *04-DQB1 *03-DPB1 *03 ( 569 ) Mumps: HLA-B *1302 ( 150 ), HLA-B *3701 ( 150 ), HLA-B* 3801 ( 150 ), HLA-DQA1 *0101 ( 150 ), HLA-DQA1 *0105 ( 150 ), HLA-DQB1 *0201 ( 150 ), HLA-DRB1 *0101 ( 150 ), HLA-DRB1 *0701 ( 150 ), HLA-DRB1 *1001 ( 150 ), HLA-A *26-Cw *12-B28 ( 569 ), DRB1 *03-DQB1 *02-DPB1 *04 ( 569 ) Rubella: DRB1-DQA1-DQB1-DPA1-DPB1 *13- *01- *06- *01-*03, DRB1-DQA1-DQB1-DPA1-DPB1 *03- *05- *02- *01-*04 ( 191 ), DRB1 *04-DQB1 *03-DPB1 *03 ( 569 ), DRB1 *04-DQB1 *03-DPB1 *03 ( 569 ) Lower lymphoproliferative responses HepB: HLA-Bw54-DR4-DRw53-SQw4 ( 570 , 571 ) Mumps: HLA-DQA1 *0401 ( 150 ), HLA-DQA1 *0501 ( 150 ), HLA-DRB1 *0301 ( 150 ), HLA-DRB1 *0801 ( 150 ), HLA-DRB1 *1201 ( 150 ), HLA-DRB1 *1302 ( 150 ) Lower lymphoproliferative responses Measles: TLR3 ( 192 ) Variations in lymphoproliferative responses Measles: IL-2 ( 202 ), IL-10 ( 202 ), IL-12RB ( 202 ) Mumps: IL-10RA, IL-12RB1 ( 150 ) (Continued on next page)
http://doc.rero.ch
TABLE 3 (Continued) Type of response Vaccine (estimated degree of heritability in vaccine responses [%]) [reference(s)] Variation in vaccine response and vaccine: MHC genes for which polymorphisms have been identified to be associated with variation in vaccine response [reference(s)] Variation in vaccine response and vaccine: PRR genes for which polymorphisms have been identified to be associated with variation in vaccine response [reference(s)] Variation in vaccine response and vaccine: proteins for which single-nucleotide polymorphisms in genes are associated with variations in vaccine responses [reference(s)] Cytokine responses BCG (39 – 46) ( 169 ) Measles (90) ( 167 ) Pertussis (53– 65) ( 169 ) Tetanus (64) ( 169 ) Higher IFN-␥ production Rubella: A *02-C *07-B *07 ( 191 ), A *03-C *04-B *35 ( 191 ), DRB1 *03-DQA1 *05-DQB1 *02-DPA1 *01-DPB1 *03 ( 191 ) Higher IL-2 production Rubella: DRB1 *04-DQA1 *03-DQB1 *03-DPA1 *01-DPB1 *02 ( 191 ), DRB1 *04-DQA1 *03-DQB1 *03-DPA1 *01-DPB1 *04 ( 191 ) Higher IL-4 production Rubella: DRB1 *15-DQA1 *01-DQB1 *06-DPA1 *01-DPB1 *02 ( 191 ), DRB1 *07-DQA1 *02-DQB1 *02-DPA1 *02-DPB1 *11 ( 191 ) Higher IL-5 production Rubella: A *02-C *07-B *08 ( 191 ) Higher IL-6 production Rubella: A *24-C *07-B *07 ( 191 ) Higher IL-10 production Rubella: DRB1 *03-DQA1 *05-DQB1 *02-DPA1 *01-DPB1 *02 ( 191 ) Higher IL-12p40 production Rubella: A *03-C *03-B *40 ( 191 ), A *03-C *07-B *07 ( 191 ), DRB1 *07-DQA1 *02-DQB1 *03-DPA1 *01-DPB1 *04 ( 191 ) Higher TNF-␣ production Rubella: A *01-C *07-B *08-DRB1 *03-DQA1 *05-DQB1 *02-DPA1 *01-DPB1 *04 ( 190 ), A *29-C *16-B *44 ( 191 ) Lower TNF-␣ production Rubella: DRB1 *13-DQA1 *01-DQB1 *06-DPA1 *01-DPB1 *03 ( 191 ) Lower IL-2 production Rubella: DRB1 *13-DQA1 *01-DQB1 *06-DPA1 *01-DPB1 *03 ( 191 ) Lower IL-5 production Rubella: DRB1 *11-DQA1 *05-DQB1 *03-DPA1 *01-DPB1 *02 ( 191 ) Lower IL-6 production Rubella: DRB1 *03-DQA1 *05-DQB1 *02-DPA1 *01-DPB1 *04 ( 191 ), AAACGGGGC-DRB1 *01-DQA1 *01-DQB1 *05-DPA1 *01-DPB1 *04 ( 190 ) Lower IL-10 production Rubella: DRB1 *03-DQA1 *05-DQB1 *02-DPA1 *01-DPB1 *04 ( 191 ) Lower IL-12p40 production Rubella: A *02-C *03-B *40 ( 191 ) Higher granulocyte-macrophage colony-stimulating factor (GM-CSF) production Rubella: TLR3 ( 194 ) Higher IL-2 production BCG: TLR1, TLR6 ( 195 ) Higher IL-4 production Measles: TLR4 ( 192 ) Higher IFN-␥ production BCG: TLR1, TLR6 ( 195 ) Measles: TLR5 ( 192 ), TLR6 ( 192 ) Rubella: RIG-I ( 194 ) Lower IL-10 production Rubella: RIG-I ( 194 ) Lower IFN-␥ production Rubella: TLR3 ( 194 ) Lower TNF-␣ production Rubella: TLR3 ( 194 ) Variations in GM-CSF production Rubella: RIG-I ( 194 ), TLR3, TLR4 ( 194 ) Variations in IL-2 production Rubella: TLR3 ( 194 ), RIG-I ( 194 ) Variations in IL-2 production Rubella: RIG-I ( 194 ) Variations in TNF-␣ production Rubella: RIG-I ( 194 ) Variations in GM-CSF production Rubella: CASP8 ( 194 ), RARB ( 194 ), TRIM5 ( 194 ), TRIM22 ( 194 ) Variations in IL-2 production Rubella: RARA ( 194 ), RARB ( 194 ), TRIM5 ( 194 ), TRIM22 ( 194 ) Variations in IL-4 production TIV: IL-28B ( 199 ) Variations in IL-6 production Measles: CD46 ( 200 ) Rubella: ADAR ( 210 ), PVR ( 210 ), TRIM22 ( 194 ) Variations in IL-10 production Measles: SLAM ( 200 ) Rubella: RARB ( 194 ), RXRA ( 194 ) Variations in IFN-␣ production Measles: CD46 ( 200 , 201 ) Variations in IFN-␥ production Rubella: ACO1 ( 211 ), butyrophilin ( 210 ), IL-10RB/IFNAR1 ( 210 ), PTPRD ( 211 ), RARB ( 194 ), RARG ( 194 ), TRIM22 ( 194 ) Measles: IL-2 ( 203 ), IL-7R ( 203 ), IL-10 ( 203 ), IL-12RB ( 204 ), SLAM ( 200 ), DC-SIGN promotor ( 209 ) Variations in TNF-␣ production Measles: CD46 ( 200 ) Rubella: TRIM5 ( 194 ), VDR ( 194 )
http://doc.rero.ch
lower antibody responses to HepB vaccination (218–228,
231–233), with more rapid
waning of antibodies (227). A meta-analysis shows that, in retrospective studies, the
SCR to HepB vaccination in children with CD is 54%, and that in prospective studies is
66% (compared to 95% in healthy individuals) (234). It has been postulated that the
presence of HLA-DQ2 or -DQ8, which confers a genetic predisposition to CD, may be
the driver of the lower responses to HepB vaccination in CD patients. However, the
presence of HLA-DQ2 is associated with higher antibody responses to HepB vaccination
TABLE 4 Results with regard to comorbidities from studies investigating intrinsic host factors that influence vaccine responses
Type of response
Variation in vaccine response, vaccine, age group, measurement [reference(s)]
Celiac disease Diabetes mellitus
Chronic renal failure
requiring hemodialysis Chronic liver failure
Humoral responses Lower antibody production HepA Children: SPRs (225) HepB Infants: SPRs (221) Children: SPRs (219, 220,222–226,228, 231,233) Adults: GMTs (227), SPRs (218,227) No difference in antibody production HepA Children: GMTs (229), SPRs (229) HepB Children: GMTs (219, 232), SPRs (232) Adults: GMTs (232), SPRs (232) Hib Children: SPRs (219) Measles Children: GMTs (232), SPRs (232) Adults: GMTs (232), SPRs (232) Rubella Children: SPRs (219) Tetanus Children: SPRs (219) TIV Children: GMTs (230), SPRs (230)
Lower antibody production HepB Children: GMTs (232, 238), SPRs (232, 237–239) Adults: GMTs (232,243– 245), SPRs (242–245) Measles Children: SPRs (241) Monovalent influenza vaccine Adults: SCRs (90), SPRs (90) PPV23 Children: SPRs (240) Rubella Children: GMTs (241) No difference in antibody production Diphtheria Children: GMTs (240, 241) Hib Children: GMTs (240) HepB Children: GMTs (572), SPRs (232,572) Adults: GMTs (572), SPRs (232,572) Elderly: SPRs (248) Measles Children: GMTs (232, 241), SPRs (232) Adults: GMTs (232), SPRs (232) Rubella Children: SPRs (241) PCV7 Children: GMTs (240) Pertussis Children: SPRs (241) Tetanus Children: GMTs (240, 241)
Lower antibody production Diphtheria Adults: SPRs (250) HepB Adults: SPRs (252) IPV type 2 Children: GMTs (260) Tetanus Adults: GMTs (249), SPRs (249,250) TIV Adults: GMTs (473), SPRs (473) No difference in antibody production IPV type 1 Children: GMTs (260), SPRs (260) IPV type 2 Children: SPRs (260) IPV type 3 Children: GMTs (260), SPRs (260) Faster weaning of antibodies Diphtheria Adults: (254) HepB Adults: (252,255) Tetanus Adults: (251)
Higher antibody production Diphtheria Children: GMTs (260) IPV type 1 Children: GMTs (260) IPV type 3 Children: GMTs (260) Lower antibody production
HepA Children: GMTs (265) Adults: GMTs (102,261, 262), SPRs (263, 264) HepB Adults: GMTs, SPRs (242) Children: GMTs (265), SPRs (263,265) No difference in antibody production Diphtheria Children: SPRs (260) HepA Children: SPRs (265) Adults: SPRs (102,263) IPV type 1 Children: SPRs (260) IPV type 2 Children: GMTs (260), SPRs (260) IPV type 3 Children: SPRs (260) Tetanus Children: GMTs (260), SPRs (260)
Cytokine responses Lower cytokine production Tetanus Children: IL-4 (219,573) No difference in cytokine responses TIV Children: IL-2 (247), granzyme B (247)
http://doc.rero.ch
(55). Nevertheless, HLA-DR3, -DR4, and -DR7, which can also be found in patients with
CD (229) and patients with diabetes mellitus (DM), are associated with lower responses
to HepB vaccination (183,
184,
235). Children with CD and DM have lower SPRs after
HepB vaccination than those of children that have DM only (228), suggesting that
gluten might be a factor in decreasing HepB vaccine efficacy, and some studies suggest
that the response rate to HepB vaccination correlates with gluten intake (220,
223).
Children with CD who are on a strict gluten-free diet have no difference in SPRs to HepB
vaccination compared to those of healthy children (222,
226). Apart from lower
antibody responses to HepB vaccination, one study also showed that CD patients are
less responsive to HepA vaccination (225). However, another study did not find a
difference in antibody responses to HepA vaccination in CD patients compared to
healthy controls (229). There is also no difference in antibody responses to tetanus
(219), measles (236), rubella (219), Hib (219), and TIV (230) vaccination between children
with CD and healthy children.
Children with DM have lower antibody responses to HepB (232,
237–239)
vaccina-tion, and possibly PPV23 (240), rubella (241), and measles (241) vaccinavaccina-tion, but not to
diphtheria (240,
241), Hib (240), PCV7 (240), pertussis (241), or tetanus (240,
241)
vaccination. Adults with DM also have lower antibody responses to HepB (242–245)
vaccination. Adding selenium to the HepB vaccine can increase antibody responses in
patients with DM (246). It is unclear whether DM influences the antibody response to
TIV vaccination. Some studies report lower responses after vaccination with a
monova-lent influenza vaccine in adults (90), while studies of elderly people with type II DM
show no difference in antibody or cytokine responses to TIV vaccination (247,
248)
(Table 4).
Adults with chronic renal failure who are on hemodialysis have lower antibody
responses to diphtheria (249–251), HepB (252–255), and tetanus (249–251) vaccination,
with faster waning of antibodies (252–255), especially when they suffer from additional
diabetes mellitus (256–259). Children on hemodialysis have lower antibody responses
to poliovirus type 2 (260). SPR after HepB vaccination is inversely associated with
glomerular filtration rate (253). Factors responsible for lower vaccine responses in
patients with chronic renal failure include malnutrition, uremia, and a generalized
immunosuppressive state. Patients with chronic renal failure benefit from an increased
vaccination dose (259).
Adults with chronic liver disease have lower GMTs after HepA vaccination (102,
261,
262) (with similar SPRs [102,
262] or lower SPRs [263,
264]) and lower GMTs and SPRs
after HepB vaccination (242) than those of healthy adults. Children with chronic liver
disease also have lower GMTs (265) and SPRs (263,
265) after HepB vaccination (265),
with no difference in SCRs. However, in contrast, they have higher antibody responses
to IPV and diphtheria (260) vaccination (Table 4).
Perinatal Host Factors
Gestational age. Preterm infants are at increased risk of infections, including
vaccine-preventable infections. Differences in the immune system which render
pre-term infants less responsive to vaccination include diminished pathogen recognition by
dendritic cells and macrophages and diminished T cell activity (especially Th1 activity)
and diminished B cell interaction with T cells (266). Variations in vaccine responses
between term and preterm infants depend on the specific vaccine. In comparison to
those of term infants, preterm infants have significantly lower antibody levels after the
first dose of DTP (267). Significantly lower GMTs also persist after primary immunization
with three doses for diphtheria (268), HepB (268–270), Hib (269,
271–275), PCV7 (276,
277), poliovirus type 3 (269), and pertussis (267,
268,
278–280) vaccines. However,
preterm infants reach sufficient SPRs for most vaccines (Table 5), with the notable
exception of responses to HepB (269), Hib (269,
271–275), pertussis (279), and poliovirus
type 3 (281) vaccines. In addition to having lower GMTs and SPRs, preterm infants can
also have quicker waning of antibodies, as shown for antibodies produced in response
to MCV-C (282) vaccination.
TABLE 5 Results with regard to infant factors from studies investigating perinatal factors that influence vaccine responses
Type of response
Timing of response, vaccine response, vaccine, age, measurement [reference(s)]
Gestational age Birth weight Feeding
Humoral responses After primary immunization with 3 doses (*2 doses)
Higher antibody production in preterm infants than in term infants
PCV7
⬍37 weeks: GMTs (277) for serotypes 19F, 9V, and 4
Lower antibody production in preterm infants than in term infants Diphtheria 31–35 weeks: GMTs (268) ⬍31 weeks: GMTs (268) HepB 24 –36 weeks: GMTs (269), SPRs (269) ⬍31 weeks: GMTs (268) ⬍35 weeks: GMTs (270) Hib 24 –36 weeks: GMTs (269,271,272), SPRs (269, 271,272) ⬍32 weeks: GMTs (271,273), SPRs (271,273) 23–32 weeks: GMTs (274),* SPRs (274)* ⬍30 weeks: GMTs (275), SPRs (275) PCV7 ⬍37 weeks: GMTs (276) IPV type 3 24 –36 weeks: GMTs (269) ⬍29 weeks: SPRs (281) Pertussis AGGs 2 and 3 ⬍37 weeks: GMTs (278) aP 28 –34 weeks: GMTs (267) FHA 25–35 weeks: GMTs (279), SPRs (279) PCT 31–35 weeks: GMTs (268) ⬍31 weeks: GMTs (268) PT ⬍32 weeks: GMTs (280) 25–35 weeks: GMTs (279), SPRs (279) ⬍31 weeks: GMTs (268)
No difference in antibody production between preterm and term infants
Diphtheria 24 –36 weeks: GMTs, SPRs (269) ⬍32 weeks: GMTs (280) 28 –34 weeks: SPRs (267) ⬍37 weeks: GMTs, SPRs (278) 25–35 weeks: SPRs (268) Hib ⬍29 weeks: GMTs (281), SPRs (281) MCV-C ⬍32 weeks: GMTs (273), SPRs (273) 32–36 weeks: GMTs (282) OPV ⬍36 weeks: SPRs (574) IPV type 1 24 –36 weeks: GMTs, SPRs (269) ⬍29 weeks: GMTs (281), SPRs (281) IPV type 2 24 –36 weeks: GMTs, SPRs (269) ⬍29 weeks: GMTs (281), SPRs (281) IPV type 3 24 –36 weeks: SPRs (269) ⬍29 weeks: GMTs (281) Pertussis AGGs 2 and 3 ⬍37 weeks: SPRs (278) aP 28 –34 weeks: SPRs (267) FHA 24 –36 weeks: GMTs, SPRs (269) ⬍32 weeks: GMTs (280) ⬍37 weeks: GMTs, SPRs (278) PCT 25–35 weeks: SPRs (268)
After primary immunization with 3 doses
Lower antibody production in VLBW infants than in LBW infants Pertussis (PT): GMTs (285), SPRs (285) Hib: SPRs (285)
IPV type 3: GMTs (285) Lower antibody production in LBW
infants than in infants with a normal birth weight HepB: SPRs (286) Hib: SPRs (272)
No difference in antibody production between VLBW and LBW infants Diphtheria: GMTs (285), SPRs (285) HepB: GMTs (285), SPRs (285) IPV type 1: GMTs (285), SPRs (285) IPV type 2: GMTs (285), SPRs (285) IPV type 3: SPRs (285) Pertussis FHA: GMTs (285), SPRs (285) PRN: GMTs (285), SPRs (285) PT: GMTs (285), SPRs (285) Tetanus: GMTs (285), SPRs (285) No difference in antibody production
between VLBW and LBW/normal-birth-weight infants
Pertussis
FHA: GMTs (279) PT: GMTs (279)
No difference in antibody production between LBW and normal-birth-weight infants
PCV7: GMTs (277), SPRs (277) Measles: SCRs (287)
After a booster at 18 –24 months
Lower antibody production in VLBW infants than in LBW infants Diphtheria: GMTs (285) HepB: GMTs (285), SPRs (285) No difference in antibody production
between VLBW and LBW infants Diphtheria: SPRs (285) IPV type 1: GMTs (285), SPRs (285) IPV type 2: GMTs (285), SPRs (285) IPV type 3: SPRs (285) Pertussis FHA: GMTs (285), SPRs (285) PRN: GMTs (285), SPRs (285) PT: GMTs (285), SPRs (285) Tetanus: GMTs (285), SPRs (285)
Higher antibody production in breastfed than in formula-fed infants Diphtheria: IgA % standard plasma in
saliva (292), IgG % standard plasma in serum (292)
Hib: IgA median antibody titer in serum (291), IgM median antibody titer in serum (291), IgG median antibody titer in serum (291), IgG GMTs in serum (290)
OPV: IgA % standard plasma in saliva (292), IgG % standard plasma in serum (289,292), IgM % standard plasma in stool (292)
Tetanus: IgA % standard plasma in saliva (292), IgM % standard plasma in stool (292)
Lower responses in breastfed infants than in formula-fed infants OPV: SCRs (295)
(Continued on next page)
Preterm infants have lower vaccine responses not only after primary immunization
but also after booster doses. At 2 to 3 years of age, they have lower antibody responses
to HepB (270,
283), Hib (283), and poliovirus type 3 (283) vaccination, and at the age of
5 years, they have lower responses to HepB (283) and pertussis (284) vaccination, as
well as reduced lymphoproliferation and cytokine responses in the latter case.
Birth weight. One month after the third dose of DTaP-Hib-IPV-HepB vaccination
given at 2, 4, and 6 months, very-low-birth-weight (VLBW; less than 1.5 kg) infants have
significantly lower GMTs to aP and poliovirus type 3 and lower SPRs to Hib than infants
with a low birth weight (LBW; 1.5 to 2 kg), while both groups have similar GMTs and
SPRs after diphtheria, tetanus, and HepB (285) vaccination. However, 1 month after a
booster dose given at the age of 18 to 24 months, the SPR to HepB in VLBW infants is
lower than that in LBW infants, and there is a trend toward lower GMTs for all other
vaccine components (285) (Table 5). Similarly, 1 month after completing a 3-dose HepB
schedule given at 0, 1, and 6 months, LBW infants have lower GMTs to HepB vaccine
than infants with a normal birth weight (286). A decreasing birth weight is associated
with a progressive reduction in antibody responses to Hib (272) vaccination. However,
there is no difference in GMTs after a 3-dose schedule of PCV7 vaccine between LBW
infants and infants with a normal weight (277) and no correlation between birth weight
and SCRs after measles vaccination (287).
In one study, the antibody response to Salmonella enterica serovar Typhi vaccination
(but not rabies vaccination) in adults was reported to be related to birth weight (288).
Breastfeeding. After routine vaccination, compared to formula-fed infants,
breastfed infants have higher serum IgG levels after diphtheria (289), Hib (290,
291), and
OPV (289,
292) vaccination, higher salivary IgA levels after tetanus, diphtheria, and OPV
vaccination (289), and higher stool IgM levels after tetanus and OPV vaccination (289)
(Table 5).
While one meta-analysis summarizing studies on the effect of breastfeeding on the
antibody response to oral rotavirus vaccine (ORV) reports reduced SCRs in breastfed
infants in all included studies (293), another meta-analysis reports decreased responses
in only 3 of 16 studies (294). However, in all the included studies, only one dose of ORV
was given, and infants with mixed feeding were sometimes classified as breastfed and
sometimes as nonbreastfed. More recent studies show that higher levels of
rotavirus-specific IgA in breast milk lead to lower SCRs in infants after ORV (a 2-fold increase is
associated with a 22% decrease in SCR) (295). IgA levels in breast milk depend on
geographic location: Indian women have higher levels than those in Korean and
Vietnamese women and American women (296). Additionally, the neutralizing activity
of IgA in breast milk from Indian women is higher than that in breast milk from
American women (296). Three studies investigating withholding breastfeeding for an
hour before and after ORV showed no effect on rotavirus-specific IgA SCRs in infants
(297–299).
Maternal antibodies. Preexisting maternal antibodies inhibit infant antibody
re-sponses to vaccination (14) (Table 6). After primary immunization, a 2-fold higher
TABLE 5 (Continued)Type of response
Timing of response, vaccine response, vaccine, age, measurement [reference(s)]
Gestational age Birth weight Feeding
PRN 24 –36 weeks: GMTs, SPRs (269) ⬍32 weeks: GMTs (280) PT 24 –36 weeks: GMTs (269), SPRs (269) ⬍37 weeks: GMTs, SPRs (278) Tetanus 24 –36 weeks: GMTs (269), SPRs (269) ⬍29 weeks: GMTs (281), SPRs (281) ⬍32 weeks: GMTs (280) 28 –34 weeks: SPRs (267) ⬍37 weeks: GMTs, SPRs (278)
http://doc.rero.ch
maternal antibody level results in approximately one-fourth lower postvaccination
GMTs in infants (28% to IPV, 24% to diphtheria, 22% to pertactin, and 13% to tetanus).
Maternal antibodies also influence infant vaccine responses after booster doses in the
second year of life (14).
A meta-analysis summarizing 16 studies investigating the influence of maternal
antibodies on responses to measles vaccination shows that the presence of maternal
antibodies decreases SCRs, on average, by 33.2% (49). However, maternal antibodies to
measles virus in infants decrease quickly, and by the age of 5 months, only 12% of
infants have protective levels. Maternal age is the only factor associated with maternal
measles antibody levels (300,
301), while maternal weight has no influence (300).
Measles-vaccinated women have significantly lower GMTs than those of women with
naturally acquired immunity (301,
302).
Maternal antibodies against HepA in infants remain high during the first 6 months
but then drop quickly, with only approximately 37% of infants having protective titers
by the age of 12 months (303,
304). When the HepA vaccine is given to infants within
the first 6 months of life, GMTs in those without maternal antibodies are significantly
higher at the age of 12 to 15 months than those in infants with maternal antibodies.
However, there is no difference in SPRs (305,
306). For ORV, transplacental transfer of
maternal antibodies (307–309) and transfer of antibodies through breast milk (295,
296,
310) lead to decreased infant vaccine responses, in a dose-dependent matter.
The amount of maternal antibodies transferred to infants depends on several
factors, including maternal antibody levels, IgG subclass, gestational age, and placental
characteristics (311). The transfer of maternal antibodies can be optimized by maternal
vaccination during pregnancy. This strategy is currently recommended for vaccination
against tetanus, pertussis, and influenza. However, appropriate timing of vaccination
during pregnancy is important. For example, Tdap given during the second trimester of
pregnancy leads to significantly higher neonatal antibodies than those obtained when
it is given during the third trimester (312).
Maternal infections during pregnancy. Most studies do not find an association
between maternal infection with filariae, hookworm, malaria parasites, Mansonella
perstans, or Schistosoma mansoni during pregnancy and infant antibody responses to
diphtheria (313,
314), HepB (313–315), Hib (314), pertussis (314), and tetanus (313,
316)
vaccination. However, one study shows that maternal infection with malaria parasites,
filariae, or hookworm is independently associated with lower infant antibody responses
to Hib vaccination (313), while another study shows that maternal infection with S.
mansoni is associated with lower infant antibody responses to HepB vaccination (
317).
Maternal malaria during pregnancy is associated with lower infant SPRs after measles
vaccination (318). The presence of multiple maternal infections is associated with lower
TABLE 6 Results with regard to maternal factors from studies investigating perinatal factors that influence vaccine responses
Type of response
Vaccine response and vaccine: measurement [reference(s)] Maternal antibodies associated with
lower infant responses to vaccination
Maternal high body
mass index Maternal malnutrition Antenatal steroids
Humoral responses Lower antibody production HepA: GMTs (305,306) Diphtheria: GMTs (14) Measles: SCRs (49) OPV: titers (575) ORV: SCRs (295,296,307–310) Pertussis PRN: GMTs (14) IPV: GMTs (14) Tetanus: GMTs (14)
Lower antibody production OPV: SPRs (326) ORV: SPRs (326)
Lower antibody production Tetanus: GMTs (280)
Cytokine responses Lower cytokine
production BCG: IL-2 (325)
infant antibody responses to Hib, diphtheria, and tetanus (313) vaccination. In contrast,
maternal infection with Strongyloides during pregnancy is associated with higher
antibody responses to Hib, HepB, and pertussis toxin (PT) (314) vaccination.
Maternal infection with M. perstans during pregnancy is associated with higher
infant IL-10 responses after BCG and tetanus vaccination, but there are no differences
in gamma interferon (IFN-
␥), IL-5, and IL-13 (
319) production. Maternal infection with
filariae (320), Trypanosoma cruzi (321), or S. mansoni (320) during pregnancy is
associ-ated with lower IFN-
␥ production in children after BCG vaccination, while other
helminth infections show no effect on infant responses to BCG vaccination (319,
322,
323). Empiric treatment of mothers with albendazole or praziquantel during pregnancy
does not influence infant vaccine responses to BCG (324), diphtheria (314), HepB (314),
Hib (314), measles (324), pertussis (314), or tetanus (324) vaccination (Table 7).
Other maternal factors. In infants, cytokine responses to BCG vaccination correlate
inversely with maternal body mass index (BMI) (325). On the other hand, maternal
malnutrition is associated with lower infant antibody responses to OPV and ORV
vaccination, while it does not influence responses to parenteral vaccines (326).
It has been suggested that low maternal education status is associated with higher
infant GMTs to tetanus vaccination (327) and lower infant IFN-␥ and IL-5 production
after tetanus vaccination (319), while a lower maternal socioeconomic status is
asso-ciated with lower infant IL-10 production after tetanus vaccination (319) (Table 8).
However, this might be confounded by other factors, such as malnourishment and
nonadherence to vaccination schedules.
Maternal tetanus immunization during pregnancy is associated with higher infant
antibody responses to tetanus vaccination, while the presence of a maternal BCG scar
is associated with lower infant IL-5 (319), IL-10 (323), and IL-13 (319) responses after
BCG vaccination (319).
Infants who are exposed to HIV during pregnancy but remain uninfected have lower
IFN-␥, IL-5, and IL-13 responses after tetanus and BCG vaccination (319). Antenatal, but
not postnatal, steroids decrease infant antibody production in response to tetanus
vaccination (280) (Table 6).
Extrinsic Factors
Infections. Most studies show no difference in antibody responses to MMR
vacci-nation between children with diarrhea (287,
328), fever (287,
328), or afebrile upper
respiratory tract infections (URTI) (329–332) and healthy children. However, studies
have reported lower SCRs after measles (330) and varicella (331) vaccination for
children with URTI (without differences in GMTs), lower GMTs after Hib vaccination in
children with fever (333), and lower GMTs and SCRs for children with diarrhea after OPV
vaccination (334,
335). Concurrent infection with nonpoliovirus enteroviruses at the
time of vaccination with OPV reduces SCRs against poliovirus type 1 but not type 2 or
3 (334) (Table 9).
Children who are infected with Epstein-Barr virus (EBV) have reduced antibody
responses to meningococcal polysaccharide (MPV) and measles vaccination. However,
infants who are infected with both EBV and cytomegalovirus (CMV) have responses
similar to those of uninfected infants, suggesting that the effects of EBV infection might
be countered by CMV infection (336). Children who are infected with CMV also have
higher GMTs after vaccination with measles vaccine (337), while results from studies
investigating vaccine responses in CMV-seropositive adults are conflicting. Studies
report higher antibody responses to TIV vaccination in young adults (GMTs) (338) and
elderly people (SCRs) (248) who are seropositive for CMV than in seronegative
individ-uals, while other studies show reduced antibody responses (SCRs) (339,
340), lower B
and T cell activation (341), and switched memory B cells (339) in response to TIV
vaccination in CMV-seropositive individuals (Table 9).
Adults who are infected with HIV have lower SPRs after vaccination with HepA
vaccine. A lower viral load and higher CD4 cell count are predictors of a higher response
to vaccination (104). Pregnant women who are infected with HIV have lower cytokine
TABLE 7 Results with regard to maternal infections from studies investigating perinatal factors that influence vaccine responses Type of response Vaccine response and vaccine: measurement [reference(s)] Filariasis Helminths Hookworm Malaria Mansonella perstans Schistosomiasis Strongyloidiasis Trypanosoma cruzi Humoral responses Lower antibody production Hib: GMTs ( 313 ) No difference in antibody production Diphtheria: GMTs ( 313 ) HepB: GMTs ( 313 ) Tetanus: GMTs ( 313 ) Lower antibody production Hib: GMTs ( 313 ) No difference in antibody production aP: GMTs ( 314 ) Diphtheria: GMTs ( 313 , 314 ) HepB: GMTs ( 313 , 314 ) Hib: GMTs ( 314 ) Tetanus: GMTs ( 313 ) Lower antibody production Hib: GMTs ( 313 ) Measles: SPRs ( 318 ) No difference in antibody production Diphtheria: GMTs ( 313 ) HepB: GMTs ( 313 ) Tetanus: GMTs ( 313 , 316 ) No difference in antibody production aP: GMTs ( 314 ) Diphtheria: GMTs ( 314 ) HepB: GMTs ( 314 ) Hib: GMTs ( 314 ) Lower antibody production HepB: GMTs ( 317 ) No difference in antibody production aP: GMTs ( 314 ) Diphtheria: GMTs ( 313 , 314 ) HepB: GMTs ( 313– 315 ) Hib: GMTs ( 314 ) Tetanus: GMTs ( 313 ) Higher antibody production Hib: GMTs ( 314 ) HepB: GMTs ( 314 ) PT: GMTs ( 314 ) Cytokine responses Lower cytokine production BCG: IFN-␥ ( 320 ) No difference in cytokine production BCG ( 319 , 322 , 323 ) Higher cytokine production BCG: IL-10 ( 319 ) Tetanus: IL-10 ( 319 ) Lower cytokine production BCG: IL-5 ( 323 ) Lower cytokine production BCG: IFN-␥ ( 320 ) Lower cytokine production BCG: IFN-␥ ( 321 )
http://doc.rero.ch
responses to BCG (319,
323) and tetanus (319) vaccination. Infants who are infected
with HIV have lower cytokine responses after vaccination with BCG (319,
323), measles
(337), and tetanus (319) vaccines and lower antibody responses after vaccination with
measles vaccine (318). Children who are infected with HIV have quicker waning of
antibodies after vaccination with HepA vaccine (342).
Individuals who are chronically infected with either hepatitis B or hepatitis C virus
have lower antibody responses to HepA vaccination (102,
263,
343,
344).
Parasites. Infants who are symptomatically infected with malaria parasites have
lower antibody responses to Hib (333), measles (318), MCV-C (345), Salmonella Typhi
(intradermal), and tetanus (345–347) vaccination and lower cytokine responses (IFN-
␥,
IL-5, and IL-13) after vaccination with tetanus (319) and BCG (319,
323) vaccines (Table
10). Children with asymptomatic malaria have lower GMTs after MCV-C (94,
348) and aP
(349) vaccination but no difference in antibody responses to tetanus vaccination (350,
351). Malaria prophylaxis given to children prior to vaccination has no influence on
GMTs or SCRs after diphtheria (352–355), IPV (355), measles (352,
353,
356), OCV (357),
OPV (353), pertussis (352), Salmonella Typhi (353,
357), or tetanus (352–355,
358,
359)
vaccination. Malaria prophylaxis also has no influence on the size of the tuberculin skin
reaction after BCG vaccination (353). However, GMTs after vaccination with MCV-A and
MCV-C are (transiently) higher in children who are on malaria prophylaxis (348,
353).
Individuals who are infected with Onchocerca volvulus produce fewer antibodies and
have less proliferation of mononuclear cells and lower IFN-
␥ production (
360) after
tetanus vaccination, and individuals who are infected with S. mansoni produce less
IFN-
␥ (
361) after tetanus vaccination. In children and adults with Ascaris lumbricoides
infection, antibody and cytokine responses (IFN-
␥ and IL-2) to OCV are diminished but
can be partially restored by albendazole treatment prior to vaccination (362,
363).
Childhood helminth infections are not associated with cytokine responses after BCG
vaccination. Empiric quarterly albendazole treatment during the first 5 years of age
leads to less IFN-
␥ and IL-13 production after vaccination with BCG (
323). In contrast,
albendazole treatment in individuals with proven helminth infection leads to more T
cell proliferation (364) and IFN-
␥ (
364,
365) and IL-12 (365) production after BCG
vaccination but to less transforming growth factor beta (TGF-
) and concanavalin A
production (365) (Table 11). Infants who are congenitally infected with Trypanosoma
cruzi have stronger in vitro IFN-
␥ responses after vaccination with diphtheria, HepB, and
tetanus vaccines (321) (Table 10).
Antibiotics, probiotics, and prebiotics. There are no studies of humans that have
investigated the effects of antibiotics on vaccine responses. However, a study in mice
showed that administration of clarithromycin or doxycycline leads to lower antibody
responses after vaccination with a HepB, tetanus, or PPV23 vaccine, while
administra-TABLE 8 Results with regard to other maternal factors from studies investigating perinatal factors that influence vaccine responses
Type of response
Vaccine response and vaccine: measurement [reference(s)]
Low maternal education status
Low maternal socioeconomic status
Maternal treatment with albendazole or praziquantel
during pregnancy Maternal vaccination
Humoral responses Higher antibody production Tetanus: GMTs (327) No difference in antibody production aP: GMTs (314) Diphtheria: GMTs (314) HepB: GMTs (314) Hib: GMTs (314)
Maternal tetanus vaccination during pregnancy Higher antibody production
(GMTs) to tetanus in infants (319)
Cytokine responses Lower cytokine production Tetanus: IFN-␥ (319), IL-5
(319)
Lower cytokine production Tetanus: IFN-␥ (319)
Presence of maternal BCG scar associated with lower production in infants IL-5 (319)
IL-10 (323) IL-13 (319)
TABLE 9 Results with regard to symptoms or infections from studies investigating extrinsic factors that influence vaccine responses Type of response Vaccine response, vaccine, age group, measurement [reference(s)] Diarrhea Fever URTI CMV infection EBV infection Hepatitis B virus infection Hepatitis C virus infection Humoral responses Lower antibody production OPV Infants: GMTs ( 335 ) Children: SCRs ( 334 ) No difference in antibody production Measles Infants: SCRs ( 287 ) Children: GMTs ( 328 ), SCRs ( 328 ) Lower antibody production Hib Children: GMTs ( 333 ) No difference in antibody production Measles Infants: SCRs ( 287 ) Lower antibody production Measles Infants: SCRs ( 330 ) Varicella Children: SPRs ( 331 ) No difference in antibody production Measles Infants: SCRs ( 287 ) Children: GMTs ( 329 , 331 ), SCRs ( 329 , 331 , 332 ) Mumps Children: GMTs ( 329 , 331 ), SCRs ( 329 , 331 ) Rubella Children: GMTs ( 329 , 331 ), SCRs ( 329 , 331 , 332 ) Varicella Children: GMTs ( 331 ) Higher antibody production Influenza Adolescents: GMTs ( 338 ) Elderly: SCRs ( 248 ) Lower antibody production Measles Infants: GMTs ( 337 ) Influenza Adults: SCRs ( 339 , 340 ) Lower antibody production Measles Infants: median IgM and IgG levels ( 336 ) MPV Infants: median IgM and IgG levels ( 336 ) Lower antibody production HepA Adults: SPRs ( 263 ) HepB Adults: SPRs ( 263 ) Lower antibody production HepA Adults: GMTs ( 343 ), SPRs ( 102 , 263 , 343 ) HIV-coinfected adults: SPRs ( 344 ) HepB Adults: SPRs ( 263 ) Cellular responses Lower cellular responses TIV Adults: switched memory B cells ( 339 ) Adults: B and T cell activation ( 341 )
http://doc.rero.ch
TABLE 10 Results with regard to parasitic infections from studies investigating extrinsic factors that influence vaccine responses Type of response Vaccine response, vaccine, age group, measurement [reference(s)] HIV infection Ascaris lumbricoides Malaria Onchocerca volvulus Schistosoma mansoni Trypanosoma cruzi Humoral responses Lower antibody production HepA Adults: SPRs ( 104 ) Measles Infants: SPRs ( 318 ) Lower antibody production OCV Children: GMTs ( 363 ), SCRs ( 363 ) Lower antibody production Hib Children: GMTs ( 333 ) MCV-C Children: GMTs ( 94 , 345 , 348 ) Measles Infants: SPRs ( 318 ) PT Infants: GMTs ( 349 ) Salmonella Typhi Children: GMTs ( 345 , 346 ) Tetanus Children: GMTs ( 346 , 347 ) No difference in antibody production Tetanus Children: GMTs ( 351 ) Lower antibody production Tetanus Adults: GMTs ( 360 ) Cellular responses Lower cellular responses Tetanus Adults: proliferation of mononuclear cells ( 360 ) Cytokine responses Lower cytokine production BCG Infants: IFN-␥ ( 319 , 323 ), IL-5 ( 319 , 323 ), IL-10 ( 319 ), IL-13 ( 319 , 323 ) Women: IFN-␥ ( 319 , 323 ), IL-5 ( 319 ), IL-13 ( 319 , 323 ) Measles Infants: IFN-␥ ( 337 ) Tetanus Infants: IFN-␥ ( 319 ), IL-5 ( 319 ), IL-13 ( 320 ) Women: IFN-␥ ( 319 ), IL-5 ( 319 ), IL-13 ( 319 ) Lower cytokine production OCV Adults: IFN-␥ ( 362 ), IL-2 production ( 362 ) Lower cytokine production BCG Women: IFN-␥ ( 319 , 323 ), IL-5 ( 319 ), IL-13 ( 319 ) Tetanus Women: IFN-␥ ( 319 ), IL-5 ( 319 ), IL-13 ( 319 ) Lower cytokine production Tetanus Adults: IFN-␥ ( 360 ) Lower cytokine production Tetanus Adults: IFN-␥ ( 361 ) Higher cytokine production Diphtheria Women: IFN-␥ ( 321 ) HepB Women: IFN-␥ ( 321 ) Tetanus Women: IFN-␥ ( 321 )
http://doc.rero.ch
TABLE 11 Results with regard to antiparasitic treatment from studies investigating extrinsic factors that influence vaccine responses Type of response Vaccine response, vaccine, age group, measurement [reference(s)] Responses after treatment with albendazole Responses on prophylaxis with amodiaquine Responses on prophylaxis with atovaquone-proguanil Responses on prophylaxis with chloroquine Responses on prophylaxis with sulfadoxine-pyrimethamine Humoral responses Higher antibody production OCV, A. lumbricoides Children: GMTs ( 363 ) No difference in antibody production Diphtheria Infants: median titers ( 355 ) Children: GMTs ( 352 ), SCRs ( 352 ) IPV Infants: median titers ( 355 ) Measles Children: GMTs ( 352 ), SCRs ( 352 ), SPRs ( 356 ) Pertussis Children: GMTs ( 352 ), SCRs ( 352 ) Tetanus Infants: median titers ( 355 ) Children: GMTs ( 352 ), SCRs ( 352 ), titers ( 358 , 359 ) No difference in antibody production OCV Children: GMTs ( 357 ) Salmonella Typhi Children: GMTs ( 357 ) Higher antibody production MCV-A Children: GMTs ( 348 , 353 ) MCV-C Children: GMTs ( 348 , 353 ) No difference in antibody production Diphtheria Children: GMTs ( 353 ) Measles Children: GMTs ( 353 ) OPV Children: GMTs ( 353 ) Salmonella Typhi Children: GMTs ( 353 ) Tetanus Children: GMTs ( 352 , 353 ), SCRs ( 352 ) No difference in antibody production Diphtheria Infants: SCRs ( 354 ) Measles Infants: SCRs ( 354 ) Tetanus Infants: SCRs ( 354 ) Cellular responses Higher cellular response BCG, any helminth Adults: T cell proliferation ( 364 ) No difference in cellular response BCG Children: tuberculin skin test ( 353 ) Cytokine responses Higher cytokine production BCG, any helminth Adults: IFN-␥ ( 364 , 365 ), IL-2 ( 365 ), IL-12 ( 365 ) OCV, A. lumbricoides Adults: IL-2 ( 362 ) Lower cytokine production BCG, any helminth Adults: concanavalin A ( 365 ), TGF- ( 365 ) BCG, empiric treatment Female adults: IFN-␥ ( 323 ), IL-13 ( 323 )