Benchmarking Smartphone Fluorescence-Based Microscopy with
DNA Origami Nanobeads: Reducing the Gap toward Single-Molecule
Sensitivity
Carolin Vietz,
†,#Max L. Schütte,
†,#Qingshan Wei,
‡Lars Richter,
†Birka Lalkens,
§Aydogan Ozcan,*
,∥Philip Tinnefeld,*
,§and Guillermo P. Acuna*
,†,⊥†Institute for Physical & Theoretical Chemistry, Braunschweig Integrated Centre of Systems Biology (BRICS), and Laboratory for Emerging Nanometrology (LENA), Braunschweig University of Technology, Rebenring 56, 38106 Braunschweig, Germany ‡Department of Chemical and Biomolecular Engineering, North Carolina State University, Raleigh, North Carolina 27695, United
States
§Department Chemie and Center for NanoScience, Ludwig-Maximilians-Universitaet Muenchen, Butenandtstr. 5-13 Haus E, 81377 Muenchen, Germany
∥Electrical & Computer Engineering Department, Bioengineering Department, California NanoSystems Institute (CNSI), and Department of Surgery, University of California, Los Angeles, Los Angeles, California 90095, United States
⊥Department of Physics, University of Fribourg, Chemin du Musée 3, Fribourg CH-1700, Switzerland
*
S Supporting InformationABSTRACT: Smartphone-basedfluorescence microscopy has been rapidly developing over the last few years, enabling point-of-need detection of cells, bacteria, viruses, and biomarkers. These mobile microscopy devices are cost-effective, field-portable, and easy to use, and benefit from economies of scale. Recent developments in smartphone camera technology have improved their performance, getting closer to that of lab microscopes. Here, we report the use of DNA origami nanobeads with predefined numbers of fluorophores to quantify the sensitivity of a smartphone-based fluorescence microscope in terms of the minimum number of detectable molecules per diffraction-limited spot. With the brightness of a single dye molecule as a reference, we compare the
perform-ance of color and monochrome sensors embedded in state-of-the-art smartphones. Our results show that the monochrome sensor of a smartphone can achieve better sensitivity, with a detection limit of ∼10 fluorophores per spot. The use of DNA origami nanobeads to quantify the minimum number of detectable molecules of a sensor is broadly applicable to evaluate the sensitivity of various optical instruments.
■
INTRODUCTIONTo fulfill the demand for point-of-need diagnostic devices in global healthcare, various portable and miniature optical-imaging devices have been developed.1−9 Point-of-need diagnostics requires robust and easy-to-use handling as well as sensitive and specific detection with cost-effective equip-ment. Smartphones are appealing for such devices10 as they benefit from economies of scale, where it is estimated that the current number of smartphone users is close to a third of the world’s population,11surpassing the number of digital camera users with digital camera sales reducing every year.12 This massive market drives the development of the smartphone camera and computing technologies and enables the low-cost mass production of its components. As an example, the whole camera system of a state-of-the-art smartphone including the optical components and image sensor is commercially available
for less than 20 USD. An additional advantage is that smartphones can not only be used for digital image recording, processing, and on-the-spot analysis but also for electronic medical recording and communication. Recently, portable smartphone-basedfluorescence microscopes (SBFMs) enabled food-allergen testing,13 blood analysis,14 as well as the detection of single particles,15 cells,14 bacteria,16 and biomarkers13,17 including proteins18and nucleic acids.19,20In addition, the diagnosis of infectious diseases was demonstrated in developing countries.21−25 Although SBFMs are relatively easy to configure to create a low-cost and field-portable microscope design,10they exhibit limited detection sensitivity Received: November 9, 2018
Accepted: December 24, 2018 Published: January 9, 2019
Article
http://pubs.acs.org/journal/acsodf Cite This:ACS Omega 2019, 4, 637−642
compared with laboratory-based fluorescence microscopes, which can routinely detect single-moleculefluorescence. Such a high sensitivity is crucial for an early disease detection as extremely low concentrations of few molecules per milliliter have to be detected.26To date, thefluorescence detection limit of SBFM designs under low-light conditions has not been comprehensively characterized. Recent studies using SBFMs revealed that isolated nano-objects with several hundreds to thousands offluorophores per diffraction-limited spot could be detected.15,19A higher sensitivity, reaching a detection limit of 80 fluorophores per spot, was also achieved using plasmonic enhancement as a part of the sample substrate.27
In this study, we quantify the detection sensitivity of color and monochrome sensors embedded in smartphones used as a part of an SBFM. Comparing the imaging performance of cameras including parameters such as quantum efficiency, dark noise, and saturation capacity is usually complex. Under low-light conditions, we use the minimum number of detectable molecules as a central parameter to characterize and compare the sensitivity of SBFMs. Tracing back the number of detectable molecules per spot has become possible with the advent of DNA origami brightness reference samples that show a linear dependence offluorescence intensity on the number of fluorophores.28,29
For this purpose, we employed 5 DNA origami nanobead samples with predefined numbers of fluorophores ranging from approximately 10 to 74 green fluorescent dyes (ATTO542) per nanobead. The choice of this greenfluorescent dye is intended to match the spectral range in which both monochrome and color sensors embedded in smartphones exhibit the highest detection sensitivity. We immobilized the samples on glass coverslips with an average density of less than one structure per diffraction-limited spot and imaged them using SBFMs. The obtained smartphone images were compared with the images taken with a specialized single-molecule wide-field fluorescence microscope (sm-micro-scope). Finally, the sensitivity was quantified by calculating the Weber contrast as CW= (I− IB)/IB, with I and IBrepresenting thefluorescence and background intensities, respectively. Our results show that, for smartphone camera modules, mono-chrome sensors outperform color sensors for fluorescence detection and can reach a detection limit of 10fluorophores per diffraction-limited spot with a mean Weber contrast of 0.2.
■
RESULTSThe SBFMs used in this work (Figures 1andSI1) are based on a previous design.15 It incorporates only the basic optical elements to function as a fluorescence microscope: a light source (532 nm continuous wave (cw)-laser), excitation and emissionfilters, two mirrors, two lenses (one for focusing the excitation beam and another for collecting thefluorescence), and a smartphone camera as the image detector. The excitation occurs in a dark-field geometry directing the laser beam at a 45° illumination angle to avoid collection of the directly transmitted beam by the SBFM (Figure 1b). A bandpassfilter is used to spectrally reject the scattered light from the cw-laser so that only fluorescence light is detected. Samples are mounted on an xyz-micrometer stage for focusing and sample adjustment. We employed two different smartphones for our SBFM measurements: the LG V10 and the Huawei P10 Plus. The choice of smartphone was intended to maximize the image quality in terms of the light captured and resolution. Therefore, we focused on smartphones with the highest numerical aperture and biggest sensor. The LG V10 contains a single
back-camera with an aperture of f/1.8 and a color 16 MP sensor (5312× 2988 pixel) with a size of 5.96 mm × 3.35 mm leading to a pixel size of approximately 1.12 μm. The monochrome camera of the Huawei phone has comparable specifications, the same aperture of f/1.8 and a 20 MP sensor (5120× 3840), with a size of 5.12 mm × 3.840 mm leading to a pixel size of 1μm. To ensure that the same regions of the sample are imaged with different microscopes, grid marks were used (Figure S2).
Calibration of DNA Origami Nanobeads. The five
different DNA origami nanobead samples (i.e., samples A, B, C, D, and E, as obtained from GATTAquant GmbH) were surface immobilized in a flow cell and characterized with a confocal fluorescence microscope to determine the average number of fluorophores per nanobead in each sample. Through a fluorescence intensity comparison with samples, each containing a singlefluorophore, the average numbers of fluorophores in samples A, B, C, D, and E were measured as 74 ± 14, 49 ± 13, 34 ± 7, 16 ± 5, and 10 ± 5, respectively (see
Figure S3). Furthermore, the intensity distributions reveal that only single fluorescence beads are attached to the surface (within a diffraction-limited area) with only a small dimer fraction visible for the nanobeads with a higher loading (Figure S3).
Color versus Monochrome Image Sensor Perform-ance. After calibration of the DNA origami nanobeads, we focused on a comparison of the monochrome and color sensor performance. Therefore, the same area on sample A (74 dye molecules) was imaged with both smartphones and an sm-microscope. The results (Figure 2a−c) show that sample A can be imaged by all three microscopes as evidenced by the strong correlation of spots in all images. As expected, the images obtained with the sm-microscope exhibit fluorescence spots with a smaller size because of its higher numerical aperture. Furthermore, images taken with the monochrome sensor show a higher contrast compared with the color camera (as also shown by the line intensity profiles across the same spot in Figure 1.Sketch of our experimental setup for SBFM.
Figure 2d−f). Weber contrasts for the spots marked inFigure 2
were calculated as 3.37 for (a), 0.15 for (b), and 0.39 for (c). It is worth mentioning that sample A wasfirst imaged with the color SBFM, followed by the monochrome SBFM, andfinally with the sm-microscope. Therefore, potential bleaching of some of the fluorophores of each bead in sample A cannot
account for the worse contrast of the color sensor image. We suggest that this is mainly caused by differences in the light collection efficiency of the smartphone camera sensors. The color sensor is composed of a Bayerfilter30in which out of four pixels, two have greenfilters, whereas the remaining two have a red and a blue filter, respectively, to generate a color Figure 2.Image comparison between sm-microscope and SBFM. Sample A imaged with (a) the sm-microscope, (b) the LG color SBFM, and (c) Huawei monochrome SBFM. Scale bar in (a) applies also to images (b) and (c). (d−f) represent a horizontal-line intensity profile of the marked spots in (a)−(c), respectively.
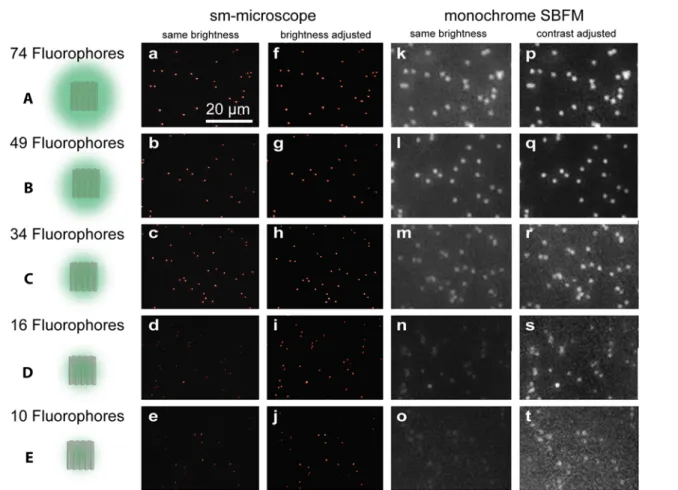
Figure 3.Images of samples A−E taken with the sm-microscope (a−j) and the monochrome SBFM (k−t). (a−e) and (k−o) reveal a decrease in brightness as the images are adjusted to the same scale, respectively. For a simplified identification of single nanobeads, images (f)−(j) were rescaled to the highest brightness value and images (p)−(t) were rescaled for brightness and contrast. Images (k)−(o) were tonal corrected to the same value for better visibility. The scale bar in (a) is applicable to all images.
image. In contrast, monochrome sensors have no colorfilters and therefore every pixel can collect light in the green spectral range as opposed to only half the overall number of pixels in a color sensor. Based on these results, we selected the monochrome smartphone imager sensor for further SBFM experiments.
Sensitivity Determination of Monochrome Image Sensors. Next, we set out to determine the sensitivity limit of the monochrome SBFM with the fluorescent nanobeads. First, all the samples (A, B, C, D, and E) were imaged on the monochrome SBFM (see Figure 3k−o respectively). For visibility, these images were tonal corrected in Adobe Photoshop as only jpeg files could be exported from the smartphone. The same area was later imaged on the sm-microscope to verify that the detected spots represent single nanobeads (seeFigure 3a−e). These images (Figure 3a−e,k− o) reveal decreasing brightness from sample A (74 fluorophores) to sample E (10 fluorophores) as they are adjusted to the same brightness scale, respectively. Samples A and B (74 and 49 fluorophores, respectively) yield similar bright and sharp images when imaged with the monochrome SBFM (Figure 3p,q). In contrast, for sample E (10 fluorophores), beads are barely detectable under the SBFM (Figure 3o). Samples containing a singlefluorophore were also imaged with the SBFM, but no spots could be identified (Figure S4). For better identification of spots and to improve visualization, the images shown inFigure 3a−e were rescaled with the brightest pixel set to the highest brightness value resulting in Figure 3f−j. Figure 3k−o were brightness and contrast adjusted leading toFigure 3p−t.
To compare the image quality, we calculated the Weber contrast for each spot from the uncorrected SBFM images (see
Materials and Methods). A signal-to-noise ratio analysis based on the standard deviation of the background signal could not be performed since images could only be saved in the jpeg format, which smoothens the background noise significantly.
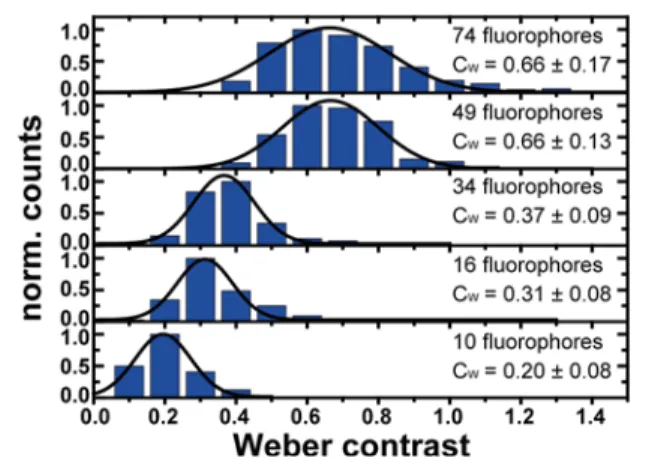
Figure 4shows histogram plots of the Weber contrast for each
sample and Gaussian fits to the distributions. The Weber contrast decreases from values of 0.66 ± 0.17 for the bright samples to 0.20± 0.08 for the 10-dye sample E. As the Weber contrast exhibits an expected strong power-density dependence (Figure S5), imperfect alignment with small variations of excitation intensity contribute to the error in determining the Weber contrast.
Finally, we estimate the monochrome SBFM detection limit to be around 10fluorophores. This assessment is based on the fact that, for sample E, single spots are barely detectable in both the original image and the contrast-enhanced image (Figure 3o,t). In addition, not all spots present on the sm-microscope image (Figure 3e) can be identified on their SFBM image counterparts (see circles inFigure S6) although SFBM imaging was conducted first to rule out any influence of photobleaching.
■
DISCUSSIONIn conclusion, we employed DNA-origami nanobeads with predefined numbers of independently emitting fluorophores to quantitatively study the detection limit of SBFMs. Our results show that state-of-the-art smartphones with monochrome sensors exhibit a higher sensitivity and are thus better suited for fluorescence sensing and imaging applications, reaching a detection limit of∼10 fluorescent dyes per diffraction-limited spot. Further developments in smartphone sensors or the combination with optical antennas will soon bridge the gap to democratize single-molecule detection with smartphone micro-scopes.31−35 Using DNA nanobeads, we introduced the minimal number of detectable molecules as a simple parameter for precise quantification of SBFMs, paving the way for the development of diagnostic assays for point-of-need devices that fully exploit the potential and capabilities of smartphone-based instrumentations.
■
MATERIALS AND METHODSSample Preparation. Custom-built fluorescence beads (samples A, B, C, D, and E) functionalized with a decreasing
number of ATTO542 fluorescent dye molecules were
purchased from GATTAquant GmbH (Hiltpoltstein, Ger-many). Folding of DNA origami pillars incorporating a single ATTO542fluorophore is described elsewhere.36Samples were prepared as simple flow cells from a cover slide and a microscope slide (seeFigure S2). The different fluorescence beads were surface immobilized via bovine serum albumin− biotin−neutravidin as described previously,36and theflow cells were sealed for imaging in the upright position. For the correlation of the SBFM imaging with the sm-microscope imaging, a grid was hand-drawn onto the coverslip of the specimen.
Smartphone-Based Fluorescence Microscopy. The 532 nm cw-laser (CW532 04 Series, Roithner Lasertechnik GmbH, Vienna, Austria) employed for the dark-field excitation in the SBFM setup has a measured mean output power of 64.5 mW. It was cleaned up (HC Laser Clean-up MaxLine 532/2, AHF Analysentechnik, Tübingen, Germany). For alignment and power-dependent measurements, the laser beam was attenuated using neutral density filters (Figure 1). A bifocal lens ( f = 30 cm) was utilized to focus the laser beam in a 45° angle onto the sample. For this lens, we estimate an illumination area of around 1 mm2, leading to a power density of the order of 100 kW/m2, which might vary with every new adjustment. A lens ( f = 2.6 mm, LS-40166, UCTronics, Nanjing, Jiangsu, China) mounted on the smartphone holder collected the fluorescence, which was further cleaned by spectral filtering (582/75 nm BrightLine, Semrock Inc, Rochester, New York). The smartphones used in our experiments were the Huawei P10 Plus (Huawei Technologies, Shenzhen, China) and the LG V10 (LG Electronics, Seoul, Figure 4.Distribution of the Weber contrast values (CW) for samples
A−E. Gaussian fitting yields the mean Weber contrast with its standard deviation.
Republic of Korea). For camera comparison, parameters for image recording were set to ISO 800, shutter speed ts= 1/4 s, infinite manual focus, and no brightness correction together with 8× and 10× zoom for the LG V10 and Huawei P10 Plus, respectively. Under these conditions, we imaged a commercial grid (Thorlabs Grid Distortion Target, 3″ × 1″) to determine that each pixel corresponds to dimensions of 81 nm (LG) and 64 nm (Huawei) inFigures 2and3, respectively. For further measurements with the Huawei P10, the ISO was decreased to ISO 400 and the shutter speed to ts= 1/15 s. The Huawei P10 Plus does not support RAW-capture, and so JPG images were recorded. Line profiles were plotted with the ImageJ software. Tonal correction (levels) as well as contrast and brightness enhancement were performed using Adobe Photoshop (CS5.5, Adobe Systems Software Ireland Limited, Dublin, Republic of Ireland).
Single-Molecule Sensitive Wide-Field Fluorescence Microscopy. For image capturing with the single-molecule sensitive wide-field super-resolution microscope (SR GSD, Leica Microsystems, Wetzlar, Germany) in the TIRF mode, a penetration depth of 179 nm, an exposure time of tex= 100 ms, and an electron multiplying gain of 50 were employed. For samples A to D, an excitation power of 10% was employed, whereas for sample E, the excitation power was increased to 15%. Brightness scales were adjusted using the associated software.
Confocal Microscopy. The intensity distributions were obtained through confocal microscope measurements as described elsewhere.37 Laser intensities were adjusted with NDfilters to avoid saturation effects. Intensities were obtained from scan images and compared with origami pillars incorporating a single ATTO542 fluorophore.36 Relative intensity distributions were plotted andfitted with a Gaussian function (Figure S3).
Determination of the Weber Contrast. The Weber contrast is defined as CW = (I − IB)/IB, with I and IB representing the fluorescence and background intensities, respectively. It was determined using the ImageJ software as follows: First, the offset of the smartphone camera was determined from a dark image and subtracted from all intensity values. For every detected spot, the integrated intensity I within a circle with a diameter of 50 px was calculated. For background subtraction, the integrated intensity of an outer circle around the first one with a diameter of 70 px was calculated. The intensity of the inner circle was subtracted from the intensity of the outer circle, yielding the background intensity IB. Spots where circles interlaced with other spots or where circles were not positioned concentrically with respect to the spot were not taken into account.
■
ASSOCIATED CONTENT*
S Supporting InformationThe Supporting Information is available free of charge on the
ACS Publications website at DOI: 10.1021/acsome-ga.8b03136.
SBFM and marked glass slides, intensity calibration, singlefluorophore images, analysis of the Weber contrast for different excitation intensities, and analysis of sm-microscope and SBFM image correlation (PDF)
■
AUTHOR INFORMATIONCorresponding Authors
*E-mail:[email protected]. Tel: +1 310 825 0915 (A.O.). *E-mail: [email protected]. Tel: +49 89 2180 77549. Fax: +49 89 2180 77548 (P.T.).
*E-mail: [email protected]. Tel: +41 26 300 9631. Fax: +41 26 300 9030 (G.P.A.). ORCID Carolin Vietz:0000-0002-8417-4168 Qingshan Wei:0000-0003-1214-010X Aydogan Ozcan:0000-0002-0717-683X Guillermo P. Acuna: 0000-0001-8066-2677 Author Contributions
#C.V. and M.L.S. contributed equally.
Author Contributions
This manuscript was written through contributions of all authors. All authors have given approval to thefinal version of the manuscript.
Notes
The authors declare the following competing financial interest(s): The authors declare the following competing nancial interest: P.T. is shareowner of GATTAquant GmbH.
■
ACKNOWLEDGMENTSThe authors are grateful to Dr. Enrico Pibiri for his assistance. This work was funded by the Deutsche Forschungsgemein-schaft (DFG, AC 279/2-1 and TI 329/9-1), the BMBF (Grants POCEMON, 13N14336, and SIBOF, 03VP03891), and the European Union’s Horizon 2020 research and innovation programme under grant agreement No. 737089 (Chipscope). Q.W. acknowledges the support by the Chancellor’s Faculty Excellence Program and the Kenan Institute for Engineering, Technology & Science (KIETS) at NC State. A.O. acknowledges the support of the NSF Engineering Research Center (ERC, PATHS-UP) and the Howard Hughes Medical Institute (HHMI).
■
REFERENCES(1) Ozcan, A. Mobile Phones Democratize and Cultivate Next-Generation Imaging, Diagnostics and Measurement Tools. Lab Chip 2014, 14, 3187−3194.
(2) Contreras-Naranjo, J. C.; Wei, Q.; Ozcan, A. Mobile phone-based microscopy, sensing, and diagnostics. IEEE J. Sel. Top. Quantum Electron. 2016, 22, 1−14.
(3) Vashist, S. K.; Mudanyali, O.; Schneider, E.; Zengerle, R.; Ozcan, A. Cellphone-based devices for bioanalytical sciences. Anal. Bioanal. Chem. 2014, 406, 3263−3277.
(4) Koydemir, H. C.; Ozcan, A. Mobile phones create new opportunities for microbiology research and clinical applications. Future Microbiol. 2017, 12, 641−644.
(5) Ozcan, A.; Demirci, U. Ultra wide-field lens-free monitoring of cells on-chip. Lab Chip 2008, 8, 98−106.
(6) Seo, S.; Su, T.-W.; Tseng, D. K.; Erlinger, A.; Ozcan, A. Lensfree holographic imaging for on-chip cytometry and diagnostics. Lab Chip 2009, 9, 777−787.
(7) Kim, S. B.; Koo, K.-i.; Bae, H.; Dokmeci, M. R.; Hamilton, G. A.; et al. A mini-microscope for in situ monitoring of cells. Lab Chip 2012, 12, 3976−3982.
(8) Zhang, Y. S.; Ribas, J.; Nadhman, A.; Aleman, J.; Selimović, Š.; et al. A cost-effective fluorescence mini-microscope for biomedical applications. Lab Chip 2015, 15, 3661−3669.
(9) Ghosh, K. K.; Burns, L. D.; Cocker, E. D.; Nimmerjahn, A.; Ziv, Y.; et al. Miniaturized integration of a fluorescence microscope. Nat. Methods 2011, 8, 871−878.
(10) Switz, N. A.; D’Ambrosio, M. V.; Fletcher, D. A. Low-cost mobile phone microscopy with a reversed mobile phone camera lens. PLoS One 2014, 9, No. e95330.
(11) eMarketer. Number of smartphone users worldwide from 2014 to 2020 (in billions). https://www.statista.com/statistics/330695/ number-of-smartphone-users-worldwide/, 2016.
(12) eMarketer. Worldwide unit sales of digital cameras from 2011 to 2016 (in millions). https://www.statista.com/statistics/269927/ sales-of-analog-and-digital-cameras-worldwide-since-2002/, 2016.
(13) Ludwig, S. K. J.; Tokarski, C.; Lang, S. N.; van Ginkel, L. A.; Zhu, H.; et al. Calling Biomarkers in Milk Using a Protein Microarray on Your Smartphone. PLoS One 2015, 10, No. e0134360.
(14) Breslauer, D. N.; Maamari, R. N.; Switz, N. A.; Lam, W. A.; Fletcher, D. A. Mobile phone based clinical microscopy for global health applications. PLoS One 2009, 4, No. e6320.
(15) Wei, Q.; Qi, H.; Luo, W.; Tseng, D.; Ki, S. J.; et al. Fluorescent imaging of single nanoparticles and viruses on a smart phone. ACS Nano 2013, 7, 9147−9155.
(16) Zhu, H.; Sikora, U.; Ozcan, A. Quantum dot enabled detection of Escherichia coli using a cell-phone. Analyst 2012, 137, 2541−2544. (17) Ludwig, S. K. J.; Zhu, H.; Phillips, S.; Shiledar, A.; Feng, S.; et al. Cellphone-based detection platform for rbST biomarker analysis in milk extracts using a microsphere fluorescence immunoassay. Anal. Bioanal. Chem. 2014, 406, 6857−6866.
(18) Coskun, A. F.; Nagi, R.; Sadeghi, K.; Phillips, S.; Ozcan, A. Albumin testing in urine using a smart-phone. Lab Chip 2013, 13, 4231−4238.
(19) Wei, Q.; Luo, W.; Chiang, S.; Kappel, T.; Mejia, C.; et al. Imaging and sizing of single DNA molecules on a mobile phone. ACS Nano 2014, 8, 12725−12733.
(20) Kühnemund, M.; Wei, Q.; Darai, E.; Wang, Y.; Hernández-Neuta, I.; et al. Targeted DNA sequencing and in situ mutation analysis using mobile phone microscopy. Nat. Commun. 2017, 8, No. 13913.
(21) Chaisson, L. H.; Reber, C.; Phan, H.; Switz, N.; Nilsson, L. M.; et al. Evaluation of mobile digital light-emitting diode fluorescence microscopy in Hanoi, Viet Nam. Int. J. Tuberc. Lung Dis. 2015, 19, 1068−1072.
(22) Liu, C.; Mauk, M. G.; Hart, R.; Bonizzoni, M.; Yan, G.; et al. A low-cost microfluidic chip for rapid genotyping of malaria-trans-mitting mosquitoes. PLoS One 2012, 7, No. e42222.
(23) Priye, A.; Bird, S. W.; Light, Y. K.; Ball, C. S.; Negrete, O. A.; et al. A smartphone-based diagnostic platform for rapid detection of Zika, chikungunya, and dengue viruses. Sci. Rep. 2017, 7, No. 44778. (24) Yeo, S.-J.; Choi, K.; Cuc, B. T.; Hong, N. N.; Bao, D. T.; et al. Smartphone-Based Fluorescent Diagnostic System for Highly Pathogenic H5N1 Viruses. Theranostics 2016, 6, 231−242.
(25) Laksanasopin, T.; Guo, T. W.; Nayak, S.; Sridhara, A. A.; Xie, S.; et al. A smartphone dongle for diagnosis of infectious diseases at the point of care. Sci. Transl. Med. 2015, 7, No. 273re1.
(26) Haas, P.; Then, P.; Wild, A.; Grange, W.; Zorman, S.; et al. Fast quantitative single-molecule detection at ultralow concentrations. Anal. Chem. 2010, 82, 6299−6302.
(27) Wei, Q.; Acuna, G.; Kim, S.; Vietz, C.; Tseng, D.; et al. Plasmonics Enhanced Smartphone Fluorescence Microscopy. Sci. Rep. 2017, 7, No. 2124.
(28) Schmied, J. J.; Gietl, A.; Holzmeister, P.; Forthmann, C.; Steinhauer, C.; et al. Fluorescence and super-resolution standards based on DNA origami. Nat. Methods 2012, 9, 1133−1134.
(29) Schmied, J. J.; Raab, M.; Forthmann, C.; Pibiri, E.; Wunsch, B.; et al. DNA origami-based standards for quantitative fluorescence microscopy. Nat. Protoc. 2014, 9, 1367−1391.
(30) Bayer, B. E. Color Imaging Array. U.S. Patent US3971065A; Eastman Kodak Co, 1976.
(31) Puchkova, A.; Vietz, C.; Pibiri, E.; Wunsch, B.; Sanz Paz, M.; et al. DNA Origami Nanoantennas with over 5000-fold Fluorescence
Enhancement and Single-Molecule Detection at 25 muM. Nano Lett. 2015, 15, 8354−8359.
(32) Kinkhabwala, A.; Yu, Z.; Fan, S.; Avlasevich, Y.; Müllen, K.; et al. Large single-molecule fluorescence enhancements produced by a bowtie nanoantenna.Nat. Photonics 2009, 3, 654−657.
(33) Khatua, S.; Paulo, P. M. R.; Yuan, H.; Gupta, A.; Zijlstra, P.; et al. Resonant plasmonic enhancement of single-molecule fluorescence by individual gold nanorods. ACS Nano 2014, 8, 4440−4449.
(34) Bidault, S.; Devilez, A.; Maillard, V.; Lermusiaux, L.; Guigner, J.-M.; et al. Picosecond Lifetimes with High Quantum Yields from Single-Photon-Emitting Colloidal Nanostructures at Room Temper-ature. ACS Nano 2016, 10, 4806−4815.
(35) Anger, P.; Bharadwaj, P.; Novotny, L. Enhancement and quenching of single-molecule fluorescence. Phys. Rev. Lett. 2006, 96, No. 113002.
(36) Vietz, C.; Kaminska, I.; Paz, M. S.; Tinnefeld, P.; Acuna, G. P. Broadband fluorescence enhancement with self-assembled silver nanoparticle antenna dimers. ACS Nano 2017, 11, 4969−4975.
(37) Vietz, C.; Lalkens, B.; Acuna, G. P.; Tinnefeld, P. Synergistic Combination of Unquenching and Plasmonic Fluorescence Enhance-ment in Fluorogenic Nucleic Acid Hybridization Probes. Nano Lett. 2017, 17, 6496−6500.