Supplementary Material
S1
Different coordination abilities of 1,7- and 4,7-phenanthroline in
the reactions with copper(II) salts: structural characterization
and biological evaluation of the reaction products
Nevena Lj. Stevanovića,#, Tina P. Andrejevića,#, Aurélien Crochetb, Tatjana Ilic-Tomicc,
Nenad S. Draškovićd, Jasmina Nikodinovic-Runicc, Katharina M. Frommb, Miloš I.
Djurane, Biljana Đ. Glišića,*
aUniversity of Kragujevac, Faculty of Science, Department of Chemistry, R. Domanovića 12, 34000 Kragujevac, Serbia
bDepartment of Chemistry, University of Fribourg, Chemin du Musée 9, CH-1700 Fribourg, Switzerland
cInstitute of Molecular Genetics and Genetic Engineering, University of Belgrade, Vojvode Stepe 444a, 11000 Belgrade, Serbia
dUniversity of Priština-Kosovska Mitrovica, Faculty of Agriculture, Kopaonička bb, 38228 Lešak, Serbia
eSerbian Academy of Sciences and Arts, Knez Mihailova 35, 11000 Belgrade, Serbia
#N.Lj.S. and T.P.A. contributed equally.
Corresponding author. Tel.: +381 34 300 251; fax: +381 34 335 040.
S2
aromatic nitrogen-containing heterocycles differing in the position of nitrogen atoms, 1,7- and 4,7-phenanthroline (1,7- and 4,7-phen), were performed in ethanol/methanol at room temperature. When CuX2 salts were mixed with 4,7-phen, two copper(II) complexes,
[Cu(NO3)2(4,7-Hphen)2](NO3)2 (1) and [Cu(CF3SO3)(4,7-phen)2(H2O)2]CF3SO3 (2), were
formed. On the other hand, in the reaction of CuX2 salts with phen, only
1,7-HphenNO3 (3a/b) and 1,7-HphenCF3SO3 (4) were obtained as the final products. The
obtained products 1 – 4 were characterized by spectroscopic and X-ray diffraction techniques. In the copper(II) complexes 1 and 2, the coordination geometry around the Cu(II) ion is distorted octahedral and square pyramidal, respectively. The antimicrobial potential of the copper(II) complexes 1 and 2 and corresponding compounds used for their synthesis were assessed against four different bacterial species and Candida albicans, displaying moderate growth inhibiting activity. The cytotoxic properties of the investigated complexes were also evaluated against the normal human lung fibroblast cell line (MRC-5) indicating moderate, yet more pronounced cytotoxicity than antimicrobial properties.
Keywords: Copper(II), Phenanthroline, Structural characterization, Antimicrobial activity, Cytotoxicity
Supplementary Material S3 TABLE OF CONTENTS IR spectrum of 1 S4 UV-Vis spectrum of 1 S5 IR spectrum of 2 S6 UV-Vis spectrum of 2 S7 IR spectrum of 3a S8 UV-Vis spectrum of 3a S9 1H NMR spectrum of 3a S10 IR spectrum of 4 S11 UV-Vis spectrum of 4 S12 1H NMR spectrum of 4 S13
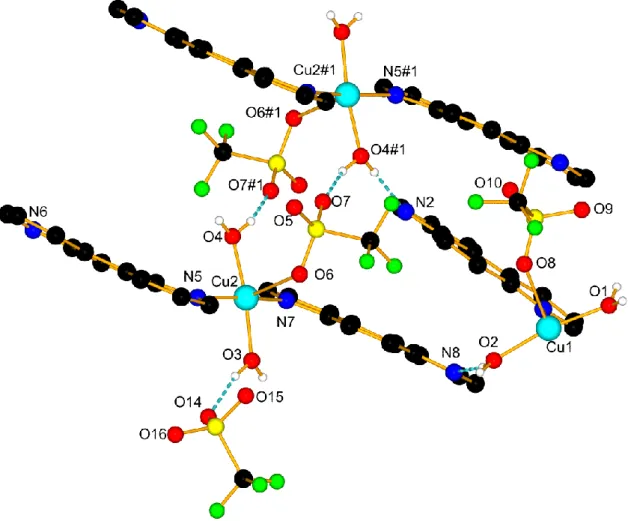
Fig. S1. Molecular structure of 2. Some hydrogen atoms and partitioning of
counter-ions are omitted for clarity. Hydrogen bonds are drawn as dashed blue lines, #1: −x+1, −y+1, −z+1.
S14
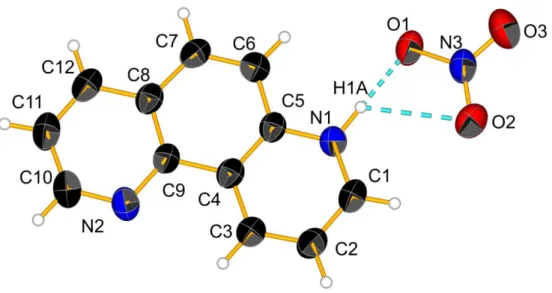
Fig. S2. Molecular structure of 3b. Displacement ellipsoids are drawn at 50%
probability level and H atoms are represented by spheres of arbitrary size.
S15
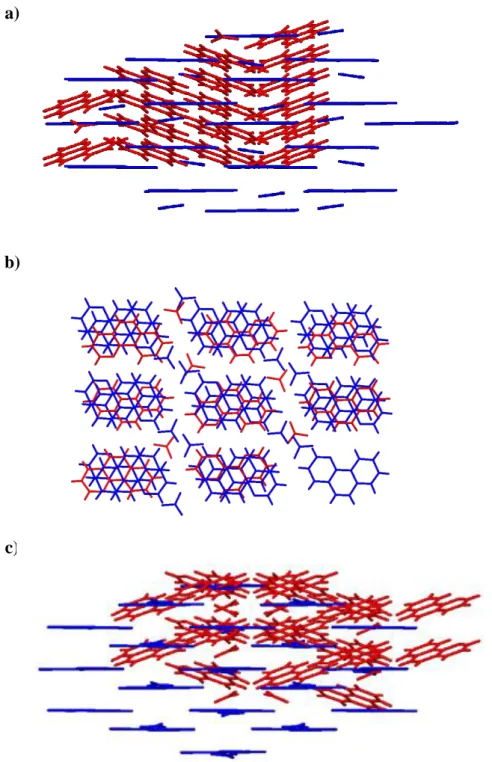
Fig. S3. The overlay of the packing of the 3a (red) and 3b (blue) along the a (a), b (b) and c (c) axis.
S4 4000.0 3600 3200 2800 2400 2000 1800 1600 1400 1200 1000 800 600 450.0 26.0 28 30 32 34 36 38 40 42 44 46 48 50 52 54 56 58 60 62 64 cm-1 %T 3921.04 3437.70 3065.38 2931.02 2664.82 2083.21 1985.07 1743.80 1632.57 1596.90 1560.29 1500.15 1409.57 1385.12 1356.44 1324.21 1309.07 1297.67 1279.64 1242.02 1223.54 1168.94 1109.79 1039.73 1018.91 956.00 882.76 841.15 828.17 804.21 780.95 752.30 738.53 720.95 705.13 668.31 633.71 566.27 513.25 505.64 494.59 468.13 456.47
Supplementary Material
S5
UV-Vis spectrum of 1 (DMSO)
0 0,2 0,4 0,6 0,8 1 500 600 700 800 900 A l (nm)
S6 4000.0 3600 3200 2800 2400 2000 1800 1600 1400 1200 1000 800 600 450.0 35.0 36 38 40 42 44 46 48 50 52 54 56 58 60 62 64 66 68 70 72 cm-1 %T 3835.24 3406.53 3274.02 3079.65 3015.76 2902.52 2846.08 2421.16 1955.15 1629.10 1603.72 1586.90 1505.23 1454.97 1445.37 1412.99 1396.21 1366.24 1345.56 1307.48 1288.80 1240.61 1229.09 1183.77 1163.54 1154.46 1113.77 1075.82 1062.06 1025.79 844.77 834.08 798.65 793.02 780.61 760.26 740.82 714.42 668.67 638.57 618.17 577.65 557.58 536.10 514.45 496.57 470.70 461.00
Supplementary Material S7 0 0,1 0,2 0,3 0,4 0,5 500 600 700 800 900 A l (nm)
S8 4000.0 3600 3200 2800 2400 2000 1800 1600 1400 1200 1000 800 600 450.0 43.0 44 46 48 50 52 54 56 58 60 62 64 66 68 cm-1 %T 3888.62 3450.62 3053.01 2926.99 2394.90 2005.82 1763.65 1740.83 1621.87 1596.18 1556.34 1434.42 1384.41 1308.71 1287.16 1237.00 1087.62 1047.13 1032.75 1016.91 965.03 884.02 840.53 824.96 800.10 776.76 714.55 699.85 614.47 547.16 512.14 492.29
Supplementary Material S9 0 0,2 0,4 0,6 0,8 255 305 355 A l (nm)
UV-Vis spectrum of 3a (DMSO)
Supplementary Material S11
IR spectrum of 4
4000.0 3600 3200 2800 2400 2000 1800 1600 1400 1200 1000 800 600 450.0 41.0 42 44 46 48 50 52 54 56 58 60 62 64 66 68 70 72 74.0 cm-1 %T 3447.84 3274.49 3200.36 3077.18 2931.21 2889.35 2829.88 1638.24 1625.56 1598.78 1556.89 1500.18 1454.83 1429.37 1412.65 1395.96 1367.00 1288.95 1251.75 1237.00 1218.96 1160.08 1097.88 1062.33 1029.68 939.18 884.11 846.59 803.92 781.13 758.45 723.29 709.94 640.92 619.56 597.22 589.52 574.14 517.14 497.81 470.67S12 0 0,2 0,4 0,6 0,8 255 305 355 A l (nm)
Supplementary Material
S13 1
H NMR spectrum of 4 (200 MHz, DMSO-d
S14
Fig. S1. Molecular structure of 2. Some hydrogen atoms and partitioning of counter-ions
are omitted for clarity. Hydrogen bonds are drawn as dashed blue lines, #1: −x+1, −y+1, −z+1.
Supplementary Material
S15
Fig. S2. Molecular structure of 3b. Displacement ellipsoids are drawn at 50% probability
S16
Fig. S3. The overlay of the packing of the 3a (red) and 3b (blue) along the a (a), b (b) and c (c) axis.
b)