Volume 45(2)
Summer/été 2019
Validation of a Questionnaire Assessing Students’ Self-Directed and
Collaborative Learning With and Without Technology in Canadian Middle
School Classrooms
Validation d’un questionnaire évaluant l’apprentissage autonome et
collaboratif des élèves, avec et sans technologie, dans les salles de classe des
écoles intermédiaires canadiennes
Chantal Labonté, University of Alberta Veronica R. Smith, University of Alberta AbstractIn the current study, the researchers examine the validity of a questionnaire assessing students’ perceptions of their self-directed and collaborative learning with and without technology with a group of Canadian middle school students. Lee and colleagues (2014)
developed the 18-item questionnaire to assess high school students’ perceptions of their learning. Three hundred and twenty middle school students from across Alberta, Canada completed the questionnaire. The results of a confirmatory factor analysis revealed that the questionnaire did not have sufficient model fit. The researchers used a jackknifing procedure to systematically remove four items in order to achieve a psychometrically sound questionnaire. The results suggest that the reduced questionnaire is a useful self-report instrument for assessing Canadian middle school students’ perceptions of their learning.
Résumé Dans la présente étude, les chercheurs examinent la validité d’un questionnaire évaluant les perceptions qu’ont les élèves de leur apprentissage autonome et collaboratif, avec et sans technologie, au sein d’un groupe d’élèves d’écoles intermédiaires canadiennes. Lee et ses collègues (2014) ont développé un questionnaire de 18 items pour évaluer les perceptions qu’ont des élèves d’écoles secondaires quant à leur apprentissage. Trois cent vingt élèves d’écoles intermédiaires à travers l’Alberta, au Canada, ont rempli le questionnaire. Les résultats d’une analyse factorielle confirmatoire ont révélé que le questionnaire avait été insuffisamment ajusté au modèle. Les chercheurs se sont servis d’une procédure de jackknife afin de supprimer systématiquement quatre items afin d’obtenir un questionnaire solide sur le plan psychométrique. Les résultats suggèrent que le questionnaire raccourci est un instrument
utile pour l’auto-évaluation des perceptions qu’ont des élèves d’écoles intermédiaires quant à leur apprentissage.
Introduction
Among other 21st century skills, educators have identified collaborative learning (CL) and self-directed learning (SDL) as important skills for success in our current global knowledge society (Henry, 2015; Partnership for 21st Century Skills, 2011). SDL is defined as “any increase in knowledge, skill, accomplishment, or personal development that an individual selects and brings about by his or her own efforts using any method in any circumstances at any time” (Gibbons, 2002; p. 2). SDL is associated with numerous meaningful learning outcomes and skills, such as critical thinking and logical thinking skills (Willett, Yamashita, & Anderson, 1983), and has long been recognized as an essential component for educational growth and life-long learning (Garrison, 1997; Gibbons, 2002). A complementary skill set, CL occurs when two or more students work together towards a common learning goal (Dillenbourg, 1999). As students engage in CL, they serve each other as a source of support, motivation and learning (Bolhuis, 2003; Schwartz, Tsang, & Blair, 2016). CL provides students with the chance to analyze and exchange information, and engage in the learning material in a way not offered during individual learning, fostering students’ critical thinking skills, and greater conceptual understanding of course material (Hussain, Anwar, & Majoka, 2011; Schwartz, Tsang, & Blair, 2016; Terenzini, Cabrera, Colbeck, Parente, & Bjorklund, 2001).
Information and communication technology (ICT) is used in educational settings for a variety of purposes. The use of ICT can facilitate access to both information and online expertise for the purpose of pursuing learning goals and interests (Teo, et al., 2010). Current technology supported learning practices include technology-rich, network-enhanced, blended, and virtual learning environments (Resta & Laferriere, 2007). Activities within technology-supported classrooms usually include using the Internet to find information and participating in group discussions about learning tasks with peers in the classroom and in online environments, as well as traditional non-technological activities, such as accessing information through textbooks and direct instruction (Lee, Tsai, Chai, & Koh, 2014). Open education websites and learning portals provide learners with a plethora of informational material and opportunities to learn. Wikipedia, Youtube, and Khan Academy have all been identified as examples of websites used by self-directed learners (Bonk, Lee, Kou, Xu, & Sheu, 2015). Tools such as email, online chat forums, blogs, wikis, videoconferencing systems, and course management systems have all been used to support online CL (Resta & Laferriere, 2007). Other tools such as Wikispaces, Moodle, and social media platforms also have built-in features to facilitate both CL and SDL (Domalewska, 2014).
Research has demonstrated that ICT-supported CL (i.e., completing a task together using a shared computer) positively impacts learning outcomes. Blaye and colleagues (1991) examined the CL of 11-year-old students (N=39) during user-user interaction while completing a timed computer-based problem-solving game. Children either worked independently or in pairs, before playing the game independently. The students who first worked collaboratively were found to be twice as likely to complete the task successfully compared to children who worked on the task alone. Importantly, students who had previously worked in pairs were twice as likely to complete
the task successfully when later working alone, compared to children who had only worked alone, despite having the same amount of exposure to the task (Blaye et al., 1991).
While ICT-enhanced CL and SDL appears to impact student learning, it has also been proposed that students may require SDL and CL skills before being introduced to ICT. Lee and colleagues (2014) found a positive relationship between SDL and CL skills when applied with and without technology. They concluded that students’ ability to engage in SDL and CL without technology predicted their ability to engage in SDL and CL with technology. Accordingly, these findings suggest that teachers, researchers, and educational technologists should be concerned about their students’ SDL and CL skills in both technological and non-technological contexts so that students may be able to take full advantage of the benefits of ICT.
As ICTs are increasingly being used within classrooms globally, there is a need for measures to assess the extent of students’ CL and SDL. Students’ perceptions of their learning ability also need to be considered. Students’ perceptions and beliefs about their efficacy to learn affect student motivation and ability to succeed academically (Schwartz, Tsang, & Blair, 2016). Furthermore, by examining the relationship between students’ perceptions of their SDL and CL with and without technology, teachers can effectively adapt pedagogical practices and integrate ICT within their classrooms. With this in mind, Lee and colleagues (2014) created a
questionnaire designed to assess student’s perceptions of their SDL and CL with and without technology. Lee and colleagues (2014) constructed the survey questions from existing
instruments, designed by Shell et al. (2005), Goh et al. (2013), and Teo et al. (2010). The authors pilot-tested for face and content validity by consulting two professors in educational technology and five high school teachers from Singapore. The authors then validated the four-factor
structure of the 18 item 7 point Likert scale questionnaire with a group of high school students in Singapore (Lee et al., 2014). The findings revealed that the four factors had sufficient internal consistency with an overall coefficient alpha of 0.95. Coefficients above 0.7 are acceptable estimates of internal consistency for research purposes (Kaplan & Saccuzzo, 2013). The results of a confirmatory factor analysis revealed the questionnaire to have good construct validity, convergent validity, discriminant validity, and reliability with high school students in Singapore (Lee et al., 2014).
The use and interpretation of any questionnaire is only valid for the purposes and
populations for which there are evidence of validity (Downing, 2003). Lee and colleagues (2014) provided validity evidence for the interpretation of the questionnaire results for the perceptions of SDL and CL with and without technology of Singapore high school students. Additional evidence is needed to support its use for interpretations with other populations. Within a Canadian context, educational policies simultaneously support both CL and SDL learning processes and the use of technology (Alberta Education, 2013). Yet, there is no evidence of validity to suggest that Lee and colleagues measure is appropriate to assess Canadian students’ perceptions of their CL and SDL in ICT-supported learning environments.
In the present study, the researchers examine the validity and reliability of the instrument created by Lee and colleagues (2014) for use with Canadian middle school students. The
researchers were guided by the following question: Does the Lee and colleagues (2014)
questionnaire have adequate evidence of reliability and validity for use with middle students in Alberta, Canada?
Methods Participants
Three hundred and twenty-five students (52.6% male) from eight schools across five school jurisdictions were asked to complete the questionnaire as part of a larger study. Of these students, a small number (N=5) did not complete all the items in the questionnaire. Little’s (1988) missing completely at random (MCAR) test was non-significant (chi-square = 9.892, df = 26, sig. = 0.998), revealing that the values were missing at random. As only a few cases have missing values and they are missing at random, all five cases with missing values were deleted from the data set (Tabachnick & Fidell, 2014). A total of 320 participants remained.
Students were enrolled in grades 5 to 9, with the majority of students in Grade 8, (3.1% Grade 5, 2.8% Grade 6, 16.3% Grade 7, 55.3% Grade 8, 22.2% Grade 9) inclusive (i.e., students with and without special education needs) ICT-supported classrooms. Teachers reported that the inclusive classroom environments included many students with mild to moderate learning needs, ranging from 10% to 85% per classroom depending on the school. Participating schools were located in both rural and urban population centers across various regions of the province. The majority of the students (64.4%, n = 206) came from English speaking families.
Procedure
The questionnaire was administered to students mid school year as part of a larger battery of questionnaires. Students completed all questionnaires within their respective classrooms using the REDCap online survey administration and data capture program (Harris et al., 2009). To complete the questionnaires, a research assistant provided instruction to students via video embedded within the online platform. Every item was read aloud via the computer monitor to the student.
Measure
The 18-item questionnaire, created by Lee and colleagues (2014), aims to assess students’ perceptions of their ability to engage in SDL and CL with and without technology within their ICT-supported classroom environments. Each scale contains items that prompt students to rate their learning skills on a 7-point Likert scale (i.e., 1-strongly disagree, 7-strongly agree). Scale scores are calculated by taking the average of the ratings for items included within the scale (Lee et al., 2014). The four scales are described below:
1. Self-directed learning without technology (SDL) scale. This 4-item scale assesses students’ perceptions of the extent to which they take an active role in their learning in face-to-face non-technological settings.
2. Collaborative learning without technology (CL) scale. This 5-item scale assesses students’ perceptions of the extent to which they participate in group discussions and learning within face-to-face non-technological settings.
3. Self-directed learning with technology (SDLT) scale. This 5-item scale assesses student’s perceptions of the extent to which they take an active role in their learning in
4. Collaborative learning with technology (CLT) scale. This 4-item scale assesses student’s perceptions of the extent to which they use ICTs to participate in group discussions and learning
Results
Statistical analyses were conducted using the Statistical Package for the Social Sciences (SPSS for Mac: Version 24) software and Analysis of Moment Structures (AMOS) add-on for SPSS for Windows (Version 24).
Confirmatory Factor Analysis
Confirmatory factor analysis (CFA) with maximum likelihood estimates was used to establish the validity of the 4-factor measurement model described by Lee and colleagues (2014). The maximum likelihood method was appropriate, as there was no evidence of non-normality within the data. No items or subscales were found to have a skewness value larger than an
absolute value of 3.0 or kurtosis value with an absolute value larger than 8.0 (see Table 1), which are the cut-off values, recommended by Kline (2011).
Table 1
Factor Loadings and Descriptive Statistics for SDL, CL, SDLT, and CLT Scales and Their Corresponding Items
Factor loading
M SD Skewness Kurtosis
Factor 1: SDL 5.13 1.06 -0.55 -0.06
SDL1: In this class, I think about different approaches or strategies I could use for studying the assignments.
0.74 5.25 1.35 -0.97 0.84
SDL2: In this class, I try to determine the
best way to work on the assignments. 0.62 5.51 1.22 -1.18 1.59 SDL3: In this class, I make plans for how I
will study.
0.79 4.61 1.60 -0.52 -0.47 SDL4: In this class, I try to check my
progress when I study.
0.74 5.16 1.41 -0.81 0.21
Factor 2: CL 5.25 1.14 -0.94 0.85
CL1: In this class, my classmates and I actively work together to help each other to help each other understand the material.
0.86 5.35 1.49 -1.03 0.38
CL2: In this class, my classmates and I
actively share ideas and information. 0.70 5.28 1.42 -1.06 0.86 CL3: In this class, my classmates and I
CL4: In this class, my classmates and I actively discuss the ideas we have about things we are learning.
0.73 5.04 1.45 -0.90 0.26
CL5: In this class, my classmates and I actively discuss the ideas we have about things we are learning.
0.57 5.41 1.42 -1.15 1.08
Factor 3: SDLT 5.20 1.16 -0.84 0.33
SDLT1: In this class, I use the computer to get ideas from different websites and people to learn more about a topic.
0.80 5.35 1.44 -1.05 0.71
SDLT2: In this class, I use the computer to organize and save information for my learning.
0.80 5.62 1.50 -1.34 1.43
SDLT3: In this class, I use different computer programs to work on the ideas that I have learned.
0.69 5.14 1.60 -0.84 -0.08
SDLT4: In this class, I find out more information on the Internet to help me understand my lessons better.
0.52 5.13 1.65 -0.94 0.09
SDLT5: In this class, I use the computer to
keep track of my learning progress. 0.68 4.75 1.72 -0.63 -0.55
Factor 4: CLT 4.58 1.33 -0.44 -0.16
CLT1: In this class, my classmates and I actively challenge each other’s ideas in the online platforms.
0.88 4.06 1.76 -0.12 -0.93
CLT2: In this class, my classmates and I actively discuss our ideas online to come up with better ideas.
0.69 4.50 1.69 -0.51 -0.58
CLT3: In this class, my classmates and I actively communicate via online platforms (e.g. Forum, MSN, wiki) to learn new things together.
0.82 4.25 1.82 -0.32 -0.98
CLT4: In this class, my classmates and I actively work together to construct ICT-based documents (e.g., presentation slides, web pages).
0.74* 5.52 1.57 -1.27 1.07
Note. * CLT4 loads onto the SDLT scale rather than the CLT scale
Model fit was assessed using a range of indices representing different aspects of model fit (Hooper, Coughlan, & Mullen, 2008). Model chi-square (X2) value was calculated. While this is the traditional measure of model fit, chi-square is sensitive to sample size, assumes multivariate normality and almost always rejecting models with larger sample sizes (Hooper, Coughlan, &
Mullen, 2008). As such, the normed chi-square, chi-square/degrees of freedom (X2/df), will also be used. A range of no more than 3.0 is often suggested to indicate an acceptable fit between the hypothesized model and the sample data, although recommended ranges vary from as high as 5.0 to as low as 2.0 in the literature (Hooper, Coughlan, & Mullen, 2008; Teo, et al., 2010). Root mean square error of approximation (RMSEA), normed-fit index (NFI), and comparative-fit index (CFI) statistics were also calculated. The RMSEA is one of the most informative statistics, as it is sensitive to the number of estimated parameters within the model. RMSEA values of less than 0.08 reflect good model fit. The NFI ranges from 0 to 1, with a cut-off point of 0.9 and greater, indicating acceptable model fit. The CFI statistic also ranges from 0 to 1 with a cut-off point of 0.95 and greater, indicating good model fit (Hooper, Coughlan, & Mullen, 2008).
The initial analysis of the measurement model as proposed by Lee and colleagues (2014) did not suggest acceptable model fit. Inspection of the modification indices indicated that model fit might be improved by correlating four sets of error variances. The model fit, improved through the use of correlation of error terms, was assessed using a range of indices: Χ2= 323.02, df=125, p< 0.01, Χ2/df= 2.58, NFI=0.87, CFI=0.92, and RMSEA=0.07 (90% CI of 0.06-0.08). The results of some indices suggest a mediocre model fit, while others failed to find an
acceptable fit.
To evaluate the validity and reliability of the structure, the composite reliability (CR) and the average variance extracted (AVE) were calculated. CR is a measure of internal consistency of the latent constructs (Fornell & Larcker, 1981). A CR value of greater than 0.7 indicates good internal consistency (Hair, Black, Babin, & Anderson, 2010). The AVE indicates the average percentage of variation explained by items for each latent construct and provides us with an indictor of convergent validity (Fornell & Larcker, 1981). An AVE value greater than 0.5
indicates good convergent validity. An AVE score that is less than 0.5 indicates that the variance due to error is larger than the variance explained by the construct, suggesting concerns with convergent validity. Discriminant validity is achieved when the items within a factor account for more variance than the factor shares with other constructs in the model. To establish discriminant validity, the square root of the AVE for each factor is compared with the factor’s inter-construct correlations. The square root of the AVE, which is based on the standardized loadings between an item and its factor, should be larger than the factor’s correlations with other factors. This comparison reveals whether the factor is sufficiently distinct from the other factors (Fornell & Larcker, 1981; Henseler, Ringle, & Sarstedlt, 2015).
Regression weights, CR, and AVE results, displayed in Table 2, suggest good internal consistency, but indicate that the individual SDL and SDLT items do not correlate well with each other within their factor, suggesting poor convergent validity. SDL and SDLT factors are not well explained by their observed items. Table 3 contains the inter-correlation between factors with the square root of the AVE value along the diagonal. Examination of this table reveals discriminant validity concerns for the SDL and SDLT scales. The square root of the AVE for SDL is smaller than the correlations between SDL and CL, and the square root of the AVE for SDLT is smaller than the correlations between SDLT and CLT. The SDL scale is not sufficiently distinct from the CL scale, whereas the SDLT scale is not sufficiently distinct from the CLT scale.
Table 2
Regression Weights, CR and AVE for Each Factor of the Measurement Model
Factor Item Regression weights CR AVE
SDL SDL1 .61 0.76 0.44 SDL2 .66 SDL3 .68 SDL4 .71 CL CL1 .69 0.85 0.54 CL2 .73 CL3 .85 CL4 .80 CL5 .59 SDLT SDLT1 0.64 0.79 0.43 SDLT2 0.80 SDLT3 0.71 SDLT4 0.41 SDLT5 0.71 CLT CLT1 .74 0.83 0.49 CLT2 .78 CLT3 .72 CLT4 0.54 Table 3
Correlation Matrix with Square Root of the AVE on the Diagonal
Factor SDL CL SDLT CLT
SDL 0.66
CL 0.67 0.73
SDLT 0.47 0.43 0.65
CLT 0.54 0.64 0.65 0.7
Overall, the results suggest that the measurement model has mediocre model fit but only when correlations of error terms are added to the model. The proposed questionnaire structure was found to have good composite reliability. Concerns were found with the convergent and discriminant validity of the SDL and SDLT scales.
Jackknifing Procedure
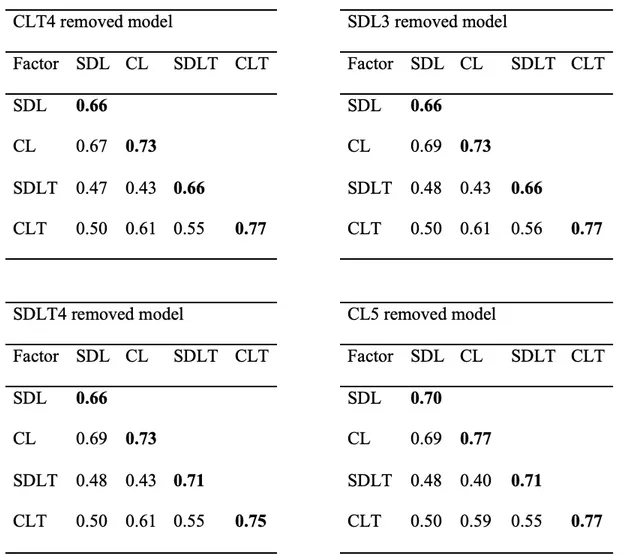
In an effort to achieve validity for the questionnaire, a jackknife approach, as described by Larwin and Harvey (2012), was performed to systematically reduce the number of items until the resulting model displayed good model fit, and adequate composite reliability, convergent validity, and discriminant validity, as measured by the CR and AVE. Following the systematic removal of items from the original model, the removal of item CLT4, resulted in a model that demonstrated the best model fit. After the removal of item CLT4, the model fit was assessed using a range of indices: Χ2= 2368.35, df=113, p< 0.01, Χ2/df= 2.11, NFI=0.89, CFI=0.94, and RMSEA=0.06 (90% CI of 0.05-0.07). The revised model has acceptable fit with three of the indices (Χ2 , Χ2/df and RMSEA) revealing good model fit. A summary of the model fit indices is displayed in Table 4. To evaluate the validity and reliability of the structure, the CR and AVE were calculated. The results, displayed in Table 5 suggest that all scales have good composite reliability but that the convergent validity concerns remain present for SDL and SDLT. This suggests that the SDL and SDLT factors are not well explained by the items that were intended to measure these constructs. The inter-construct correlations found in Figure 1 reveal that concerns with discriminant validity of the SDLT scale were resolved. However, discriminant validity with the SDL scale remains. The SDL scale continues to be not sufficiently distinct from the CL scale.
Table 4
Summary of Model Fit Indices for Each Resulting Model of the Jackknifing Procedure
Model Χ2
(df, p)
Χ2/df NFI CFI RMSEA (90% CI) CLT4 removed 238.35 (113, 0.00) 2.11 0.89 0.94 0.06 (0.05-0.07) SDL3 removed 212.26 (98, 0.00) 2.17 0.90 0.94 0.06 (0.05-0.07) SDLT4 removed 173.04 (84, 0.00) 2.06 0.91 0.95 0.06 (0.04-0.07) CL5 removed 136.72 (71, 0.00) 1.93 0.93 0.96 0.05 (0.04-0.07)
Figure 1. Inter-factor correlations and the square root of the AVE for each resulting model. Following the same approach, the jackknifing procedure was repeated several times until a model with a good model fit and acceptable reliability and validity was achieved. After each item removal, the removal of another item was tested systematically, and the item resulting in the best model fit was removed. The model fit indices for each model are located in Table 4, and the CR and AVE results are in Table 5. Figure 1 contains inter-construct correlation and square root of the AVE information for each model. After the removal of item CLT4 from the model, item SDL3 was removed and the model fit and validity was assessed. The model had adequate fit and sufficient composite reliability. As it still contained the same convergent and discriminant validity concerns, the jackknife procedure was repeated, and item SDLT4 was removed. This resulting model had good model fit and sufficient composite reliability, and the AVE indicated a resolution of the concerns with convergent validity for the SDLT scale. However, concerns with convergent and discriminant validity remained for the SDL scale. The jackknife procedure then resulted in the removal of item CL5. With the removal of item CL5, the SDL factor displayed adequate convergent validity and concerns with discriminant validity were resolved. This model also had good model fit, and good composite reliability. The jackknifing procedure was not
continued as a model with good model fit, and adequate reliability and validity was reached. With the removal of items CLT4, SDL3, SDLT4, and CL5, the questionnaire reached an acceptable level of reliability and validity for use with Canadian middle school students. The reduced questionnaire is found in Appendix A and the resulting measurement model is found in Appendix B. Descriptive statistics for each of the new reduced scales is found in Table 6. Table 5
CR and AVE for Each Factor of the Resulting Jackknife Procedure Model
SDL CL SDLT CLT CLT4 removed CR 0.76 0.85 0.79 0.81 AVE 0.44 0.54 0.44 0.59 SDL3 removed CR 0.85 0.69 0.79 0.81 AVE 0.43 0.54 0.44 0.59 SDLT4 removed CR 0.69 0.85 0.80 0.84 AVE 0.43 0.54 0.510 0.57 CL5 removed CR 0.79 0.85 0.80 0.81 AVE 0.49 0.59 0.51 0.59 Table 6
Descriptive Statistics for SDL, CL, SDLT and CLT Scales
M SD Min. Max. Factor 1: SDL 5.30 1.05 2.33 7.00 Factor 2: CL 5.21 1.21 1.25 7.00 Factor 3: SDLT 5.21 1.24 1.00 7.00 Factor 4: CLT 4.27 1.24 1.00 7.00 Discussion
The development of SDL and CL has been identified as a major educational goal for 21st century learners (Henry, 2015; Partnership for 21st Century Skills, 2011; Voogt & Roblin, 2012). Students are expected to develop these learning processes in traditional face-to-face classroom settings and in technology-supported learning environments. Lee and colleagues (2014) developed a questionnaire to assess students’ perceptions of their learning processes across both face-to-face and ICT-supported learning environments. The four factors of the
questionnare (CL, SDL, CLT, SDLT) can help educators’ understand how students view learning with ICT and allow for better support for learning across all environments (Lee, Tsai, Chai, & Koh, 2014).
The principal aim of the present study was to examine the validity of Lee and colleagues’ (2014) questionnaire for use with Canadian middle school students. Confirmatory factor analysis was used to test the validity and the reliability of the factorial structure of the questionnaire. By testing the factorial structure of each questionnaire item, the extent to which each items measure the specfic factor they were designed to measure can be determined (Byrne, 2010). Test of the fit between the factorial model and the data indicate the degree to which the items measure their respective constructs, and provides an indication of how well the instrument supports the underlying theory (Hooper, Coughlan, & Mullen, 2008). Based on the model fit indices and measures of reliability and validity, the factorial model did not fit with our data, which raised concerns about validity of the original questionnaire for use with our sample of Canadian middle school students.
In order to establish a valid and reliable questionnaire for use with our sample of Canadian middle school students, four items (CLT4, SDL3, SDLT4, and CL5) were removed through a jackknifing procedure. The jackknifing procedure involves removing one item at a time and estimating model fit for each resulting model. The selection of the item to be removed from the questionnaire is based on which model produces the best model fit estimations. The process of removing items one by one continues until several conditions are met: the original factors continue to be explained by three observed items, the reduced model maintains structural integrity, the reduced model correlates with the primary factor model at a level greater or equal to 0.95, and the resulting reduced model has good model fit (Larwin & Harvey, 2012). The CLT 4 item, In this class, my classmates and I actively work together to construct ICT-based
documents (e.g. presentation slides, web pages), initially loaded on the SDLT scale. Thus, its removal allowed for a parsimonious model fit and resolved the discriminant validity concerns with SDLT. Removing the CLT4 item reduced the correlation between the CLT and SDLT scales, allowing for the SDLT scale to be sufficiently distinct from the CLT scale. Removing the SDL3 item (“In this class, I make plans for how I will study.”) did improve model fit, but did not resolve any of the validity concerns within the model. However, removing the SDLT4 item, In this class, I find out more information on the Internet to help me understand my lessons better, improved the convergent validity of the SDLT scale, implying that the SDLT4 item was not sufficiently related to the other items and was not adequately measuring the same construct. Last, by removing the CL5 item, In this class, my classmates and I actively talk about what to do during group work, resolved concerns with convergent and discriminant validity of the SDL scale. It appears that the CL5 item was related to the SDL scale.
The results from the reduced questionnaire suggest that Canadian middle school students are easily engaging in SDL, CL, and SDLT within their classroom, as indicated with means over 5 on each scale. Students reported less perceived ability to engage in CLT within their
classroom. Students and educators may require additional support and resources in order to engage in ICT-supported CL.
Implications for Practice
SDL and CL are important 21st century learning skills that are increasingly being used in ICT-supported classrooms. Students are required to apply SDL and CL in context that include educational technology. As a result, educational practitioners such as teachers, educational researchers and educational technologists need instruments to assess these skills. The reduced
questionnaire can be used by practitioners to collect self-report information from their middle school students. The questionnaire was initially developed by Lee and colleagues (2014) through a theory-driven approach and found to be valid and reliable with high school students in
Singapore. The reduced questionnaire presented in this study can be implemented with middle school students in a Canadian context as the psychometric jackknifing procedure allows researchers to produce a reduce questionnaire that is valid and reliable.
Limitations and Future Research
This study did not collect sufficient information regarding student learning and classroom practices in order to provide anything more than speculation as to why the original questionnaire did not have sufficient reliability and validity for use with middle students in Canada.
Differences between the pedagogical practices in Singapore and Canada, and across high school and middle school classrooms may provide a hypothesis for why some items were retained while others removed in order to reach adequate evidence of validity with our sample. A comparison of the questionnaire results between the samples of Canadian middle students and the Singapore high school students from the Lee and colleagues (2014) study reveal some differences and commonalities. Both the Singapore high school students and the Canadian middle school
students describe their SDL and CL without technology as slightly agreeable with means above 5 across both scales for both samples. Additionally, both Singapore high school students
(mean=4.15, SD=1.52) and Canadian middle school students (mean=4.27, SD-1.24) indicate that they are less readily engaged in collaborative activities without technology, with means
corresponding best with the ‘agree nor disagree’ options of the 7-point Likert scale. The
Singapore high school students report that they do not readily engage in SDL with technology in their classrooms (mean=3.98, SD=1.51). However, Canadian middle school students report that they do engage in self-directed activities with technology (mean=5.21, SD=1.24).
Further research may wish to consult with teachers and students to better understand how self-directed learning and collaborative learning with and without technology is facilitated in middle and high school classrooms in both Canada and Singapore. Consultation with teachers may provide valuable information as to how CL and SDL items may or may not align with their teaching practices in middle school classrooms. The reduced questionnaire is a useful self-report instrument for assessing Canadian middle school students’ perceptions of their learning in ICT-supported classrooms. Caution should be applied to its use with a variety of samples as the original questionnaire was not valid with our sample and the reduced questionnaire requires further validation across an array of samples. Future research is needed to understand the validity of the questionnaire across both different cultural groups and age groups.
Lee and colleagues (2014) were driven by theory when they created their self-report questionnaire for use with high school students in Singapore. However, the questionnaire itself does not assess all 21st century learning competencies (Lee et al., 2014). The Partnership for 21st Century Learning’s framework includes collaborative and self-directed learning among other skills such as creativity, critical thinking and problem solving, and communication (Partnership for 21st Century Skills, 2011). While the reduced questionnaire was shown to be a useful tool to measure SDL and CL, a comprehensive self-evaluation of Canadian students’ 21st century learning competencies requires more than just the reduced questionnaire. Future research should investigate a broad range of 21st century learning skills.
Authors’ Note:
Parts of this paper were developed as a Masters of Education thesis by the first author. We gratefully acknowledge that parts of the data analysis were completed with the assistance and guidance of Xiaozhou Zhang. Funds received by Veronica R. Smith from Alberta Education “Flexible Pathways to Success: Technology to Design for Diversity” supported this study.
References
Alberta Education. (2013). Learning and technology policy framework. School Technology Branch. Retrieved from https://education.alberta.ca/media/1045/ltpf-quick-guide-web.pdf Blaye, A., Light, P., Joiner, R., & Sheldon, S. (1991). Collaboration as a facilitator of planning
and problem solving on a computer-based task. British Journal of Developmental Psychology, 9, 471-483. doi:10.1111/j.2044-835X.1991.tb00890.x
Bolhuis, S. (2003). Towards process-oriented teaching for self-directed lifelong learning: a multidimensional perspective. Learning and Instruction, 13, 327-347. doi:10.1016/S0959-4752(02)00008-7
Bonk, C., Lee, M., Kou, X., Xu, S., & Sheu, F.-R. (2015). Understanding the self-directed online learning preferences, goals, achievements, and challenges of MIT
OpenCourseWaresubscribers. Educational Technology & Society, 18(2), 349-368. Retrieved from
http://publicationshare.com/J_Ed-Tech_Society_Bonk_Lee_et_al_MIT_OCW_MOOCs_Self_directed_Lrng_in_press.pdf
Byrne, B. (2010). Structural equation modeling wih AMOS: Basic concepts, applications, and programming (2nd Edition ed.). New York: Routledge.
Dillenbourg, P. (1999). What do you mean by 'collaborative learning'? In P. Dillenbourg (Ed.), Collaborative-learning: Cognitive and Computational Approaches (pp. 1-19). Elsevier: Oxford. Retrieved from https://telearn.archives-ouvertes.fr/hal-00190240/document Domalewska, D. (2014). Technology-supported classroom for collaborative learning: Blogging
in the foreign language classroom. International Journal of Education and Development using Information and Communication Technology, 4, 21-30. Retrieved from
https://www.learntechlib.org/p/150704/
Downing, S. (2003). Validity: on the meaningful interpretation of assessment data. Medical Education, 37, 830-837. doi:10.1046/j.1365-2923.2003.01594.x
Fornell, C., & Larcker, D. (1981). Evaluating structural equation models with unobservable variables and measurement error. Journal of Marketing Research, 18 (1), 39-50. doi:10.1177/002224378101800104
Garrison, D. (1997). Self-directed learning: Toward a comprehensive model. Adult Education Quaterly, 48 (1), 18-33. doi:10.1177%2F074171369704800103
Gibbons, M. (2002). Self-directed learning handbook. San Francisco: John Wiley & Sons, Inc. Goh, A., Chai, C., & Tsai, C. (2013). Facilitating students' development of their views on nature
of science: A knowledge building approach. Asia-Pacific Educational Research, 22(4), 521-530. doi:10.1007/s40299-012-0050-0
Hair, J., Black, W., Babin, B., & Anderson, R. (2010). Multivariate data analysis (7th ed.). Upper Saddle River, NJ, USA: Prentice-Hall, Inc.
Harris, P., Taylor, R., Thielke, R., Payne, J., Gonzalez, N., & Conde, J. (2009). Research
electronic data capture (REDCap)-a metadata-driven methodology and workflow process for providing translational research informatics support. J Biomed Inform, 42(2), 377- 381. doi:10.1016/j.jbi.2008.08.010
Henry, M. (2015). Learning in the digital age: developing critical, creative and collaborative skills. In S. Younie, M. Leask, & K. Burden (Eds.), Teaching and learning with ICT in the primary school (2nd ed., pp. 1-12). Abingdon: Routledge.
Henseler, J., Ringle, C., & Sarstedlt, M. (2015). A new criterion for assessing discriminant validity in variance-based structural equation modeling . Journal of Academic Marketing Science, 43, 115-135. doi:10.1007/s11747-014-0403-8
Hooper, D., Coughlan, J., & Mullen, M. (2008). Structural equation modelling: Guidelines for determining model fit. Electronic Journal of Business Research Methods, 6(1), 53-60. Hussain, S., Anwar, S., & Majoka, M. (2011). Effect of peer group activity-based learning on
students' academic achievement in physics at secondary level. International Journal of Academic Research, 3 (1), 940-944. Retrieved from
https://www.researchgate.net/profile/Shafqat_Hussain2/publication/234077357_EFFECT _OF_PEER_GROUP_ACTIVITY-BASED_LEARNING_ONSTUDENTS'_ACADEMIC_ACHIEVEMENT_IN_PHYSICS AT_SECONDARY_LEVEL/links/02bfe50ee2b9e9bebb000000/EFFECT-OF-PEER- GROUP-ACTIVITY-BASED-LEARNING-ONSTUDENTS-ACADEMIC-ACHIEVEMENT-IN-PHYSICSAT-SECONDARY-LEVEL.pdf
Kaplan, R., & Saccuzzo, D. (2013). Psychological testing: Principles, applications & issues (8th ed.). Belmont, CA: Wadsworth Cengage Learning.
Larwin, K., & Harvey, M. (2012). A demonstration of a systematic item-reduction approach using structural equation modeling. Practica Assessment, Research & Evaluation, 17(8), 1-29. Retrieved from https://pareonline.net/
Lee, K., Tsai, P.-S., Chai, C., & Koh, J. (2014). Students' perceptions of self-directed learning and collaborative learning with and without technology. Journal of Computer Assited Learning, 30, 425-437. doi:10.1111/jcal.12055
Partnership for 21st Century Skills. (2011). Framework for 21st century learning. Washington.
Resta, P., & Laferriere, T. (2007). Technology in support of collaborative learning. Educational Psychology Review, 19, 65-83. doi:10.1007/s10648-007-9042-7
Schwartz, D., Tsang, J., & Blair, K. (2016). The ABCs of how we learn. New York: W.W. Norton & Company, Inc.
Shell, D., Husman, J., Turner, J., Cliffel, D., Nath, I., & Sweany, N. (2005). The impact of computer supported collaborative learning communities on high school students' knowledge building, strategic learning, and perceptions of the classroom. Journal of Educational Computing Research, 33 (3), 327-349. doi:10.2190/787L-BCBQ-20FN-FW6C
Tabachnick, B., & Fidell, L. (2014). Principal components and factor analysis. In B. Tabachnick, & L. Fidell, Using multivariate statistics (Sixth ed., pp. 660-729). Boston: Pearson Education Limited.
Teo, T., Tan, S., Lee, C., Chai, C., Koh, J., Chen, W., & Cheah, H. (2010). The self-directed learning with technology scale (SDLTS) for young students: An intial development and validation. Computers and Education, 55, 1764-1771.
doi:10.1016/j.compedu.2010.08.001
Terenzini, P., Cabrera, A., Colbeck, C., Parente, J., & Bjorklund, S. (2001). Collaborative learning vs. lecture/discussion: students' reported learning gains. Journal of Engineering Education, 123-130. doi:10.1002/j.2168-9830.2001.tb00579.x
Voogt, J., & Roblin, N. P. (2012). A comparative analysis of international frameworks for 21st century competences: Implications for national curriculum policies. Journal of
Curriculum Studies, 44(3), 299-321. doi:10.1080/00220272.2012.668938
Willett, J., Yamashita, J., & Anderson, R. (1983). A meta-analysis of instructional systems applied in science teaching. Journal of Research in Science Teaching, 20(5), 405-417. doi:10.1002/tea.3660200505
Appendix A: Reduced Student Questionnaire and Removed Items Reduced Student Questionnaire
1. In this class, I think about different approaches or strategies I could use for studying the assignments. (SDL1)
2. In this class, my classmates and I actively work together to help each other understand the material. (CL1)
3. In this class, my classmates and I actively work together to learn new things. (CL3) 4. In this class, my classmates and I actively discuss the ideas we have about things we are
learning. (CL4)
5. In this class, my classmates and I actively communicate via online platforms (e.g., Forum, MSN, wiki) to learn new things together. (CLT3)
6. In this class, my classmates and I actively challenge each other’s ideas in the online platforms. (CLT1)
7. In this class, I try to determine the best way to work on the assignments. (SDL2) 8. In this class, I use the computer to get ideas from different websites and people to learn
more about a topic. (SDLT1)
9. In this class, my classmates and I actively share ideas and information. (CL2)
10. In this class, I use the computer to organize and save the information for my learning. (SDLT2)
11. In this class, my classmates and I actively discuss our ideas online to come up with better ideas. (CLT2)
12. In this class, I use different computer programs to work on the ideas that I have learned. (SDLT3)
13. In this class, I try to check my progress when I study. (SDL4)
14. In this class, I use the computer to keep track of my learning progress. (SDLT5) Removed items:
1. In this class, my classmates and I actively work together to construct ICT-based documents (e.g., presentation slides, web pages). (CLT4)
2. In this class, I make plans for how I will study. (SDL3)
3. In this class, I find out more information on the Internet to help me understand my lessons better. (SDLT4)
Appendix B: Measurement model of reduced questionnaire following jackknifing procedure
Authors
Chantal Labonté is a doctoral student in School and Clinical Child Psychology within the Department of Educational Psychology at the University of Alberta. Her current research interests include educational technology, the development of children with neurodevelopmental disorders and developmental disabilities, and evaluation of programs and intervention meant to support developmental and educational outcomes. Email: clabonte@ualberta.ca
Veronica R. Smith holds a doctorate in Special Education. Her scholarship focuses on research and evaluation of educational programs, specifically programs aimed at improving the outcomes of children and youth with developmental and learning disabilities. As a former Speech and Language Pathologist, she is interested in intersections between practice, research, and capacity in applied settings. She is a Professor in the Department of Educational Psychology at the University of Alberta in Edmonton, Alberta and teaches courses in child development, evaluation, community-based research, and assessment and intervention for autism spectrum disorder. Email: vs2@ualberta.ca
This work is licensed under a Creative Commons Attribution-NonCommercial CC-BY-NC 4.0 International license.