HAL Id: hal-00304570
https://hal.archives-ouvertes.fr/hal-00304570
Submitted on 1 Jan 2001HAL is a multi-disciplinary open access archive for the deposit and dissemination of sci-entific research documents, whether they are pub-lished or not. The documents may come from teaching and research institutions in France or abroad, or from public or private research centers.
L’archive ouverte pluridisciplinaire HAL, est destinée au dépôt et à la diffusion de documents scientifiques de niveau recherche, publiés ou non, émanant des établissements d’enseignement et de recherche français ou étrangers, des laboratoires publics ou privés.
from passive microwave data
E. J. Burke, L. P. Simmonds
To cite this version:
E. J. Burke, L. P. Simmonds. A simple parameterisation for retrieving soil moisture from passive microwave data. Hydrology and Earth System Sciences Discussions, European Geosciences Union, 2001, 5 (1), pp.39-48. �hal-00304570�
A simple parameterisation for retrieving soil moisture from passive microwave data Hydrology and Earth System Sciences, 5(1), 39–48 (2001) © EGS
A simple parameterisation for retrieving soil moisture from passive
microwave data
E. J. Burke
1and L. P. Simmonds
21Department of Hydrology and Water Resources, University of Arizona, Tucson, Arizona-85721, USA. 2Department of Soil Science, University of Reading, Whiteknights, Reading, RG6 6DW, UK.
email for corresponding author: [email protected].
Abstract
MICRO-SWEAT, a physically based soil water and energy balance model coupled with a microwave emission model, was used to investigate the relationship between near surface soil moisture (θ0-5) and L-band microwave brightness temperature (TB) under a wide range of conditions.
The effects of soil texture, look angle and vegetation on this relationship were parameterised and combined into a simple summary model relating θ0-5 to TB. This model retains much of the physical basis of MICRO-SWEAT but can be used in more data limiting circumstances. It
was tested using a variety of truck-based L-band data sets collected between 1980 and 1982. This paper emphasises the need to have an accurate estimate of the vegetation optical depth (a parameter that describes the degree of influence of the vegetation on the microwave emission from the soil surface) in order to retrieve correctly the soil water content.
Keywords: passive microwave, soil moisture, remote sensing, vegetation, retrieval algorithm
Introduction
Coupling of remote sensing with physically based modelling of land surface processes is one method of using remotely sensed data more effectively. Recent developments in this field include models that couple soil-vegetation-atmosphere transfer schemes with models of microwave emission from the land surface, for example, MICRO-SWEAT (Burke et
al., 1997, 1998) and LSP/R (Liou and England, 1998; Liou et al., 1999; Judge et al., 1999). Applications of
MICRO-SWEAT include prediction of soil hydraulic properties (Burke et al., 1997, 1998); estimation of bare soil evaporation (Simmonds and Burke, 1999); and the development of a simple model that relates microwave brightness temperature to soil moisture for a bare soil (Simmonds and Burke, 1998; Burke and Simmonds, 2001). This paper discusses an extension of this simple model so that it can be applied to a vegetation-covered soil. The resulting model provides a tool with which to retrieve soil moisture from passive microwave radiometry at large scales with very limited ancillary information. It can also be used to explore the effects of subpixel heterogeneity in land surface properties on the accuracy of the retrieved soil moisture (Burke and Simmonds, 2001b).
The microwave brightness temperature of the land surface
measured by an L-band radiometer (1.4 GHz frequency) is inversely related to the top 5 cm soil water content (Schmugge et al., 1986). Both truck- and aircraft-based
L-band radiometers have been used to measure the
microwave brightness temperature during a variety of field experiments (Wigneron et al., 1998). These data have been used to establish and test (often empirical) relationships between the near surface soil moisture and the microwave brightness temperature under a variety of land surface conditions for a range of spatial and temporal resolutions. The simple physically based model developed in this paper will provide a suitable method for the retrieval of soil moisture that should be applicable under a wide range of conditions and require little site specific calibration.
MICRO-SWEAT
MICRO-SWEAT involves a sequential coupling of two simulation models. The first is a model of simultaneous heat and water in the soil-vegetation-atmosphere system (SWEAT — Daamen and Simmonds, 1996; Daamen, 1997). The soil component includes consideration of Darcian water flow through the soil matrix, isothermal and thermally driven vapour flow, and the conduction of heat through the soil. When vegetation is present, transpiration and root water
uptake are modelled assuming a simple electrical resistance analogue of soil-plant hydraulics. Water flow through the soil-plant system is coupled with the atmosphere via a stomatal resistance that depends on leaf water potential. The link between subsurface and surface processes and the atmosphere is made using the principles of the Shuttleworth and Wallace (1985) approach to modelling the latent and sensible heat fluxes from two interacting evaporating surfaces. This approach requires the partitioning of net radiation between the canopy and soil surfaces, which is one of the novel aspects of the latest version of SWEAT (Pearson
et al., 1999).
The outputs of SWEAT that are directly relevant to the modelling of microwave emission from the land surface are the vertical distributions of soil temperature and soil water content. The microwave component of MICRO-SWEAT makes use of the Wilheit (1978) model of radiative transfer in stratified media to predict the microwave intensity emergent at the soil surface. The Wilheit model requires knowledge of the vertical distribution of temperature and dielectric constant. The dielectric constant of the soil is derived from the simulated soil water content using the Wang and Schmugge (1980) semi-empirical mixing model, based on the proportions and dielectric properties of the soil constituents. Soil water is partitioned between bound-water (with dielectric properties of ice) and free-water according to the soil clay content.
Any overlying vegetation will absorb and scatter the microwave emission from the soil surface; it will also contribute with its own emission. At L-band and for moderately dense vegetation, scattering is negligible. Therefore, in these circumstances, the brightness temperature detected by a radiometer can be assumed to be the sum of the emission from the soil; the upward emission from the canopy; and the downward emission from the canopy that is reflected by the soil surface. In addition, the canopy will absorb a proportion of all energy that passes through it. A simple two-parameter (optical depth and single scattering albedo) model is successfully used within MICRO-SWEAT to account for these vegetation effects on the microwave emission from the soil at L-band (Burke et al., 1999). The optical depth (τ) defines the amount of absorption and emission by the canopy and is commonly estimated by:
veg
b
θ
τ =
(1)where θveg is the depth integrated vegetation water content and b is an empirically derived constant. There is some uncertainty as to the value of b, which has been shown to range from 0.075 to 0.72 m2kg–1 for a cropped soil at
L-band (Jackson and Schmugge, 1991). The single scattering
albedo defines the distribution of absorption and emission within the canopy. It is close to zero and is often assumed to be so (Jackson and Schmugge, 1991).
Several recent papers have presented examples of the verification of MICRO-SWEAT in which predicted time courses of brightness temperature have been compared with measurements using truck-mounted radiometry. These have included a range of bare and vegetated soils at both C (5.5 GHz) and L (1.4 GHz) band and at different look angles (Burke et al., 1997,1998; Simmonds and Burke, 1998,1999). In most cases, the predicted time courses have captured both the diurnal variation in brightness temperature as well as the day-to-day changes as the soil surface wets and dries. Typically, the root mean square of the error in predicted brightness temperature has been substantially less than 5 K.
Modelling framework
The approach adopted in this paper is based on the analysis of a set of simulations using MICRO-SWEAT. These simulations are based on a group of hypothetical soils covered by varying amounts of vegetation, with the brightness temperature evaluated at a variety of look angles. It is assumed that MICRO-SWEAT can be applied under the range of conditions discussed. The impact of look angle, soil type and amount of vegetation on the relationship between the simulated apparent emissivity and the simulated near-surface soil water content is examined. This knowledge is then used to develop a simple functional (and invertable) model of microwave emission that is driven by direct measurements of the near-surface soil water content.
The signal detected by a radiometer, i.e. the microwave brightness temperature (TB), is related to the microwave emission (eapp) by:
eff app B
e
T
T
=
(2)where Teff is the effective temperature of the soil. A simple sinusoidal model for the estimation of the effective temperature is outlined below, along with the development of the functional model relating microwave emission to the near surface soil water content, with particular emphasis on a smooth vegetated land surface.
EFFECT OF LOOK ANGLE ON THE VALUE OF TB
The horizontally polarised microwave brightness temperature of a bare soil decreases with increasing look angle. Hence, at larger look angles, the brightness temperature is much lower and therefore the soil appears wetter than it actually is. The decrease in TB is independent of the near surface water
A simple parameterisation for retrieving soil moisture from passive microwave data
content and the soil type, and is minimally affected by the effective temperature of the soil. A constant offset can be added to (subtracted from) the measured value of TB at x° to predict the value at 10°. This offset is well related to the look angle by a third order polynomial (Burke and Simmonds, 2001a).
In the presence of vegetation, as the look angle increases so does the distance the signal must travel through the vegetation. Thus the transmissivity (and effective optical depth) through the vegetation increases with increasing look angle. This increases the brightness temperature and hence makes the soil appear drier than it actually is. This effect is in opposition to the effect of look angle on the emission from bare soil discussed above. Therefore, as the amount of vegetation increases, these two opposing influences serve to reduce the impact of the look angle on the absolute value of the microwave brightness temperature. Figure 1 shows the relationship between the look angle and offset for a range of vegetation optical depths. These relationships can be quantified using a quadratic function of look angle, where the coefficients are dependent on the optical depth. At an optical depth of 0.6 the opposing effects of the bare soil emission and the increased path length through the canopy approximately cancel each other out and the brightness temperature becomes approximately independent of look angle.
ESTIMATION OF THE SOIL EFFECTIVE TEMPERATURE
Burke and Simmonds (2001a) showed that, for a bare soil, the MICRO-SWEAT modelled effective temperature is well represented by the modelled soil temperature at 11 cm. This can be approximated by the propagation of a sinusoidal temperature wave driven by the diurnal mean and amplitude
of the air temperature, assuming a relationship between soil thermal diffusivity and water content.
d z
e
d
z
t
A
T
t
z
T
(
,
)
=
+
0sin(
ω
+
φ
−
/
)
/ (3) where T(z,t) is the temperature at depth z and time t,T
is the mean temperature of the profile, A0 is the diurnal amplitude at the surface, ω is 2π times the frequency (i.e. 24 hours), φ is the time lag of surface temperature, and d is the damping depth:d
c
T h=
2
λ
1 2 (4) where λT is the soil thermal conductivity, and ch is the volumetric specific heat capacity of the soil. Though crude and with obvious limitations (e.g. the inappropriateness of the sinusoidal function during the passage of air fronts, and the discrepancy between the air and soil surface temperature), this simple approach does not introduce serious error into estimates of near surface soil water content for a bare soil. Equation 3 can also be used to evaluate the effective temperature under a vegetation canopy, although, in this case, the depth in the soil at which the effective temperature is well represented will no longer be 11 cm.EFFECT OF SOIL TYPE ON THE RELATIONSHIP BETWEEN eapp AND θ0-5
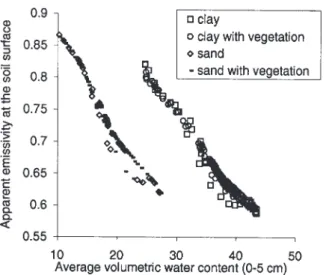
Previous work has examined the dependence of the bare soil relationship between eapp and θ0-5 on the soil particle size distribution (Simmonds and Burke, 1998). Figure 2 shows
Fig. 1. Effect of look angle on the microwave brightness
temperature. The factor, F is added to the brightness temperature to convert it to the brightness temperature at 10 degrees.
Fig. 2. MICRO-SWEAT simulated relationship between apparent
emissivity at the soil surface and near surface water content for two different soil types: a sandy soil and a clay soil. Shown are the relationships for bare soils and for the equivalent soils covered in
the relationship between eapp and θ0-5 that was obtained by plotting the appropriate values from each half-hour timestep of a 10-day simulated dry down for two contrasting soil types. Increasing clay content tends to increase the apparent emissivity associated with a given value of θ0-5. This increase is attributable mainly to differences in the soil dielectric constant caused by differences in bound/free water partitioning. This is readily quantified in relation to a “standard” soil (arbitrarily set to be a soil with 20% clay content) with “average” bound/free water partitioning (Simmonds and Burke, 1998; Burke and Simmonds, 2001a). Also shown in Fig. 2 is the relationship between eapp at the
soil surface and θ0-5 for a canopy 0.8 m tall with 100% cover, a leaf area index of 3, and the majority of its root distributed between 3 and 30 cm depth. This relationship is virtually identical to the equivalent bare soil relationship. This might be expected given that the relationship between eapp and θ0-5 for a bare soil is not much influenced by the shape of the near surface water content profile or temperature profile (Simmonds and Burke, 1998).
An important characteristic of the effect of soil texture on the relationship between eapp and θ0-5 (Fig. 2) is that the relationships are very close to being parallel and linear. Therefore it can be assumed that, although the intercept is related to soil type, the slope of the relationship is independent of the soil particle size distribution.
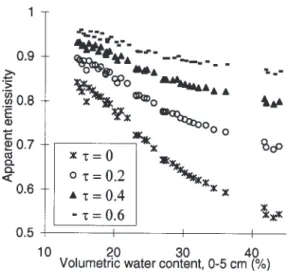
EFFECT OF VEGETATION ON THE RELATIONSHIP BETWEEN eapp AND θ0-5
The presence of a vegetation canopy affects the relationship between eapp and θ0-5 significantly. Figure 3 shows the
relationship that was obtained for the “standard” soil by plotting the appropriate values from each half-hour timestep for a 10-day dry down with a variety of small to moderate canopy sizes. By contrast with Fig. 2, the slopes of the relationships between eapp and θ0-5 are affected strongly by the size of the canopy. However for any specified soil type and any given canopy size, there is a unique relationship between eapp and θ0-5 that can be roughly approximated by a straight line, where the slope and intercept are dependent on the size of the canopy.
It should be noted that the impact on the relationship between eapp and θ0-5 of both the particle size distribution and the vegetation optical depth are independent of each other. Therefore, given a soil with a clay content different to that of the standard soil, the slopes of the relationship seen in Fig. 3 will remain the same. However, the intercept will change by an amount that is the same as the difference between the intercept of the equivalent bare soil and the “standard” bare soil.
The sections above have outlined the elements of the functional model used to predict the L-band brightness temperature from knowledge of the near surface soil water content, vegetation optical depth, soil particle size distribution and daily maximum and minimum air temperature. There follows a brief summary of the construction of this model.
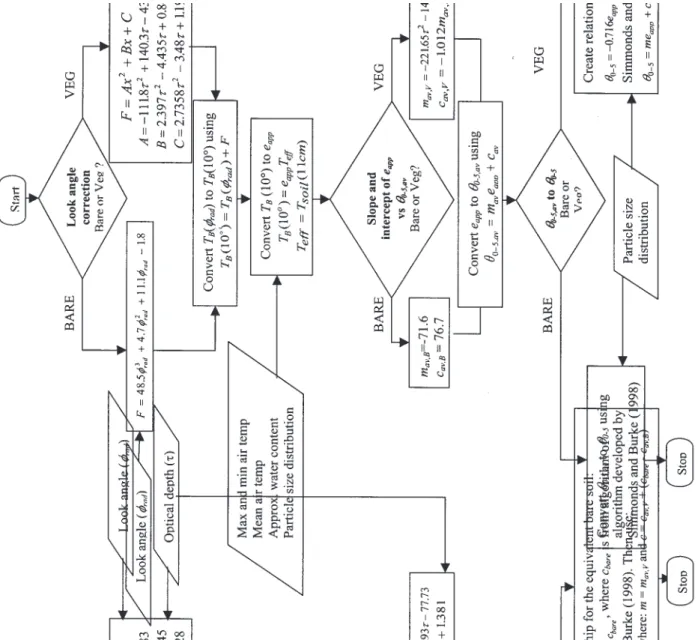
FUNCTIONAL MODEL RELATING TB TO θ0-5
Figure 4 formalises the functional model relating TB to θ0-5. In this illustration θ0-5 is derived from TB, but the model is invertable such that it can be used to derive TB fromθ0-5.
The first step is to correct the microwave brightness temperature to that which would be expected from a look angle of 10 degrees. An offset (F), which is related to the look angle and optical depth of the canopy, converts the microwave brightness temperature. The microwave brightness temperature at 10 degrees can then be converted to the apparent emissivity using Eqn. 2, given an estimate of the effective temperature. A linear relationship is used to derive the average near surface water content of the “standard” soil from the apparent emissivity. The slope and intercept of this relationship are predictable, and depend on the amount of vegetation present. The “standard” soil is designated to have “average” bound water/free water partitioning. The actual free water / bound water partitioning is then included to quantify the near surface water content of the actual soil under consideration. In the case of a bare soil, this is done using the method developed by Simmonds and Burke (1998). They assume that the dielectric constant of the actual soil at the actual near surface water content is the same as that of the standard soil at the derived average
Fig. 3. MICRO-SWEAT simulated relationship between
apparent emissivity and the near surface water content for a set of vegetation canopies with increasing optical depths.
A simple parameterisation for retrieving soil moisture from passive microwave data
Fig. 4.
Outline of the functional model r
elating micr
owave brightness temperatur
e to near surface soil moistur
near surface water content. In the presence of vegetation, a less accurate method is used. The slope of the relationship between apparent emissivity and near surface soil moisture is assumed to be independent of the soil particle size distribution. However, the intercept needs to be adjusted to convert the water content from that of the “standard” soil to that of the actual soil. The amount by which the intercept is altered is the same as the difference between the intercepts of the bare soil relationships for the “standard” and actual soils.
It should be noted that the relationships for the vegetated soil case do not reduce exactly to those for the bare soil when the optical depth is set to zero. This is because the empirical functions of optical depth contributing to the relationship for vegetated surfaces do not extrapolate to the more exact formulations used in the bare soil derivation.
Figure 5 shows the predicted relationship between apparent emissivity and near surface soil water content for a loamy sand soil (solid lines) compared with data from a 1985 field experiment (points). The value used for the optical depth of vegetation (0.33) was obtained from an earlier study (Burke
et al., 1997) by optimising the optical depth required to
achieve the best fit between the time courses of TB predicted using MICRO-SWEAT and radiometric measurements. The simple model estimates a linear relationship for the vegetated soil. In the case of a bare soil, the relationship consists of two linear segments (the slight break in slope occurs at a water content corresponding to the transition from the curvilinear to the linear portion of the relationship between dielectric constant and soil water content).
The following section discusses the sensitivity of this simple functional model to possible inaccuracies in the input data and errors in the model formulation, before validating the model with a series of data sets.
Sensitivity analysis
This section explores the sensitivity of the functional model to errors in the input data to quantify the accuracy of any soil moisture retrievals. In general, the larger the vegetation canopy, the greater the potential for error (Fig. 3). At the higher vegetation water contents (θveg > ~ 5 kg m–2), the signal
from the vegetation completely dominates that from the soil (Fig. 3). Under these conditions the retrieval of soil moisture is effectively impossible (although this may not be the case for forests). This is consistent with the conclusion of Schmugge et al. (1986) that an optical depth greater than 0.7 is beyond the limit of useful sensitivity for soil moisture measurements. The following paragraphs explore the impact on the retrieved soil moisture (θret) of each of the potential errors in turn:
l Instrumental error – A typical instrumental error is
± 3 K, or an emissivity of approximately ± 0.01. Figure 3 shows that the sensitivity of the signal to the soil water content decreases with increasing optical depth. For a bare soil, error in θret resulting from instrumental error is about 0.8%, which is minimal. However for a moderately dense vegetation (optical depth of 0.5), the error increases to about 2.5%. These errors are independent of the absolute value of θret or eapp.
l Look angle measurement – Inaccurate measurement
of the look angle will have the greatest effect on the retrieved soil water content at high look angles for soils with minimal vegetation. For a bare soil, at a look angle of 40°, a typical error maybe ± 1°, leading to an error of 0.5% in θret.
l Effective temperature determination – An extreme
error in the estimation of effective temperature using the simple sinusoidal model of soil temperature is around ± 5 K. At low optical depths (0.2) this introduces an error of around 1.6% into θret, whereas at higher optical depths (0.6) the error can be as much as 4%.
l Optical depth determination – The accuracy of the
optical depth is crucial to the accuracy of θret. Given knowledge of the optical depth to ± 0.05, there will be an error of as much as ± 2.5%. This error increases with high water contents and low optical depths.
l Soil texture determination – Inaccuracies in the particle
size distribution measurement of ± 10% clay will result in an error of less than 1% in the retrieved soil moisture.
Fig. 5. Comparison of the relationship between apparent emissivity
and soil moisture calculated using the functional model (lines) with measurements collected during a 1985 field experiment (symbols)
A simple parameterisation for retrieving soil moisture from passive microwave data
These errors are independent of the absolute value of
θret or eapp.
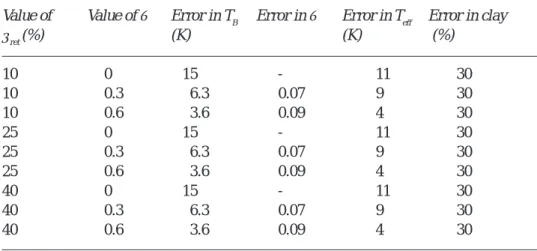
Table 1 shows examples of the accuracy demands on the input parameters to achieve an accuracy in θret of ± 3% in
θret = 10%, 25%, and 40% (a typical error — Jackson et al., 1999). It should be noted that, in reality, all of these inaccuracies will be acting together, so, for some examples, especially at the higher optical depths, an error of less than ± 3% could be hard to achieve.
Verification of the soil moisture retrieval
algorithm
This paper analyses selected results from a series of field experiments carried out between 1980 and 1982 (Wang et
al., 1980, 1984; O’Neill et al., 1983). The microwave
brightness temperature was monitored using a truck-based
L-band radiometer under a wide range of conditions. In all
cases, gravimetric soil moisture samples of the top 4 or 5 cm of soil were available to compare with θret.
The first comparison uses data collected over a period of three years for a bare soil sandy loam site with look angles between 10° and 70°. Figure 6 compares the theoretical correction factor that needs to be subtracted from TB at x° to obtain TB at 10° (F — Fig. 4) with the observed differences between TB at x° and TB at 10°. There is a large spread in the observed offset that increases from 20 K at low angles, up to 40 K at higher angles. This spread alone could result in an error of ± 2.5% in θret, even when using data at low look angles. The theoretical offset falls within the observed range of offsets. At the larger angles roughness effects would be more influential, and thereby cause the decrease in observed
offset when compared to the theoretical curve. Figure 7 shows
θret compared to the measured soil moisture for look angles less than 45°. The root mean square error is 3.2% by volume, which is of the order expected from the discrepancy between the predicted and actual effects of look angle on the brightness temperature (Fig. 6).
The second comparison uses 1983 data collected over three different soils each covered by different vegetation canopies (O’Neill et al., 1983). Burke and Simmonds (2001a) showed good agreement between the retrieved and measured soil moisture for the bare soil examples (a sandy loam, a loam and a clay loam). This paper examines the same soils each covered by a different vegetation canopy. The optical depths
Table 1. Errors in algorithm ancillary data that result in a ± 3% error in θret = 10%, 25%, and 40% by volume at three different values of the optical depth (0, 0.3, and 0.6)
Value of Value of τ Error in TB Error in τ Error in Teff Error in clay
θret (%) (K) (K) (%) 10 0 15 - 11 30 10 0.3 6.3 0.07 9 30 10 0.6 3.6 0.09 4 30 25 0 15 - 11 30 25 0.3 6.3 0.07 9 30 25 0.6 3.6 0.09 4 30 40 0 15 - 11 30 40 0.3 6.3 0.07 9 30 40 0.6 3.6 0.09 4 30
Fig. 6. Comparison of the relationship between the microwave
brightness temperature correction factor (F) and look angle calculated using the functional model with measurements collected over a bare sandy loam soil during field experiments in three
of the vegetation canopies (Table 2) were estimated using the available vegetation water content measurements (sorghum — one at the start and b = 0.095 m2 kg-1; corn —
average of three and b = 0.119 m2 kg-1; soybeans — none
available so the optical depths were fitted). The relationship between the bare soil moisture and the measured microwave brightness temperature is well predicted for this field experiment (Burke and Simmonds, 2001a), as is that for the soybeans found using the fitted optical depth. Therefore it is suggested that the poor agreement (particularly large bias) between the measured and modelled soil water content in
the sorghum and corn cases is because the optical depths are poorly estimated. The best fit optical depth for the sorghum is 0.49 and for the corn 0.61. If these values were used in Fig. 8, the root mean square error between the retrieved and measured soil water contents would be less than 2.0% by volume.
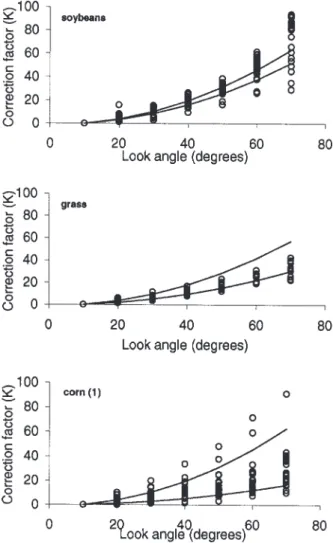
This final example uses data collected over five different vegetation covers and a sandy loam soil (Wang et al., 1984). The microwave brightness temperature was monitored sporadically through the growing period (June to September) at a range of look angles from 10 to 70 degrees. The vegetation water content was also measured throughout the growing period. For these examples, the optical depths were calculated using the measured vegetation water contents (extrapolated where necessary) and a constant of proportionality (Jackson and Schmugge, 1991). The applicability of the look angle correction factor was tested (Fig. 9), where the theoretical curves represent the maximum and minimum optical depths. As with the analysis of the 1982 data set (Fig. 6), there is a better agreement at the lower look angles. The vegetation effects dominate the signal at the higher look angles; therefore, it is preferable to use the lower look angles to retrieve soil moisture. Figure 10 compares the retrieved and measured soil moisture for the five different plots. The large bias between the retrieved and measured soil water content for the second corn plot and the soybean plot suggests that the optical depths are particularly poorly defined. On average, the root mean square error is of the order of 4% soil water content (Table 2).
Fig. 7. Comparison of measured soil moisture with the retrieved soil
moisture for data collected over a bare sandy loam soil during three separate time periods at look angles less than 45 degrees.
Table 2. Evaluation of the root mean square error and bias
between the retrieved and measured soil moisture.
Site min τ max τ Root mean Bias (% vwc)
square error (retrieved –
(% vwc) measured) 1982 corn 0.55 2.6 –2.3 sorghum 0.36 5.1 –4.2 soybeans 0.35 2.4 0.4 1981 alfalfa 0.045 0.146 2.1 –0.1 corn (1) 0.005 0.39 2.3 –0.4 corn (2) 0.06 0.135 5.3 –4.2 grass 0.096 0.143 2.3 –1.8 soybeans 0.002 0.072 4.0 4.0
Fig. 8. Comparison of retrieved and modelled soil moisture for three
different vegetation types monitored during a 1982 field experiment. In this example the optical depth was fitted to minimise the error
A simple parameterisation for retrieving soil moisture from passive microwave data
Conclusions
This paper discusses an application of MICRO-SWEAT, a coupled soil water and energy balance model linked with a microwave emission model. Synthetic simulations from MICRO-SWEAT were used to develop a simple functional model relating soil moisture to microwave brightness temperature. The functional model retains much of the physical basis of MICRO-SWEAT but requires minimal ancillary data and, therefore, can be used in many circumstances under which MICRO-SWEAT could not normally be run. In the examples under consideration, the soil moisture is retrieved to an accuracy of 3–4%. It should be noted that some of the errors may well be as a result of soil roughness, which has been assumed to be zero here.
Sensitivity studies have shown that, for an error of 3% in the retrieved soil moisture, the optical depth needs to be known to an accuracy of 0.06 (0.4 kg m–2 vegetation water
content). However, this is only the case when there are no other errors in the input data. Errors in the estimate of the effective temperature, particle size distribution and radiometer instrumental errors will also contribute to the error in soil moisture, and make the accuracy demand on the optical depth more exacting.
The only L-band satellite mission approved to date is the SMOS mission. This will provide microwave brightness temperatures at a range of look angles. Potentially, these measurements can provide an estimate of both the optical depth and the soil moisture, thereby negating the requirement for an accurate independent estimate of the optical depth. Given data at a wide range of look angles, the relationship between microwave brightness temperature and look angle (Fig. 1) can be used to retrieve the vegetation optical depth, before using the proposed algorithm to estimate the soil moisture.
Acknowledgements
Primary funding for this research was provided under NOAA grant number NA96GP0412. Additional funding was provided under a NERC grant GR3/11203.
References
Burke E.J., Gurney, R.J., Simmonds, L.P. and O’Neill P.E., 1998. Using a modelling approach to predict soil hydraulic properties from passive microwave measurements. IEEE T. Geosci. Remote
Sens. 36, 454–462.
Burke E.J., Gurney, R.J., Simmonds, L.P. and Jackson, T.J., 1997. Calibrating a soil water and energy budget model with remotely sensed data to obtain quantitative information about the soil.
Water Resour. Res., 33, 1689–1697. Fig. 9. Modelled (lines) and measured (symbols) relationship
between look angle and microwave brightness temperature correction factor (F) for three different vegetation covers.
Fig. 10. Comparison of measured and modelled soil moisture for 4
different vegetation covers (alfalfa, grass, corn and soybeans) monitored during a 1981 field experiment.
Burke, E. J. and Simmonds, L.P., 2001. Passive microwave emission from bare soils: developing a simple model to predict near surface water content, Int. J. Remote Sens. in press.
Burke, E.J., Wigneron, J.-P. and Gurney, R.J., 1999. The comparison of two models that determine the effects of a vegetation canopy on passive microwave emission. Hydrol. Earth System Sci. 3, 439–444.
Daamen, C.C. and Simmonds, L. P., 1996. Measurement of evaporation from bare soil and its estimation using surface-resistance. Water Resour. Res., 32, 1393–1402.
Daamen, C.C., 1997. Two source model of surface fluxes for millet fields in Niger. Agr. Forest. Meteorol. 83, 205–230.
Jackson, T.J. and Schmugge, T. J., 1991. Vegetation effects on the microwave emission of soils. Remote. Sen. Environ. 36, 203–212. Jackson, T.J., Le Vine, D.M., Hsu, A.Y., Oldak, A., Starks, P.J., Swift, C.T., Isham, J.D. and Haken M., 1999. Soil moisture mapping at regional scales using microwave radiometry: The Southern Great Plains Hydrology Experiment. IEEE T. Geosci.
Remote Sen. 37, 2136–2151.
Judge, J., England, A.W., Crosson, W.L., Laymon, C.A., Hornbuckle, B.K., Boprie, D.L., Kim, E.J. and Liou, Y.A., 1999. A growing season Land Surface Process/Radiobrightness model for wheat-stubble in the Southern Great Plains. IEEE Trans.
Geosci. Remote Sen. 37, 2152–2158.
Liou, Y.A. and England, A.W., 1998. A land surface process radiobrightness model with coupled heat and moisture transport in soil. IEEE Trans. Geosci. Remote Sen., 34, 273–286. Liou, Y.A., Galantowicz, J.F. and England, A.W., 1999. A land
surface process radiobrightness model with coupled heat and moisture transport for prairie grassland. IEEE Trans. Geosci.
Remote Sens., 37, 1848–1859.
O’Neill, P., Jackson, T., Blanchard, B., van den Hoek, R ., Gould, W., Wang, J., Glazar, W. and McMurtrey III, J., 1983. The effects of vegetation and soil hydraulic properties on passive microwave remote sensing of soil moisture: data report for the 1982 field experiments. NASA technical memorandum 85106.
Pearson, D., Daamen, C.C., Gurney, R.J. and Simmonds, L.P., 1999. Combined modelling of shortwave and thermal radiation for one-dimensional SVATs. Hydrol. Earth System Sci., 3, 15–30. Schmugge, T.J., O’Neill, P.E. and Wang, J.R., 1986. Passive soil
moisture research. IEEE Trans. Geosci. Remote Sen. 24, 12–22. Shuttleworth, W.J. and Wallace, J.S., 1985. Evaporation from sparse crops - an energy combination theory. Quart. J. Roy. Meteorol.
Soc., 111, 839–855.
Simmonds, L.P. and Burke, E.J., 1999. Application of a coupled microwave, energy and water transfer model to relate passive microwave emission from bare soils to near-surface water content and evaporation, Hydrol. Earth System Sci., 3, 31–38. Simmonds, L.P. and Burke, E.J., 1998. Estimating near-surface soil
water content from passive microwave remote sensing - an application of MICRO-SWEAT, Hydrol. Sci. J., 43, 521–534. Wang, J.R., Jackson, T.J., Engman, E.T., Gould, W., Fuchs, J.,
Glazar, W., O’Neill, P.E., Schmugge, T.J. and McMurtrey, J., 1984. Microwave radiometer experiment of soil moisture sensing at BARC test site during summer 1981, NASA technical
memorandum 86056.
Wang, J., Shiue, J., Engman, E., McMurtrey, III, J., Lawless, P., Schmugge, T., Jackson, T., Gould, W., Fuchs, J., Calhoon, C., Carnahan, T., Hirschmann, E. and Glazar, W., 1980. Remote measurements of soil moisture by microwave radiometers at BARC test site. AgRISTARS SM-G0-00471, TM 80720, NASA/ GSFC.
Wang, J.R. and Schmugge, T.J., 1980. An empirical model for the complex dielectric permittivity of soils as a function of water content. IEEE Trans. Geosci. Remote Sen., 18, 288–295. Wigneron, J.-P., Schmugge, T.J., Chanzy, A.C., Calvet, J.-C. and
Kerr, Y.H., 1998. Use of passive microwave remote sensing to monitor soil moisture. Agronomie, 18, 27–43.
Wilheit, T.T., 1978. Radiative transfer in a plane stratified dielectric.