ISSN 2688-5255ll06/06llpp71–81 Volume 1, Number 1, September 2020 DOI: 10.23919/JSC.2020.0007
C The author(s) 2020. The articles published in this open access journal are distributed under the terms of the Creative Commons Attribution 4.0 International License (http://creativecommons.org/licenses/by/4.0/).
Diversity of Idea Flows and Economic Growth
Alex Pentland⇤
0001
Abstract: What role does access to diverse ideas play in economic growth? New forms of geo-located
communications and economic data allow measurement of human interaction patterns and prediction of economic outcomes for individuals, communities, and nations at a fine granularity, with the strongest predictors of income, productivity, and growth being measures of diversity and frequency of physical interaction between communities (clusters of interaction). This finding provides both new investment opportunities and new methods of risk assessment. Access and use of these data raise privacy and security risks, and the final section of the paper describes how these challenges can be controlled.
Key words: idea flow; opportunity; wealth; inequality; segregation; foraging; privacy; policy
0002
Abstract: This paper poses a question: How many types of social relations can be categorized in the
Chinese context? In social networks, the calculation of tie strength can better represent the degree of intimacy of the relationship between nodes, rather than just indicating whether the link exists or not. Previou research suggests that Granovetter measures tie strength so as to distinguish strong ties from weak ties, and the Dunbar circle theory may offer a plausible approach to calculating 5 types of relations according to interaction frequency via unsupervised learning (e.g., clustering interactive data between users in Facebook and Twitter). In this paper, we differentiate the layers of an ego-centered network by measuring the different dimensions of user's online interaction data based on the Dunbar circle theory. To label the types of Chinese guanxi, we conduct a survey to collect the ground truth from the real world and link this survey data to big data collected from a widely used social network platform in China. After repeating the Dunbar experiments, we modify our computing methods and indicators computed from big data in order to have a model best fit for the ground truth. At the same time, a comprehensive set of effective predictors are selected to have a dialogue with existing theories of tie strength. Eventually, by combining Guanxi theory with Dunbar circle studies, four types of guanxi are found to represent a four-layer model of a Chinese ego-centered network.
Key words: tie strength; Dunbar circle theory; Chinese Guanxi theory; supervised classification model;
social network
1 Introduction
The wide adoption of mobile phones, social media, digital payments, and similar technologies has dramatically changed our ability to understand the social and financial functioning within our neighborhoods, cities, and countries. With data at the scale and granularity that are now available, one can get a picture of society that was unimaginable only a few years ago. This ability to see a broad spectrum of human behaviors continuously and quantitatively has created a new scientific discipline called computational social science[1]and it is beginning to transform disciplines,
such as sociology, political science, and psychology[2, 3].
Perhaps the main contribution these new data make to existing science is that they allow researchers to discover how patterns of human interaction influence social and economic outcomes. This makes sense because human interaction is the medium which supports trade, norm creation, collective action, and idea spread. Recent advances in understanding these patterns of interaction are already helping decision makers to tackle problems of societal importance, such as monitoring socio-economic deprivation[4–8]and crime
✏ Alex Pentland is with Massachusetts Institute of Technology (MIT), Cambridge, MA 02139-4307, USA. E-mail: pentland@ mit.edu.
⇤To whom correspondence should be addressed.
Manuscript received: 2020-07-17; accepted: 2020-08-17
levels[9–11], mapping the propagation of diseases[12, 13],
and understanding the impact of natural disasters, environmental risks, and other emergencies[14–16]. These
successes have encouraged the United Nations (UN) to identify these new data methods as a “data revolution” that will allow countries to regularly and inexpensively measure progress toward the Sustainable Development Goals (SDGs), including the goals of zero poverty, zero hunger, good health, clean water and energy, gender equality, sustainable cities, quality education, and other goals by 2030[4].
This same data revolution is also beginning to transform economics, finance, and investment. Economic theory and indeed most of our civic systems are based on the idea that humans are rational individuals. This paper argues that this model of human motivation is insufficient to understand economic outcomes in unconstrained, natural settings. Even rational “self-interested” agents should not be considered as isolated individuals, because (1) their decisions are strongly shaped by influence from others, and (2) they derive great economic benefit from peer-to-peer interaction, and especially interactions that cross community boundaries. Indeed, these “social bridges” between communities are often one of the largest single factors in predicting economic outcomes.
This claim is supported by three lines of evidence: Firstly, an actor with greater interaction diversity is exposed to more opportunities, and thus can gain more
wealth. Secondly, humans increase interaction diversity through the sort of foraging behavior seen in most species: An actor explores for new resources while still exploiting known opportunities, and the balance of exploration versus exploitation of known opportunities is a critical determinant of economic outcomes. Finally, social bridges across communities are especially useful for discovery of novel useful insights and thus enhance the rate of innovation and lead to superior economic outcomes. The flow of new ideas from one community to another thus accounts for a substantial portion of economic growth and barriers to such flow (such as segregation) are an important factor in the persistence of inequality.
In this paper, the author will present an overview of evidence supporting each of these three propositions by using these new geo-location and financial data resources drawn from a wide variety of cities in the United States (US), European Union (EU), and Asia. The author will also provide a commentary on how these insights are challenging widely accepted theories of economic development and investment, and also how we can safely use these new data resources to build better investment and risk management systems.
2 Wealth Comes from Finding New
Opportunities
What do these new data and analytics tools show? The short answer is that we are less individuals (rational or not) than we are creatures of our social networks. For instance, Fig. 1 shows data from a sample of 100 000 randomly selected mobile telephone customers in a mid-income country and compares their ability to hear about new opportunities (measured by the diversity of the communities that they interact with) to their income[17].
Access to new opportunities can be estimated by the structural diversity of their social network and quantified by either the network clustering coefficient (number of closed triads) or Burt-style measures of structural novelty[8], either measure gives similar results in this
analysis.
This example demonstrates that people who have more open networks, and thus have more access to new ideas and opportunities[8], tend to make more money.
Moreover, this is not just an artifact of the way that the particular way access to diverse communities was measured, because you can get the same result looking at the diversity of jobs of the people they interact with, or
Fig. 1 As individuals’ social networks become more structurally diverse, e.g., they interact with more diverse communities, their income increases[17]. Sample is 100 000 randomly chosen people in mid-income country. Similar results are obtained whether structural diversity is measured by either network clustering coefficient (number of closed triads) or Burt-style measure of structural novelty[8].
the diversity of locations of the people that they interact with. Surprisingly, if you compare people who have less than a 7th grade education to the entire population, the curve moves only a little to the left. If you look at people with college education or more, the curve moves only a little bit to the right. The variation that has to do with education is small when compared with the variation that has to do with access to ideas from diverse communities. These data also throw new light on why inequality is so persistent and why poverty alleviation is so difficult. Analysis of this data also shows that poor people interact mostly with other poor people, and wealthy with wealthy. Consequently, poor communities have restricted access to the lucrative opportunities available to the wealthy, and best opportunities circulate mostly within wealthy communities[17]. Moreover,
segregation of opportunity is not primarily due to residential segregation. The majority of such segregation is due to norms of behavior, e.g., what locations you feel comfortable visiting and what amenities you feel comfortable using (see http://inequality.media.mit.edu for further detail and maps of behavioral inequality for all major US metropolitan areas).
It is important to ask if greater network diversity causes greater income or whether it is the other way around. The answer is that greater network diversity indeed causes greater income on average. This is similar to the idea of weak ties bringing new opportunities[8],
networks to be more diverse. Wealth creation is a complex, dynamic feedback process with no one causal factor. Instead of asking about causality, it is instead better to ask about the relative strength of each part of this complex, dynamic system. Figure 1 strongly suggests that access to diverse ideas is an important influence on the wealth generation process.
The hypothesis that increased interaction between communities predicts the flow of new ideas from one community to another, and that the flow of ideas accounts for a substantial portion of economic growth, has recently been shown for the large-scale interactions found between nations[18, 19]. Moreover, the flow of ideas
appears to be a causal factor, and not just a correlational factor, because nations with large volumes of interaction have convergence in skills, technology, and productivity over the long run.
The work presented here shows that the connection between diverse interaction patterns, idea flow, and economic growth is also a major effect at the scale of individuals, neighborhoods, and cities. As a consequence, observed patterns of interaction can be used to help evaluate the financial viability of individuals, businesses, and local infrastructure projects by predicting the likelihood of their economic growth. Similarly, local economic growth can be fostered by investments that increase idea flow by changing patterns of interaction by, for instance, improving transportation infrastructure. Importantly, such investments can be evaluated in terms of predicted economic growth, as we will see in a later section of this paper.
The importance of interaction patterns is surprising to many people, because we generally assume that individual features far outweigh social network factors. However, rather than thinking of people as independent innovators, it seems more accurate to conceive of humans as a species who are on a continual search for new innovations to copy and for new opportunities to apply known innovations. Social networks serve as a major, and perhaps the dominant resource, for discovering new innovations and opportunities. Like all other social species, our lives consist of a balance between habits that allow us to exploit our environment and exploration to find new opportunities[20], as
illustrated in Fig. 2.
In the animal literature, this is known as foraging behavior. This is the tension between exploitation and exploration and it is also the character of normal human life. For example, when we examined credit card data
Fig. 2 Foraging behavior is characteristic of human financial patterns around the world. It shows credit card purchase locations of a single person over one month. Circle size is proportional to purchase frequency, and arrows show the likelihood of transition between the purchase locations[20]. Typically people maintain a balance between habits (large circles and arrows) and exploration (small circles and arrows).
for 100 million people in the US[20], we found that
people are immensely predictable. Most of people’s purchases are habitual and occur at a small number of places (large circles) and the sequence of their purchases is highly predictable (indicated by thickness of arrows). For a typical person on a typical day, simple Markov modeling achieves about 90% accuracy in predicting the sequence of daily purchases given the first purchase of the day. However, for one or two days each week, the typical person will break free of their daily habits and explore new places. They typically visit these new locations only very occasionally (small circles) and these exploratory sequences of purchase behavior are extremely unpredictable. Individuals and neighborhoods with more exploration tend to have greater economic growth.
Moreover, individuals who fail to show this pattern are typically sick or stressed in some way. Consequently, an indicator of whether a person’s life is healthy in a general sense — both mental and physical — is whether or not they show this most basic biological rhythm[21].
This tendency is regular enough that one of the largest health services in the US is using this to keep track of the health of at-risk patients (see, for instance, our spin-off company ginger.io). Similarly, some changes in a person’s exploration pattern are typically indicative of financial worries. In our experiments, we find we can use the pattern of exploratory behavior to accurately predict whether an individual will have financial troubles with
approximately three months advance warning[22].
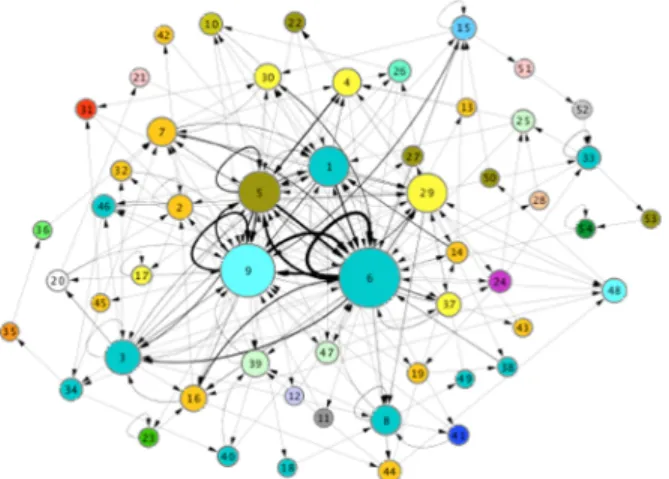
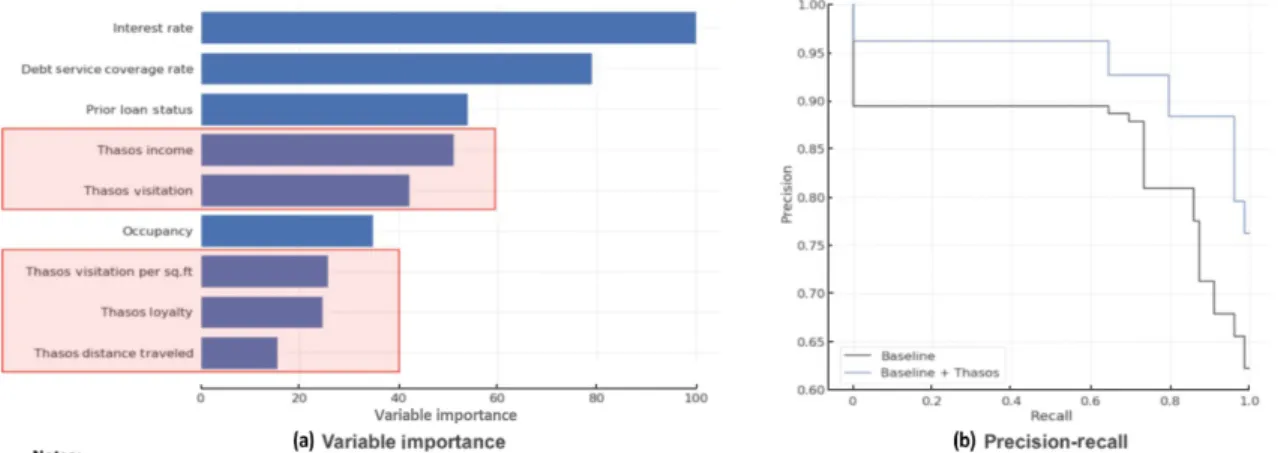
Turning this pattern of foraging behavior inside out and looking at the mathematical dual of all the individual purchase networks provides an estimate of the visitation network from the point of view of stores and other commercial venues. The pattern of a store’s patronage, e.g., how many people, from which demographics and how far they travel to get to the store, is quite informative of the store’s future financial health. Figure 3 shows a recent result produced by the Thasos Group (an MIT spin-off company) and provided to investors by Bloomberg.
Finally, if you combine the idea of foraging for novelty with the concept that diverse networks bring greater opportunities and greater income, you would expect that cities that facilitate connecting with a wide range of people would be wealthier. To test this hypothesis, we gathered data from 150 cities in the US and 150 cities in the EU and examined the patterns of physical interactions between people[23].
We found that if a city’s infrastructure facilitates more diverse physical interactions, then over the long term, the citizens make more money[23]. What we found was
that the “reach” of the average person’s interaction, e.g., the number of different people they can potentially interact with, predicts Gross Domestic Product (GDP) per square kilometer extremely accurately, in both the US and EU. What this suggests is that the factors that we usually think about — investment, education, infrastructure, and institutions — may not be the direct cause of GDP growth. Instead they may make a difference primarily because they help or hinder the search for new opportunities. The fundamental driver of progress in society may be the search for new opportunities and the
factors we usually think about, e.g., people’s skills or capital investment, may be the only secondary factors.
This perspective on human development and the evolution of society is not new. Two centuries ago, Auguste Comte, the creator of sociology, developed the concept of “social physics”, holding that the spread of ideas shaped the development of society in a regular and predictable manner. While his theories were in many ways too simplistic, findings such as described above show that he was going in the right direction. It is the flow of ideas and opportunities between people that drives society, providing quantitative predictions at scales ranging from small groups to companies, cities, and even entire countries[24].
3 Building Social Bridges: Opportunity for
Investment
Cities are a great example of how the process of foraging for new opportunities shapes human society. Cities are major production centers of society, and as we have already seen, cities in which it is easy to search for new opportunities are wealthier. Long-term economic growth is primarily driven by innovation in the society and cities facilitate the human interaction and idea exchange needed for good ideas and new opportunities to spread. For example, success on Wall Street often involves knowing about new events before the majority of other people. In these sorts of environment, the informational advantages of extreme spatial proximity become very high. This may explain why Wall Street remains in a tiny physical area in the tip of Manhattan. The spatial concentration of economic actors increases productivity at the firm level by increasing the flow of new ideas, both within and across firms.
Our evidence suggests that bringing together people from diverse communities will be the best way to construct a vibrant, wealthy city. When we examine flows of people in real cities, we find that their physical infrastructure limits physical mixing more than we usually assume. People who live in one neighborhood typically work and shop in only a few other neighborhoods (see http://inequality.media.mit.edu). Consequently, there are a small number of social bridges formed by the pattern of physical interaction between their home neighborhood and other neighborhoods. When neighborhoods are connected by social bridges so that their residents spend time together, whether at work or at play, they learn from each other. Over time, connected neighborhoods begin to adopt similar behaviors and attitudes, along with similar skills, knowledge, and productivity[25].
Social bridges. A way to quantify the potential for social learning through physical proximity between two neighborhoods X and Y is to measure the likelihood that an individual from neighborhood X will spend time nearby an individual from neighborhood Y. This can happen when a person from one neighborhood visits the other neighborhood, but also if people from the two neighborhoods work or frequently shop at near-by locations. We can estimate this social bridge likelihood by use of data, such as sequences of Global Positioning System (GPS) fixes from mobile telephones, or by comparing the time and location of credit card purchases. Use of such data poses significant privacy concerns, which we address in the final section of this paper.
Marketing. We find that the social bridge structure of a city predicts all sorts of behaviors, such as what sort of clothes individuals buy and how they deal with credit cards. Even behavioral diseases, such as diabetes or alcoholism, flow predominantly within groups connected by social bridges. Behavior patterns do not follow demographic categories nearly as closely. In a recent study of a large European city, for instance, we found that social bridge structure was more than 300% better at predicting a wide range of behaviors than demographics, such as age, gender, income, and education (see Table 1). This means that financial systems based on a demographic stratification of the population (i.e., virtually all consumer finance systems) are performing far worse than they would if they were based on a behavior-based stratification[25].
Groups of people joined by rich social bridges form local cultures. Consequently, by knowing the places
Table 1 Social bridges, which are the pattern of physical interaction between neighborhoods, predict purchasing and financial decisions three times better than traditional demographics[25].
Indicator Pearson’s r (part. corr.)with # co-visits p-value computedusing QAP # Social bridges 0.7063 <1⇥10 4 Age 0.1327 <1⇥10 4 Gender 0.1586 <1⇥10 4 Marital status 0.0834 1.4⇥10 4 Education 0.1818 <1⇥10 4 Working style 0.0472 0.0093 Income 0.1775 <1⇥10 4 Socio-demographics +income 0.2261 <1⇥10 4
in which a person hangs out, you can tell a great deal about their preferences and behaviors. The process of learning from each other by spending time together means that ideas and behaviors tend to spread mostly within the clusters of neighborhoods connected by rich social bridges, but only slowly between unconnected clusters. Concretely, we observe that adoption of a new type of shoe, a new genre of music, and a political viewpoint, will spread within such connected clusters, but will cross cluster boundaries only slowly. Marketers talk about influencers changing people’s minds, but the more powerful effect seems to be that when people spend time together, they begin to mimic each other, they learn from each other, and they adopt similar behaviors and attitudes.
The social bridges idea is based on the observation that individuals can commonly be identified as part of a community with relatively homogeneous behavior based on where they live, work, and shop. Where you invest your most valuable resource — time — reveals your preferences. Each community typically has access to different pools of information, opportunities, or has different perspectives. Diverse interactions between communities can therefore increase a population’s access to the opportunities and ideas required for productive activity and economic growth. The notion of increased access to opportunities includes not only learning about economic opportunities (e.g., new or inefficient markets), but also increased access to specialized equipment, highly-skilled individuals, and capital.
The view that physical mixing between different communities strongly influences the rate of innovation and financial growth is reinforced by two other studies recently completed in China. The first study looked at factors that were important in success of new businesses
by performing a survey of startups launched from 3255 government-sponsored incubators throughout China[26].
Table 2 shows the result that cultural diversity was the biggest factor in successful launch and funding of startups, and that diversity of industrial experience was most important in the subsequent growth and scaling of these startup companies.
The second study looked at whether investment in high-speed rail infrastructure was a causal factor in promoting the spread of companies with specialized commercial expertise[27]. The blue solid line at the
bottom in Fig. 4 shows the increasing rate of company creation in all cities in China. The red solid line at the top of Fig. 4 shows the rate of specialized company creation in cities that became connected to cities that had pre-existing companies with the same specialized expertise. In other words, when a city “X” with few Information Technology (IT) companies is connected by high speed rail to a city “Y” that already has many IT firms, the rail connection strongly promotes creation of more IT firms in city “X”. From this comparison, we can conclude that the spread of ideas because of these new rail connections caused an increase of company creation within specialty or category that was almost 50% greater for connected cities than the general rate of company creation. In both studies, mixing communities with different expertise and practice resulted in greater rates of company creation.
Wealth creation. When we apply this logic to neighborhoods in the US, Asia, and Europe, we find that diversity of social bridges (physical interaction) between communities predicts up to 50% of the variance in year-on-year GDP growth, as illustrated in Fig. 5. In other words, the effect on GDP of diversity of idea
Table 2 Regression results of diversity and innovation. A survey of all Chinese startups in government-sponsored incubators, showing that cultural diversity is the biggest factor in successful launch and funding of startups[26].
Variable Intellectualproperty (Poisson)
Commercializing performance
(OLS) Culture Diversity (CD) 2.581***(12.66) 1.214***(4.05) Industries Diversity (ID) 1.167***(4.99) 1.902***(5.72)
Education Level Diversity (ED) 1.034***(5.32) 0.891***(3.94) Employees (SS) 0.000***(5.10) 0.001***(6.10) R&D expenditure (RD) 0.007***(5.68) 0.012***(3.18) Cont. (Cons) 2.956***(43.31) 9.190***(94.55) R2 0.2620 0.2700 Samples 3255 3255
Note: *** 1% significant, **5% significant, *10% significant.
Fig. 4 Facilitating travel between two cities (here by high-speed rail) is effective at spreading specialized commercial capacity (e.g., IT firms or financial firms) from one city to the other[27]. In both cases, mixing communities with different expertise and practice resulted in creation of successful companies that leveraged the skills of different communities.
flow via the social bridges is about as important as the effect of population density. If we compare the explanatory strength of interaction diversity with other variables, such as average age or percentage of residents who received a tertiary education, we find that these traditional measures are substantially weaker than social bridge diversity at explaining economic growth[28]. This
means that models and systems that depend only on measurements of population, education, and financial investment may be missing the main effects.
This research shows that it is more accurate to think about society in terms of interaction groups and ideas flow between these groups rather than only in terms of the demographics of individuals. The structure of social bridges is typically more powerful at predicting economic outcomes than demographic properties because social bridges are a major conduit by which people influence one another and by which they discover new innovations and opportunities. By understanding these social bridges, we can begin to build better investment systems and create a more innovative society. For instance, to promote growth in a specific neighborhood, we can alter transportation networks to make the neighborhood more accessible and invest in diverse stores and amenities in order to attract diverse flows of people. Importantly, we can use these findings reported in Ref. [28] to evaluate the expected impact of these investments on the economy of the target neighborhood.
Fig. 5 Social bridges diversity (i.e., diversity of physical interactions between neighborhoods) (left) and year-on-year economic growth for neighborhoods within the city of Beijing (right). The diversity of social bridges predicts up to 50% of the variance in year-on-year economic growth for Beijing as well as US and EU cites[28].
4 Optimizing Opportunity
The above observations suggest that social structure that optimizes the search for new ideas and opportunities is a major factor in economic development. Assuming that exploration for new opportunities and ideas is central for development, then we should ask how humans trade off the cost of exploration for new opportunities versus investment in familiar opportunities. To answer this question, the author will turn to the simpler case of how people make this trade off in financial investing, because this simpler case provides a clear and well-developed model of how people manage the trade-off between exploiting known opportunities and exploring for new ones.
To understand how people seek out and take advantage of new opportunities, it is useful to look at Bayesian decision methods, specifically the class of algorithms known as Thompson sampling. The core idea associated with these decision methods is that when decision makers are faced with a wide range of alternative actions, each with unknown payoff, they must select actions to discover those that lead to the best payoffs and at the same time exploit the actions that are currently believed to be the best in order to remain competitive against opponents. These algorithms therefore optimize decisions about new opportunities by minimizing investment regret while at the same time maximizing financial return when the potential for profit from each action is unknown or uncertain. Thompson sampling
serves as an “ideal” model that we can compare against real human decision making. This is the same idea as animals foraging for food, or people searching for new opportunities while still making a living.
In a social setting, the payoff for each potential action can often be easily and cheaply determined by observing the payoffs of other members of a decision maker’s social network. This is called distributed Thompson sampling. This use of social learning dramatically improves overall performance and reduces the cognitive load placed on the human participants. The ability to observe the outcomes of diverse types of actions across the decision maker’s social network is key to the power of distributed Thompson sampling to produce near-optimal decisions.
As an example, we recently examined how traders maximize their returns by sharing strategic information within a social-network stock-trading site where people can see the strategies that other people choose, discuss them, and copy them. We analyzed some 5.8 million transactions by day traders on a “social trading” platform called eToro and found that the groups of traders who fared the best approximated the distributed Thompson sampling strategy.
As shown in Fig. 6, we found that traders used recent performance in making decisions as would be expected of a rational agent, although they exhibited the well-known loss aversion bias. However, traders also modulated decisions based on other people’s
Fig. 6 Social trading: (a) Financial traders use recent performance in making decisions, but (b) this is modulated by using popularity signals as a prior probability that the trade is good, a strategy called distributed Thompson sampling. Using this strategy can produce much better return on investment as compared to individual trading[29].
performance signals by using popularity of a trade as a prior probability. In a stable trading system, the popularity of a trader (number of followers) would be expected to be a good estimate of the trader’s quality (average return on investment), and on the eToro system, popularity is in fact a good estimate of the prior probability that the trade will be profitable. The conclusion is that traders behave as would be expected if they were using the distributed Thompson sampling strategy[29]. And, as predicted by theory, using the
distributed Thompson sampling strategy results in much greater return on investment as compared to the strategies used by individuals trading alone.
5 Trustworthy, Clean Data
Today’s data ecology is transforming due to the exponential growth of mobile and ubiquitous computing, together with the spread of big data analysis. Increased media coverage of cybersecurity breaches
and intelligence scandals are having a dramatic impact on people’s concerns about personal data sharing and security. The surge of mobile transactions, micropayments, and connected sensors in both private and public spaces is expected to further exacerbate this tension. We need a “new deal on data” where security concerns are matched with transparency, control, and privacy, and are designed into the core of any data-driven service[30, 31].
Key to realizing trusted next generation data architectures is creating systems that seriously address the challenges of privacy, data ownership, data securitization, and cybersecurity. To address these issues, we have developed the Open Algorithms (OPAL) architecture as well as high-security machine learning methods which were built on OPAL[32].
The concept of OPAL is that instead of copying or sharing data, algorithms are sent to existing databases, executed behind existing firewalls, and only the encrypted results are shared. This minimizes opportunities to attack databases or divert data for unapproved use.
The OPAL paradigm seeks to address the increasing need for individuals and organizations to share data in a secure, privacy-preserving manner. Today there are a number of severe challenges within the digital information sharing ecosystem.
✏ Data is siloed: This makes data unavailable to support good decision making.
✏ Privacy is inadequately addressed: European regulations and other forces are beginning to address this problem, but it is still far from solved.
✏ Security is failing: The current “firewall” architecture is fundamentally inadequate, as the almost daily reports of hacking events and lost customer data demonstrate.
The OPAL principles for secure, privacy-preserving sharing of insights are simple and relatively easy to implement. Through the MIT Trust Data Consortium (see http://trust.mit.edu), we have created an alliance of countries and multinational and multilateral organizations that support the OPAL paradigm as the foundation of a sustainable digital ecology. Several of our Trust Data Consortium sponsors, in fact, have worked with us to field national-scale “safe data” systems built on OPAL.
Beyond the OPAL framework, it is now possible to perform machine learning and Artificial Intelligence (AI)
directly on encrypted data, without ever decrypting or otherwise exposing the data[32]. Because the technology
works only with encrypted data, no data is ever shared, and machine learning occurs without revealing the queries to others so that the system can discover value in other people’s encrypted data assets without endangering commercial secrets, tripping regulatory restrictions, or violating privacy. The ability to do machine learning and discover the value of data without ever exposing unencrypted data promises to produce much greater diversity in information sharing, thus enabling greater productivity and innovation, but without endangering individual privacy or compromising security[33].
6 Conclusion
This paper has argued that even rational “self-interested” agents derive great benefit from interaction diversity, and especially from social bridges between communities, and consequently, economic theory and policy should not be grounded on models that assume that humans are isolated, individual decision makers. To support this argument, this paper focused firstly on showing that actors with greater interaction diversity are predictably more wealthy, and that barriers to such interaction (such as segregation) are an important factor in the persistence of inequality. Secondly, it was argued that people display the same sort of foraging for novel resources behavior seen in most species, and that the balance of exploration for new opportunities versus exploitation of known ones is a critical determinant of economic outcomes. Finally, it was shown that social bridges across communities are especially predictive of economic outcomes, and that bridges between communities predict a very large fraction of economic growth.
These findings contrast with the typical understanding of economic and social outcomes as being due to the actions of individual decision makers. The foundations of modern Western society and rich societies everywhere, were laid in the 1700s in Scotland by Adam Smith, John Locke, and others. The understanding of ourselves that this early social science created is that humans are rational individuals and independent thinkers driven by self-interest. This viewpoint is built into every part of contemporary society — we use markets, we take direct democracy as our government ideal, and our schools focus on training students to have better analytics skills. As a consequence, the rational individual model has become the bedrock of financial systems and strategies.
But this rational individual model is much too simple, and it is not just the rational “self-interested” part that is questionable, but more importantly the part about humans acting as individuals who are independent of everyone else. Our behavior is strongly influenced by those around us and our ability to thrive is largely due to learning from other people’s experiences. We are not individuals but rather members of a social species, and the consequences for financial systems and investment strategies are immense, as I have tried to show in this paper.
The idea of “rational individuals” reached its current form when early mathematical economists in later 1800’s tried to make sense of Adam Smith’s observation that people “. . . are led by an invisible hand to . . . advance the interest of the society, and afford means to the multiplication of the species”. These mathematicians found that they could make the invisible hand work if they used a very simplified model of human nature: People act only to benefit themselves (they are “rational”), and they act alone, independent of others (they are “individuals”). While this is not be a bad approximation for stable market systems, complex natural situations it fails because it is peer-to-peer influence that enables cultural change, and it is this peer-to-peer interaction that may in fact be the main source of innovation and growth.
Moreover, the idea of “rational individuals” is not what Adam Smith said put forth the idea of the invisible hand. Instead, Adam Smith thought: “It is human nature to exchange not only goods but also ideas, assistance, and favors. . . it is these exchanges that guide men to create solutions for the good of the community.” Interestingly, Karl Marx said something similar, namely, society is the sum of all our social relationships.
The norms of society, the solutions for society, come from peer-to-peer communication — not just from markets and independent individual reasoning. Financial systems and investors should focus much more on interactions between individuals, and not just on the behavior of individuals. Until recently, we did not have data to examine these interactions, nor did we have the right sort of mathematics to model networks of peer-to-peer interaction. Now we have both the mathematics and the data to better understand and govern ourselves and can begin to understand ourselves more clearly, and invest more reliably.
References
[1] A. Mann, Core concept: Computational social science, Proc. Natl. Acad. Sci. USA, vol. 113, no. 3, pp. 468–470, 2016. [2] A. Pentland, The new science of building great teams,
Harvard Business Review, https://hbr.org/2012/04/the-new-science-of-building-great-teams, 2012.
[3] M. Buchanan, Behavioural science: Secret signals, Nature, vol. 457, no. 7229, pp. 528–530, 2009.
[4] Independent Expert Advisory Group on a Data Revolution for Sustainable Development, A world that counts: Mobilising the data revolution for sustainable development, https://www.undatarevolution.org/report/, 2014.
[5] C. Smith-Clarke, A. Mashhadi, and L. Capra, Poverty on the cheap: Estimating poverty maps using aggregated mobile communication networks, in Proc. SIGCHI Conf. Human Factors in Computing Systems, Toronto, Canada, 2014, pp. 511–520.
[6] V. Soto, V. Martinez, J. Virseda, and E. Frias-Martinez, Prediction of socioeconomic levels using cell phone records, in Proc. Int. Conf. User Modeling, Adaptation, and Personalization, Berlin, Germany, 2011, pp. 377–388.
[7] J. E. Steele, P. R. Sundsøy, C. Pezzulo, V. A. Alegana, T. J. Bird, J. Blumenstock, J. Bjelland, K. Engø-Monsen, Y. A. de Montjoye, A. M. Iqbal, et al., Mapping poverty using mobile phone and satellite data, Journal of the Royal Society Interface, vol. 14, no. 127, p. 20160690, 2017. [8] R. S. Burt, Structural Holes: The Social Structure of
Competition. Cambridge, MA, USA: Harvard University Press, 1992.
[9] A. Bogomolov, B. Lepri, J. Staiano, N. Oliver, F. Pianesi, and A. Pentland, Once upon a crime: Towards crime prediction from demographics and mobile data, in Proc. 16t hInt. Conf. Multimodal Interaction, Istanbul, Turkey, 2014, pp. 427–434.
[10] M. Traunmueller, G. Quattrone, and L. Capra, Mining mobile phone data to investigate urban crime theories at scale, in Proc. Int. Conf. Social Informatics, Barcelona, Spain, 2014, pp. 396–411.
[11] H. J. Wang, D. Kifer, C. Graif, and Z. H. Li, Crime rate inference with big data, in Proc. 22nd ACM SIGKDD Int. Conf. Knowledge Discovery and Data Mining, San Francisco, CA, USA, 2016, pp. 635–644.
[12] N. W. Ruktanonchai, D. Bhavnani, A. Sorichetta, L. Bengtsoon, K. H. Carter, R. C. C´ordoba, A. Le Menach, X. Lu, E. Wetter, E. zu Erbach-Schoenberg, et al., Census-derived migration data as a tool for informing malaria elimination policy, Malaria Journal, vol. 15, p. 273, 2016. [13] A. Wesolowski, N. Eagle, A. J. Tatem, D. L. Smith, A. M. Noor, R. W. Snow, and C. O. Buckee, Quantifying the impact of human mobility on malaria, Science, vol. 338, no. 6104, pp. 267–270, 2012.
[14] N. Jean, M. Burke, M. Xie, W. M. Davis, D. B. Lobell, and S. Ermon, Combining satellite imagery and machine learning to predict poverty, Science, vol. 353, no. 6301, pp. 790–794, 2016.
[15] X. Lu, L. Bengtsson, and P. Holme, Predictability of population displacement after the 2010 Haiti earthquake, Proc. Natl. Acad. Sci. USA, vol. 109, no. 29, pp. 11 576– 11 581, 2012.
[16] D. Pastor-Escuredo, A. Morales-Guzm´an, Y. Torres-Fern´andez, J. M. Bauer, A. Wadhwa, C. Castro-Correa, L. Romanoff, J. G. Lee, A. Rutherford, V. Frias-Martinez, et al., Flooding through the lens of mobile phone activity, presented at IEEE Global Humanitarian Technology Conf., San Jose, CA, USA, 2014, pp. 279–286.
[17] E. Jahani, G. Saint-Jacques, P. Sundsøy, J. Bjelland, E. Moro, and A. Pentland, Differential network effects on economic outcomes: A structural perspective, presented at Int. Conf. Social Informatics, Oxford, UK, 2017, pp. 41–50. [18] F. J. Buera and E. Oberfield, The global diffusion of ideas. National Bureau of Economic Research (NBER) Working Paper No. 21844, https://www.nber.org/papers/, 2016. [19] F. E. Alvarez, F. J. Buera, and R. E. Lucas Jr, Idea
flows, economic growth, and trade. National Bureau of Economic Research (NBER) Working Paper No. 19667, https://www.nber.org/papers/, 2013.
[20] C. Krumme, A. Llorente, M. Cebrian, A. Pentland, and E. Moro, The predictability of consumer visitation patterns, Scientific Reports, vol. 3, p. 1645, 2013.
[21] A. Madan, M. Cebrian, S. Moturu, K. Farrahi, and A. Pentland, Sensing the “health state” of a community, IEEE Pervasive Computing, vol. 11, no. 4, pp. 36–45, 2012. [22] V. K. Singh, B. Bozkaya, and A. Pentland, Money walks:
Implicit mobility behavior and financial well-being, PLoS One, vol. 10, no. 8, p. e0136628, 2015.
[23] W. Pan, G. Ghoshal, C. Krumme, M. Cebrian, and A. Pentland, Urban characteristics attributable to density-driven tie formation, Nature Communications, vol. 4, p. 1961, 2013.
[24] A. Pentland, Social Physics: How Social Networks Can Make Us Smarter. New York, NY, USA: Penguin Press, 2015.
[25] X. W. Dong, Y. Suhara, B. Bozkaya, V. K. Singh, B. Lepri, and A. Pentland, Social bridges in urban purchase behavior, ACM Transactions on Intelligent Systems and Technology, vol. 9, no. 3, p. 33, 2017.
[26] X. Yuan, Y. Qiu, Y. Wei, and S. Y. Liu, Research on the relationship between entrepreneurship diversity and performance of regional innovation networks—Micro data analysis based on 3255 Chinese incubators, Theory & Practice, no. 9, pp. 152–155, 2017.
[27] J. Gao, B. G. Jun, A. Pentland, T. Zhou, and C. A. Hidalgo, Collective learning in China’s regional economic development, arXiv preprint arXiv: 1703.01369, 2017. [28] S. K. Chong, M. Bahrami, H. Chen, S. Balcisoy, B.
Bozkaya, and A. Pentland, Economic outcomes predicted by diversity in cities, EPJ Data Science, vol. 9, p. 17, 2020.
[29] P. M. Krafft, J. Zheng, W. Pan, N. Della Penna, Y. Altshuler, E. Shmueli, J. B. Tenenbaum, and A. Pentland, Human collective intelligence as distributed Bayesian inference, arXiv preprint arXiv: 1608.01987, 2016.
[30] A. Pentland, Toward a new deal on data, World Economic Forum Global Information Technology Report, 2007–2008, http://trust.mit.edu, 2020.
[31] Mapping the risk-utility landscape: Mobile data for sustainable development & humanitarian action, http://
unglobalpulse.org, 2020.
[32] T. Hardjono, D. L. Shrier, and A. Pentland, Trusted Data. Cambridge, MA, USA: MIT Press, 2019.
[33] A. Pentland, A. Lipton, and T. Hardjono, Building the New Economy. Cambridge, MA, USA: MIT Press, 2020.
Alex Pentland is Professor at MIT; the advisor to UN and World Economic Forum; member of U.S. National Academies; and the former advisor of AT&T, Google, Luxembourg, Colombia, and EU. He is among the most-cited computational scientists in the world. Recent books include Trusted Data (MIT Press) and Social Physics (Penguin Press).
![Fig. 1 As individuals’ social networks become more structurally diverse, e.g., they interact with more diverse communities, their income increases [17]](https://thumb-eu.123doks.com/thumbv2/123doknet/14752131.580716/2.918.481.785.106.338/individuals-networks-structurally-diverse-interact-diverse-communities-increases.webp)
![Table 1 Social bridges, which are the pattern of physical interaction between neighborhoods, predict purchasing and financial decisions three times better than traditional demographics [25] .](https://thumb-eu.123doks.com/thumbv2/123doknet/14752131.580716/5.918.473.823.169.369/physical-interaction-neighborhoods-purchasing-financial-decisions-traditional-demographics.webp)
![Fig. 4 Facilitating travel between two cities (here by high- high-speed rail) is effective at spreading specialized commercial capacity (e.g., IT firms or financial firms) from one city to the other [27]](https://thumb-eu.123doks.com/thumbv2/123doknet/14752131.580716/6.918.498.790.100.372/facilitating-travel-effective-spreading-specialized-commercial-capacity-financial.webp)


