Differentiated human stem cells resemble fetal, not adult, # cells
The MIT Faculty has made this article openly available.
Please share
how this access benefits you. Your story matters.
Citation
Hrvatin, S., C. W. O’Donnell, F. Deng, J. R. Millman, F. W. Pagliuca,
P. DiIorio, A. Rezania, D. K. Gifford, and D. A. Melton. “Differentiated
Human Stem Cells Resemble Fetal, Not Adult, β Cells.” Proceedings
of the National Academy of Sciences 111, no. 8 (February 10, 2014):
3038–3043.
As Published
http://dx.doi.org/10.1073/pnas.1400709111
Publisher
National Academy of Sciences (U.S.)
Version
Final published version
Citable link
http://hdl.handle.net/1721.1/90323
Terms of Use
Article is made available in accordance with the publisher's
policy and may be subject to US copyright law. Please refer to the
publisher's site for terms of use.
Differentiated human stem cells resemble fetal, not
adult, β cells
Siniša Hrvatina, Charles W. O’Donnella,b, Francis Denga, Jeffrey R. Millmana, Felicia Walton Pagliucaa, Philip DiIorioc,
Alireza Rezaniad, David K. Giffordb, and Douglas A. Meltona,e,1
aDepartment of Stem Cell and Regenerative Biology, Harvard Stem Cell Institute andeHoward Hughes Medical Institute, Harvard University, Cambridge, MA
02138;bComputer Science and Artificial Intelligence Laboratory, Massachusetts Institute of Technology, Cambridge, MA 02139;cDiabetes Center of
Excellence, University of Massachusetts Medical School, Worcester, MA 01605; anddBetaLogics Venture, Janssen Research and Development, LLC, Raritan,
NJ 08869
Contributed by Douglas A. Melton, January 14, 2014 (sent for review September 14, 2013)
Human pluripotent stem cells (hPSCs) have the potential to generate any human cell type, and one widely recognized goal is
to make pancreaticβ cells. To this end, comparisons between
dif-ferentiated cell types produced in vitro and their in vivo counter-parts are essential to validate hPSC-derived cells. Genome-wide
transcriptional analysis of sorted insulin-expressing (INS+) cells
de-rived from three independent hPSC lines, human fetal pancreata,
and adult human islets points to two major conclusions: (i)
Differ-ent hPSC lines produce highly similar INS+cells and (ii)
hPSC-derived INS+(hPSC-INS+) cells more closely resemble human fetal
β cells than adult β cells. This study provides a direct comparison
of transcriptional programs between pure hPSC-INS+cells and true
β cells and provides a catalog of genes whose manipulation may
convert hPSC-INS+cells into functionalβ cells.
transcriptional profiling
|
differentiation|
beta cells|
MARISH
uman pluripotent stem cells (hPSCs), including embryonic stem cells (hESCs) and induced pluripotent stem cells (hiPSCs), are characterized by their capacity for unlimited self-renewal and the ability to differentiate into any human cell type (1–4). Stepwise differentiation protocols, designed to mimic se-quential developmental signals, attempt to generate specific cell types from hPSC lines for use in transplantation therapy and disease modeling (5–7).Significant variation in differentiation efficiencies has been observed between different hPSC lines, with some lines more readily differentiating into a particular cell type than others (8–11). The reasons for this variation have not been completely explained, but studies point to variation in genetic, epigenetic (12), and cell cycle patterns (13). Owing to these differences in differentiation propensity, directed differentiation protocols of-ten require laborious optimization for specific hPSC lines (14). The use of different protocols and different cell lines calls into question the degree to which the final differentiation products resemble each other. This has been difficult to address because, even with an optimized protocol and cell line, only a fraction of the hPSCs achieve the desired cell fate. Thus, direct comparison of cells, which are present in a mixed population, is not generally possible, except in those rare instances where appropriate re-porter lines have been constructed to facilitate cell sorting.
In addition to questions of variability, the extent to which any differentiated cell produced in vitro resembles its counterpart produced during normal human development remains unknown. Directed differentiation protocols for human cells are often generated using mouse embryonic development as a guide. Al-though there are many similarities, significant differences in transcriptional regulation exist between these two species (15, 16). Although it is obvious that documenting transcriptional changes that accompany human development would greatly benefit directed differentiation of human stem cells, the lack of suitable cell surface markers makes it very difficult to isolate and purify most human fetal and adult cell types for analysis.
Pancreaticβ cells are a cell type responsible for the regulation of serum glucose levels through secretion of the hormone insulin. Despite productive studies on new cell-surface markers for β cells, insulin expression remains the best specificβ-cell marker. Although adult β cells express only the hormone insulin, it is important to note that some fetalβ cells are polyhormonal and express other hormones, in addition to insulin, including gluca-gon and somatostatin (17–19). Unlike glucose-responsive adult β cells,β cells present during early fetal development do not re-spond to glucose with increased insulin secretion (20, 21).
Cell line variability and the lack of a clear understanding of human early (fetal) development have hampered efforts to gen-erate pancreatic β cells from hPSCs. Current directed differen-tiation protocols generate insulin-expressing (INS+) cells (hPSC-INS+) that lack expression of several keyβ-cell genes and fail to properly secrete insulin in response to glucose (14, 22–32). Additionally, careful analysis of select chromatin modifications that accompanyβ-cell development has shown that Polycomb-mediated differences in chromatin remodeling are deficient in in vitro differentiated cells (33). These observations led to the speculation that hPSC-INS+cells are more similar to fetalβ cells than to adult β cells (27). It is, however, equally possible that hPSC-INS+cells represent a different in vitro-derived cell type unlike fetal or adultβ cells. A thorough analysis as to whether hPSC-directed differentiation generates cell types found during normal human development has been long awaited.
Significance
Human pluripotent stem cells (hPSCs) can be produced from any person and have the potential to differentiate into any cell type in the body. This study focuses on the generation of insulin-expressing cells from hPSCs and compares their gene expression, as assayed by transcriptional gene products, to that
of insulin-expressingβ cells from human fetal and adult
sam-ples. We employ a new method to isolate and profile insulin-expressing cells and conclude that several different hPSC lines generate very similar insulin-expressing cells, cells whose transcripts resemble fetal rather than adultβ cells. This study advances the possibility of directing the differentiation of stem
cells into functional β cells by comparing and cataloging
dif-ferences between hPSC-derived insulin-expressing cells and
humanβ cells.
Author contributions: S.H., C.W.O., F.D., D.K.G., and D.A.M. designed research; S.H., C.W.O., F.D., J.R.M., and F.W.P. performed research; J.R.M., F.W.P., P.D., and A.R. contributed new reagents/analytic tools; S.H., C.W.O., F.D., D.K.G., and D.A.M. analyzed data; and S.H., C.W.O., and D.A.M. wrote the paper.
Conflict of interest statement: A.R. is an employee of Janssen Research and Develop-ment, LLC.
1To whom correspondence should be addressed. E-mail: [email protected]. This article contains supporting information online atwww.pnas.org/lookup/suppl/doi:10. 1073/pnas.1400709111/-/DCSupplemental.
Previous attempts to analyze genome-wide transcription in enriched populations of adultβ cells relied on FACS enrichment ofβ cells using either Newport Green dye (34) or a series of cell-surface markers (35). The extent to which the small proportion of non-β cells present in the sorted population affects tran-scriptional analysis, and the applicability of these sorting meth-ods to the isolation of human fetalβ cells, is unknown. Sorting of hPSC-INS+cells also has been a significant challenge. Although one hPSC insulin-GFP knock-in reporter line has been recently generated (28, 29), isolating INS+cells from multiple genetically unmodified hPSC lines is necessary to evaluate the gene ex-pression signature of hPSC-INS+cells. Finally, to our knowledge no one has yet purified and transcriptionally profiled human fetalβ cells.
Here we make use of our newly developed Method for Ana-lyzing RNA following Intracellular Sorting (MARIS) (36) to analyze the global gene expression profile of three types of sorted INS+cells: those differentiated from hPSC lines and hu-man fetal and huhu-man adult pancreata. We also analyze the de-gree of similarity between INS+ cells derived from different hESC and hiPSC lines. We then document transcriptional changes that occur during humanβ-cell development. Finally, we compare hPSC-INS+cells to human adult and fetalβ cells and identify differentially expressed genes between adult β cells and hPSC-INS+cells.
Results
Global Transcriptional Profile of INS+Cells from Several hESC and
iPSC Lines.We first sought to determine the degree to which
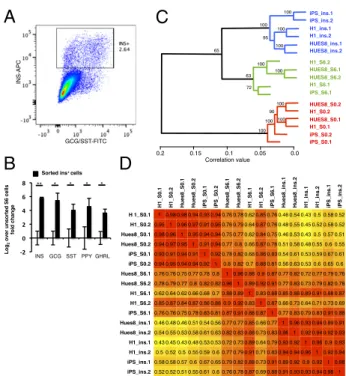
hPSC-derived INS+cells, produced from different cell lines, re-semble one another at the transcriptome level. We treated hESC lines H1 and HUES 8 and hiPSC line iPS-17b with a multiple-step differentiation protocol to stage 6, at which point a small percent-age of cells expressed insulin and other pancreatic hormones (Fig. S1). Given the small percentage of desired cell type that is typ-ically produced, very little information can be gained using tra-ditional transcriptional analyses of the whole population. Instead, stage-6 cells were fixed, stained for insulin, glucagon, and somato-statin, and sorted for RNA isolation and analysis using MARIS (Fig. 1A). INS+cells comprised only about 1% of all stage-6 cells. A
large proportion (40–70%) of INS+cells coexpressed glucagon and
somatostatin, consistent with previous reports (22, 27). Notably, the RNA isolated from hPSC-INS+cells by MARIS achieved RNA integrity numbers of 8.1± 0.9. Quantitative RT-PCR for insulin, glucagon, and somatostatin indicated significant enrichment of all three endocrine hormones in the sorted populations, con-firming successful purification of INS+cells (Fig. 1B).
The RNA isolated from hPSC-INS+cell populations was also analyzed using Illumina microarrays. RNA isolated from unfixed, undifferentiated pluripotent cells from each line and from un-sorted stage-6 populations were included as controls. Hierarchical clustering across all genes identified three distinct, statistically confirmed groups of samples (Fig. 1C). All INS+cells clustered
together, suggesting that there were fewer differences between INS+cells derived from different cell lines than differences be-tween unsorted stage-6 cells and sorted INS+cells within each cell line. Moreover, expression profiles between INS+cells derived from different hPSC lines were as highly correlated (r2= 0.93 ±
0.02) as those between hPSC lines at the pluripotent stage (r2=
0.94± 0.02) (Fig. 1D).
To further analyze hPSC-INS+cells we focused on 152 endo-crine lineage genes known for their role in pancreatic devel-opment, endocrine hormone secretion, and glucose metabolism (27, 28, 37) (Table S1). Hierarchical clustering and correlation values based on these endocrine lineage genes confirmed a high degree of similarity between hESC-derived and hiPSC-derived insulin+cells (Fig. S2A and B). Together, these data suggest that INS+cells derived from different hPSC lines are very similar.
Recently, Micallef et al. (29) reported the generation of an insulin-GFP knock-in hESC-reporter line. Basford et al. (28) performed microarray analysis with this cell line and described 28 genes that were differentially expressed between insulin-positive and insulin-negative cells. In our analysis, 27 of the 28 identified genes had the same direction of enrichment in each of the three hPSC lines (Fig. S2C) (28). These data further strengthen the conclusion that INS+cells derived from different hPSC lines display highly similar molecular signatures.
Humanβ-Cell Maturation.Study of human fetal development has
been hampered by the absence of cell-surface markers that allow for sorting of cell types produced in vivo, as well as the scarcity of human fetal material for study. Researchers have thus relied on studies in model organisms, primarily the mouse, as the basis for understanding human development and optimizing directed differentiation. Recently, our laboratory identified differential gene expression patterns that distinguish fetalβ cells from adult β cells in the mouse (38). To uncover markers for human β-cell maturation, we performed a purification and transcriptome-wide molecular characterization of human fetal and adultβ cells.
Human pancreata at 15–16 wk gestational age were used, be-causeβ cells at this stage are immature and glucose-nonresponsive
A
B
C
INS-APC GCG/SST-FITC Log 2over unsorted S6 cells
fold change
Sorted ins+ cells
D
iPS_ins.1 iPS_ins.2 H1_ins.1 H1_ins.2 HUES8_ins.1 HUES8_ins.2 100 100 100 100 95 65 63 100 100 72 100 100 100 100 90 H1_S6.2 HUES8_S6.1 HUES8_S6.2 H1_S6.1 iPS_S6.1 HUES8_S0.2 H1_S0.2 HUES8_S0.1 H1_S0.1 iPS_S0.2 iPS_S0.1 0.2 0.15 0.1 0.05 0.0 Correlation value
H1_S0.1 H1_S0.2 Hues8_S0.1 Hues8_S0.2 iPS_S0.1 iPS_S0.2 Hues8_S6.1 Hues8_S6.2 H1_S6.1 H1_S6.2 iPS_S6.1 Hues8_ins.1 Hues8_ins.2 H1_ins.1 H1_ins.2 iPS_ins.1 iPS_ins.2
H 1_S0.1 1 0.98 0.98 0.94 0.93 0.94 0.76 0.78 0.62 0.85 0.76 0.46 0.54 0.43 0.5 0.58 0.52 H1_S0.2 0.95 1 0.96 0.97 0.91 0.95 0.76 0.79 0.64 0.87 0.76 0.48 0.55 0.45 0.52 0.58 0.52 Hues8_S0.1 0.98 0.96 1 0.95 0.94 0.94 0.75 0.77 0.62 0.84 0.75 0.46 0.53 0.43 0.5 0.57 0.51 Hues8_S0.2 0.94 0.97 0.95 1 0.91 0.94 0.77 0.8 0.66 0.87 0.78 0.51 0.58 0.48 0.55 0.6 0.55 iPS_S0.1 0.93 0.91 0.94 0.91 1 0.92 0.78 0.82 0.68 0.86 0.83 0.54 0.61 0.53 0.59 0.67 0.61 iPS_S0.2 0.94 0.95 0.94 0.94 0.92 1 0.8 0.82 0.7 0.88 0.81 0.56 0.63 0.53 0.6 0.65 0.6 Hues8_S6.1 0.76 0.76 0.75 0.77 0.78 0.8 1 0.96 0.88 0.9 0.87 0.77 0.82 0.72 0.77 0.79 0.76 Hues8_S6.2 0.78 0.79 0.77 0.8 0.82 0.82 0.96 1 0.89 0.92 0.91 0.77 0.83 0.73 0.79 0.82 0.78 H1_S6.1 0.62 0.64 0.62 0.66 0.68 0.7 0.88 0.89 1 0.83 0.88 0.85 0.88 0.89 0.91 0.88 0.87 H1_S6.2 0.85 0.87 0.84 0.87 0.86 0.88 0.9 0.92 0.83 1 0.87 0.66 0.73 0.64 0.71 0.73 0.69 iPS_S6.1 0.76 0.76 0.75 0.78 0.83 0.81 0.87 0.91 0.88 0.87 1 0.77 0.83 0.79 0.83 0.91 0.88 Hues8_ins.1 0.46 0.48 0.46 0.51 0.54 0.56 0.77 0.77 0.85 0.66 0.77 1 0.96 0.93 0.94 0.89 0.91 Hues8_ins.2 0.54 0.55 0.53 0.58 0.61 0.63 0.82 0.83 0.88 0.73 0.83 0.96 1 0.92 0.94 0.92 0.93 H1_ins.1 0.43 0.45 0.43 0.48 0.53 0.53 0.72 0.73 0.89 0.64 0.79 0.93 0.92 1 0.96 0.9 0.93 H1_ins.2 0.5 0.52 0.5 0.55 0.59 0.6 0.77 0.79 0.91 0.71 0.83 0.94 0.94 0.96 1 0.92 0.94 iPS_ins.1 0.58 0.58 0.57 0.6 0.67 0.65 0.79 0.82 0.88 0.73 0.91 0.89 0.92 0.9 0.92 1 0.98 iPS_ins.2 0.52 0.52 0.51 0.55 0.61 0.6 0.76 0.78 0.87 0.69 0.88 0.91 0.93 0.93 0.94 0.98 1 ** * * * *
Fig. 1. RNA profiling of sorted hPSC-derived insulin-expressing cells. (A) FACS plot of stage-6 H1-derived cells sorted for insulin-APC. (B) Quantitative RT-PCR of unsorted and insulin-sorted stage-6 hPSC-derived cells for pan-creatic hormone genes INS (insulin), GCG (glucagon), SST (somatostatin), PPY (pancreatic polypeptide), and GHRL (ghrelin) suggests significant enrichment of mRNA specific for pancreatic hormones in the insulin-APC sorted pop-ulation (*P< 0.05, **P < 0.01). (C) Three human pluripotent stem cell lines, HUES8, H1, and iPS-17b, were differentiated to stage 6 and sorted for INS+ cells. RNA was isolated from undifferentiated cells, stage-6 cells, and sorted INS+cells for all three cell lines. Global gene expression for each sample was analyzed using the Illumina microarray platform. Hierarchical clustering identified three major groups of samples. Lengths in the dendrogram rep-resent correlation value. Approximately unbiased (AU) P values are dis-played. INS+ cells from different cell lines form a statistically significant cluster. (D) r2values based on microarray data across all genes are shown.
The average r2value between stage-0 cells, 0.94, is similar to the average r2
value between sorted INS+ cells, 0.93. ins, insulin+ MARIS-sorted stage-6 differentiated, pluripotent stem cells; S0, unsorted, undifferentiated pluripo-tent stem cells; S6, unsorted stage-6 differentiated pluripopluripo-tent stem cells.
Hrvatin et al. PNAS | February 25, 2014 | vol. 111 | no. 8 | 3039
DEVELOPM
ENTAL
BIOLO
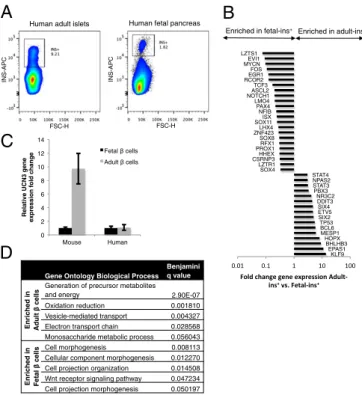
(20, 21). Adult human cadaveric islets and fetal pancreata were dispersed, stained for insulin, and FACS-sorted. RNA was iso-lated and analyzed by Illumina microarrays (Fig. 2A).
The analysis shows that human β-cell maturation, between gestational week 16 and adulthood, is characterized by gene expression changes in 643 genes, of which 39 were transcription factors (P < 0.05, fold change >3) (Fig. 2B). Urocortin 3 (UCN3), which we identified previously as a marker of mouse β-cell maturation, was expressed only 1.1x-fold higher in sorted human adultβ cells over fetal β cells, indicating that UCN3 ex-pression does not significantly change between human week-16 and adult β cells (Fig. 2C). The differentially expressed genes presented in this study could be used as genetic markers of hu-man β-cell maturation. Down-regulation or up-regulation of several genes such as NFIB, prospero homeobox 1 (PROX1), HHEX, and KLF9 has been implicated in the maturation of other cellular lineages, suggesting that these may be transcription factors involved in the pan-tissue transitions from fetal to adult transcriptional programs (39–42).
Gene Ontology analysis of all differentially expressed genes (P < 0.05) suggests that several metabolic and secretory biological processes are significantly enriched in adultβ cells over fetal β cells (Fig. 2D). These processes include vesicle-mediated trans-port and oxidation-reduction consistent with the idea that fetal β cells may not metabolize glucose or package insulin for se-cretion the same way adultβ cells can (43).
These data represent a transcriptome-wide molecular charac-terization of human fetal and adultβ cells and point to significant differences between mouse and humanβ-cell maturation. Further analysis of β cells at multiple time points during human and mouse development will further elucidate this species divergence.
hPSC-Derived INS+Cells Resemble Human Fetalβ Cells More Than
Human Adultβ Cells.Directed differentiation from hPSCs attempts
to recreate human development in vitro. The extent to which this has been achieved remains unknown, because direct comparisons with human fetal cells have been difficult because of the scarcity of material and the inability to assess pure populations ofβ cells.
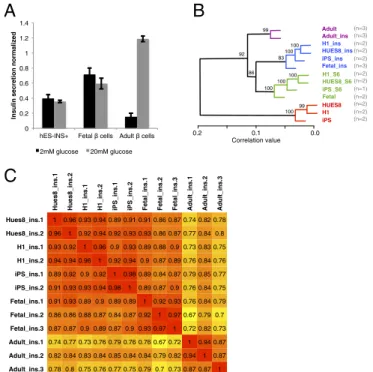
We first tested dispersed hPSC-INS+cells and fetal and adultβ cells for glucose-stimulated insulin secretion (GSIS). In contrast to adultβ cells, both hPSC-INS+cells and human fetalβ cells have elevated basal glucose secretion and do not display a robust GSIS response (Fig. 3A). To transcriptionally compare hPSC-INS+cells
and human fetal and adult β cells, we performed whole-genome expression analysis. Unsorted stage-6 cells and undifferentiated pluripotent stem cells were included as control groups. Hierar-chical clustering across all genes identified four distinct groups of samples (Fig. 3B). hPSC-INS+ cells clustered more closely
with humanβ cells than with undifferentiated hPSCs. Notably, fetal β cells clustered with hPSC-derived INS+ cells and not human adultβ cells. The correlation between three biological replicates of adultβ cells (r2= 0.89 ± 0.04) was not significantly
different from the correlation between fetalβ cells and hPSC-INS+cells (r2= 0.88 ± 0.02) (P = 0.49), indicating a high degree
of similarity between the latter two cell types (Fig. 3C). Hier-archical clustering and correlation values based on 152 endo-crine lineage genes confirmed this result (Fig. S3). Together, these data show that INS+cells derived from different hPSC lines are similar to fetalβ cells and not adult β cells.
Transcriptional Differences Between hES-Derived INS+ Cells and
Human Adultβ Cells. Given that the goal of hPSC-directed
dif-ferentiation is to generate functional human β cells, we com-pared transcript expression by microarray and RNA-seq between hPSC-INS+cells and adult humanβ cells. We first focused our analysis on 152 endocrine lineage genes and observed that 26 of these genes were significantly different between adultβ cells and hPSC-INS+cells (greater than threefold by microarray analysis, P < 0.05). RNA-seq analysis of two samples of human adult INS+
cells and two samples of HUES8-INS+ cells confirmed 24/26 genes as differentially expressed greater than threefold (Fig. 4A). For example, pancreatic and duodenal homeobox 1 (PDX1), v-maf avian musculoaponeurotic fibrosarcoma oncogene homolog A (MAFA), and NK6 homeobox 1 (NKX6-1) are markers of adult humanβ cells (17) and in vivo-matured hPSC-INS+cells (22, 26). Using immunofluorescent staining, we confirmed the lack of expression of NKX6-1 and relatively heterogeneous ex-pression of PDX1 and MAFA in hPSC-INS+cells (Fig. 4B).
We next focused on two categories of genes: those involved in endocrine subtype specification and those that might be relevant to GSIS. Factors involved in both endocrine specification [PDX1, NKX6-1, motor neuron and pancreas homeobox 1 (MNX1), forkhead box A1 (FOXA1), aristaless related homeobox (ARX), paired box 4 (PAX4), and iroquois homeobox 2 (IRX2)] and GSIS [MAFA; PAX4; GHRL; chromogranin B (CHGB); DPP4; potassium channel, subfamily K, member 1 (KCNK1); and potassium channel, subfamily K, member 3 (KCNK3)] were misexpressed in hPSC-INS+ cells compared with adult β cells (Fig. 4A). PDX1, NKX6-1, and MNX1 are necessary for the determination of β-cell fate and have over threefold lower expression in hPSC-INS+than in human adultβ cells (44–46). Conversely FOXA1, ARX, and IRX2, determinants ofα cell fate, were misexpressed 4- to 40-fold higher in hPSC-INS+ cells than adult β cells (47–49). MAFA, whose over-expression is sufficient to induce mature GSIS in immature P2 rat β cells (50), had significantly lower expression in hPSC-INS+cells
compared with adult β cells. Conversely PAX4, whose pro-longed expression was shown to blunt GSIS in mouse adultβ cells (51), had significantly higher expression in hPSC-INS+ cells than in adultβ cells. Several other genes may be responsible
A
B
0 2 4 6 8 10 12 14 Mouse HumanRelative UCN3 gene
expression fold change
Fetal cells Adult cells
C
Gene Ontology Biological Process Benjamini q value
Enriched in Adult
cells
Generation of precursor metabolites and energy 2.90E-07 Oxidation reduction 0.001810 Vesicle-mediated transport 0.004327 Electron transport chain 0.028568 Monosaccharide metabolic process 0.056043
Enriched in Fetal
cells
Cell morphogenesis 0.008113 Cellular component morphogenesis 0.012270 Cell projection organization 0.014508 Wnt receptor signaling pathway 0.047234 Cell projection morphogenesis 0.050197 Human fetal pancreas Human adult islets
D
Enriched in fetal-ins+Enriched in adult-ins+
KLF9 EPAS1 BHLHB3 HOPX MESP1 BCL6 TP53 SIX2 ETV5 SIX4 DDIT3 NR3C2 PBX3 STAT3 NPAS2 STAT4 SOX4 LZTR1 CSRNP3 HHEX PROX1RFX1 SOX8 ZNF423LHX4 SOX11 ISX NFIB PAX4 LMO4 NOTCH1ASCL2 TCF3 RCOR2EGR1 FOS MYCNEVI1 LZTS1 INS-APC FSC-H INS-APC FSC-H
Fig. 2. Humanβ-cell maturation. (A) FACS plots of human adult islets and human fetal pancreata sorted for INS+ cells (APC+). (B) Differentially expressed transcription factors between adult and fetalβ cells. (C) Relative expression of UCN3 in mouse and human fetal and adultβ cells. Expression normalized to fetal levels in each species. (D) Top five most significant (Benjamini q value) Gene Ontology biological processes relatively enriched in either adult or fetalβ cells.
for the lack of functional GSIS in hPSC-INS+cells: The presence of ghrelin suppresses GSIS (52), CHRB knock-out animals have reduced GSIS and elevated basal insulin secretion (53), PROX1 is associated with insulin secretion abnormalities (54), and lack of tandem pore domain potassium channels KCNK1 and KCNK3 may elevate resting membrane potential and cause hy-peractivity and higher basal insulin secretion. Interestingly, with the exception of PAX4, no significant differences were observed in expression of endocrine subtype specification genes between fetal and adultβ cells, whereas significant differences were appar-ent in the expression of the GSIS-relevant genes PAX4, CHGB, KCNK1, and KCNK3 (Fig. 4C).
This analysis suggests two challenges to producing functional humanβ cells from hPSC-INS+cells: (i) β-cell lineage commit-ment and (ii) functional maturation. Our observations support the hypothesis that hPSC-INS+cells resemble human fetal cells that are not fully committed to theβ-cell lineage, as judged by transcription factor expression. The modulation of both endo-crine lineage and GSIS genes may be critical for converting hPSC-INS+cells into a phenotype that more closely resembles adult humanβ cells.
We expanded the comparison between hPSC-INS+and adult β cells to the whole genome. Gene Ontology analysis of all
differentially expressed genes (P < 0.05 by microarray) identified 22 statistically enriched (q< 0.05) biological processes in hPSC-INS+cells (Table S2). Among the 10 most differentially expressed processes, three involve cholesterol/sterol biosynthesis or me-tabolism, indicating that hPSC-INS+ cells aberrantly express nonpancreatic, liver-specific genetic pathways (Fig. 4D).
A total of 755 genes were differentially expressed (P < 0.05, greater than threefold) by microarray analysis between hPSC-INS+and adultβ cells; 583 genes were confirmed by RNA-seq (greater than threefold). We present a list of all differentially ex-pressed transcription factors because they are of particular interest for their roles in modulating cell fates (Fig. 4E). Genes identified here are candidate markers that may distinguish hPSC-INS+cells from adultβ cells, or targets to direct the conversion of hPSC-INS+cells into functionalβ cells.
H1_S6 HUES8_S6 iPS_S6 Fetal H1_ins HUES8_ins iPS_ins Fetal_ins Adult Adult_ins HUES8 H1 iPS (n=3) (n=3) (n=2) (n=2) (n=2) (n=3) (n=2) (n=2) (n=1) (n=2) (n=2) (n=2) (n=2) 0.2 0.1 0.0 Correlation value 86 92 100 99 83 100 100 100 99 100 100 0 0.2 0.4 0.6 0.8 1 1.2 1.4
hES-INS+ Fetal cells Adult cells
Insulin secretion normalized
2mM glucose 20mM glucose
A
B
C
Hues8_ins.1 Hues8_ins.2 H1_ins.1 H1_ins.2 iPS_ins.1 iPS_ins.2 Fetal_ins.1 Fetal_ins.2 Fetal_ins.3 Adult_ins.1 Adult_ins.2 Adult_ins.3
Hues8_ins.1 1 0.96 0.93 0.94 0.89 0.91 0.91 0.86 0.87 0.74 0.82 0.78 Hues8_ins.2 0.96 1 0.92 0.94 0.92 0.93 0.93 0.86 0.87 0.77 0.84 0.8 H1_ins.1 0.93 0.92 1 0.96 0.9 0.93 0.89 0.88 0.9 0.73 0.83 0.75 H1_ins.2 0.94 0.94 0.96 1 0.92 0.94 0.9 0.87 0.89 0.76 0.84 0.76 iPS_ins.1 0.89 0.92 0.9 0.92 1 0.98 0.89 0.84 0.87 0.79 0.85 0.77 iPS_ins.2 0.91 0.93 0.93 0.94 0.98 1 0.89 0.87 0.9 0.76 0.84 0.75 Fetal_ins.1 0.91 0.93 0.89 0.9 0.89 0.89 1 0.92 0.93 0.76 0.84 0.79 Fetal_ins.2 0.86 0.86 0.88 0.87 0.84 0.87 0.92 1 0.97 0.67 0.79 0.7 Fetal_ins.3 0.87 0.87 0.9 0.89 0.87 0.9 0.93 0.97 1 0.72 0.82 0.73 Adult_ins.1 0.74 0.77 0.73 0.76 0.79 0.76 0.76 0.67 0.72 1 0.94 0.87 Adult_ins.2 0.82 0.84 0.83 0.84 0.85 0.84 0.84 0.79 0.82 0.94 1 0.87 Adult_ins.3 0.78 0.8 0.75 0.76 0.77 0.75 0.79 0.7 0.73 0.87 0.87 1
Fig. 3. hPSC-derived insulin-expressing cells resemble human fetalβ cells. (A) Glucose stimulated insulin secretion of dispersed cells. In contrast to adultβ cells, fetalβ cells and hPSC-INS+cells both seem functionally immature, as
indicated by increased basal glucose secretion and lack of glucose stimula-tion. (B) Hierarchical clustering based on microarray global gene expression across all genes indicated that hPSC-INS+cells cluster closely with human fetal and not adultβ cells. Numbers in parentheses indicate biological repli-cates. Lengths in the dendrogram represent correlation distances. (C) r2values
based on microarray data across all genes are shown. Each row and column represents one sample. r2values between biological replicates of adultβ-cell
samples (Adult_ins) are on average 0.89± 0.04. r2values between sorted
hPSC-derived insulin+stage-6 cells and sorted fetalβ cells are 0.88 ± 0.02. The bi-ological variation between adultβ cells is not statistically smaller than the variation between fetalβ cells and hPSC-INS+stage-6 cells (P= 0.49). This
indicates a high degree of similarity between hPSC-INS+cells and human fetal β cells. HUES8_ins, H1_ins, and iPS_ins are hPSC-derived MARIS-sorted stage-6 INS+cells; Fetal_ins are MARIS-sorted INS+cells from week-16 human fetal pancreata; Adult_ins are MARIS-sorted INS+cells from islet preparations of adult human pancreata.
A
B
Secretory Transcription factors
Glucose processing,
insulin secretion Membrane channels Other
CHGA ALX3 ISL1 ONECUT1 ACOX2 RIMS4 ABCC8 KCNJ11 CDH1
CHGB* ARX LHX6 ONECUT2 ACSS1 SLC2A14 CACNA1AKCNJ2 CDH2 GAST CMIP LMX1A ONECUT3 ACSS3 SLC30A8CACNA1BKCNJ4 COL1A1
GCG EN1 LMX1B PAX2 ALDOA SNAP25 CACNA1CKCNJ6 CTNNB1
GHRL* ESR1 MAF PAX4* ATP5G3 STX1A CACNA1EKCNK1*FFAR1 GIP FOXA1 MAFA PAX6 ATP6V0E1 STXBP1 HCN1 KCNK12 RAP1A
IAPP* FOXA2 MAFB PBX1 COX4I1 SYP HCN2 KCNK17 CDH1
INS FOXA3 MLXIPL PDX1 GPI SYT4 HCN3 KCNK3* CDH2
NTS FOXO1 MNX1 POU3F4 NNT SYT7 HCN4 KCNMA1 DLL3
PPY GATA4 MYT1 POU5F1 PCSK1 SYT8 KCNA3 KCNMB2 DPP4
PYY GATA6 NANOG PROX1 PCSK2 VAMP2 KCNA5 KCNN1 FGF4
SCT GLIS3NEUROD1 RFX2 PDIA6 VAMP3 KCNA6 KCNN3 GCGR
SST HES1 NEUROG3 RFX3 PDK3 G6PC2* KCNB1 SCN1A MMP2
HNF1A NKX2-2 RFX6 PGAP1 GCK KCNC2 SCN2A RAP1A
HNF1B NKX6-1 SNAI1 PRKCSH SLC2A1 KCNC4 SCN3A UCN3 HNF4A NKX6-2 SNAI2 RIMS1 SLC2A2 KCNG4 SCN4A WNT2
INSM1 NKX6-3 SOX4 RIMS2 SLC2A3 KCNH2 SCN7A WNT3
IRX2 NOTCH1 SOX9 RIMS3 KCNH6 WNT4
C
Gene Ontology Biological Process Benjamini q value Enriched in hES-INS + cells Cytoskeleton organization 0.001411 Sterol biosynthetic process 0.001489 Cholesterol biosynthetic process 0.001819 Cell morphogenesis 0.001849 Cellular component
morphogenesis 0.004568
0.015036 Actin cytoskeleton organization 0.016766 Sterol metabolic process 0.017404 Cell projection organization 0.017966 Neuron projection development 0.018540
E
INS / PDX1 INS / NKX6-1 INS / MAF A KLF9 CEBPD PEG3 NFIX RORC HOPX NKX6-1 MAFA TSHZ3 HSF4 EPAS1 GLIS3 MNX1 NR3C2 PDX1 PURA NFIA XBP1 ZNF217 ISX PBX2 HNF4GELF4 CEBPA RCOR2EGR1 ARX GATA4TCF3 LZTS1 TGIF2HES6 AEBP1 LMO4 ONECUT2PAX4 SOX11IRX2 FEV NR2F1HHEX FOXA1 0.01 0.1 1 10 100Fold change gene expression Adult-ins+ vs. hES-ins+
D
Enriched in hES-ins+ Enriched in adult-ins+
Fig. 4. Differential expression between humanβ cells and hPSC-derived insulin-expressing cells. (A) The list of 152 pancreatic lineage genes is colored for genes that are differentially overexpressed in adultβ cells (red) or hPSC-INS+ cells (blue). Differential gene expression was calculated based on microarray data between human adultβ cells and hPSC-INS+cells (greater
than threefold change, P< 0.05) and confirmed by RNA-seq between HUES8-INS+cells and adultβ cells (greater than threefold change). Asterisk indicates genes that are also differentially expressed between fetal and adultβ cells. (B) Immunofluorescence. hPSC-INS+ cells with PDX1, NKX6-1, and MAFA. (Scale bars, 100μm.) (C) Relative gene expression of selected differentially expressed genes normalized to expression in hES-INS+cells. ARX, FOXA1, IRX2, MNX1, NKX6-1, and PDF are expressed at similar levels between fetal and adultβ cells but differentially expressed in hES-INS+cells. PAX4, CHGB,
KCNK1, and KCNK3 are expressed at similar levels between hES-INS+cells and fetalβ cells but differentially expressed in adult β cells. (D) Top 10 most significant (Benjamini q value) gene ontology biological processes enriched hPSC-INS+cells over adultβ cells. (E) A list of 42 transcription factors that were differentially expressed based on microarray data between human adultβ cells and hPSC-derived INS+cells (greater than threefold change, P<
0.05) and confirmed by RNA-seq between HUES8-INS+cells and adultβ cells (greater than threefold change).
Hrvatin et al. PNAS | February 25, 2014 | vol. 111 | no. 8 | 3041
DEVELOPM
ENTAL
BIOLO
Discussion
Here we compare the transcriptome of hPSC-derived pancreatic cells produced in vitro to human fetal and adultβ cells, as well as test for the variation that may result from using different stem cell lines. These transcriptional analyses were made possible by antibody staining (for insulin) followed by cell sorting so that relatively pure populations of cells could be compared.
One conclusion from these results is that there is a high degree of similarity between INS+ cells derived from three different pluripotent stem cell lines. The degree of correlation between INS+cells, derived after more than 20 d of directed differenti-ation, resembles the degree of correlation between different undifferentiated pluripotent stem cells. Furthermore, correlation between INS+cells was similar to the degree of correlation be-tween humanβ-cell samples obtained from two different donors. The high degree of similarity we observe between pancreatic cells derived from different hPSC lines presents an important proof-of-principle observation for hPSC-directed differentiation. Data from the analysis of the insulin-GFP knock-in hESC-reporter line points to a potentially high degree of similarity between our hPSC-INS+ cells and those produced by other laboratories, using different cell lines and variations of differ-entiation protocols (28). Characterization of sorted hPSC-INS+ cells from additional cell lines and differentiation protocols is necessary to confirm this observation.
In the absence of tools to study human development, model organisms have informed our understanding of human de-velopment and biology, although the degree to which human development resembles the development of other organisms has not been rigorously investigated. Using MARIS, we have com-pared the transcriptional profile of human fetal and adultβ cells. This analysis allows for a second conclusion, namely, a list of genes that are differentially expressed during human β-cell maturation. These genetic signatures can be used as markers for generating functional human β cells. Moreover, the results in-dicate that gene expression changes during humanβ-cell matu-ration may not resemble changes in mouseβ-cell gene expression during the late prenatal and early postnatal period. A possible explanation is that we are comparing two different stages of β-cell maturation. For example, the gene expression of week-16 humanβ cells could resemble the gene expression of early em-bryonic mouse β cells and not late prenatal mouse β cells. Al-ternatively, our data may be a result of intrinsic developmental differences between mouse and human. Further study of multi-ple stages during human and mouse development using RNA-seq in addition to microarrays is necessary to determine the degree of similarity between mouse and human β-cell matura-tion. However, despite gene expression analysis, it is not possible to carry out human in vivo lineage tracing studies, and therefore the lineage relationship between human fetalβ cells and adult β cells remains unknown.
Whether hPSC-directed differentiation protocols produce cells with gene expression patterns that that are immature or fetal, instead of adult, is a question of interest (27). These assessments are generally made based on the expression of a handful of fetal-specific genes (such as the expression of other hormones in ad-dition to insulin), or the absence of a number of adult markers (such as MAFA). Because of the limited number of genes ana-lyzed in these earlier studies, the degree to which cells derived in vitro actually resemble true human fetal cells remained un-known. Our genome-wide expression comparison of hPSC-INS+ cells, from three different pluripotent stem cell lines, with human fetal and adultβ cells points to differentiated hPSC-INS+cells being most like fetal cells. Although there are many differences in gene expression between hPSC-INS+cells, human fetalβ cells and human adult β cells (suggesting that no two cell types are fully equivalent), this analysis showed close clustering of
hPSC-INS+cells with human fetalβ cells and not human adult β cells. hPSC-INS+cells and fetalβ cells were no more different
from each other than the biological replicates of human adult β cells. This result was confirmed by correlation analysis based on 152 pancreatic lineage genes.
Our work does not address the heterogeneity of INS+cells or the possibility that there is a smaller subset of hPSC-INS+cells and fetalβ cells that closely resemble adult β cells. Further study of hPSC-INS+ cells and fetal INS+ cells sorted into smaller subsets based on expression of other markers (such as known hormones or adultβ-cell transcription factors) would be needed to address these questions.
A thorough transcriptional analysis of in vivo-matured hPSC-INS+cells suggests that they are more similar to adult islets than to unsorted in vitro-derived hPSCs that were differentiated into INS+cells (33). Determining the degree of similarity between sorted in vivo-matured hPSC-INS+ cells and fetal and adultβ cells would be of great interest to better understand the state of in vivo-derived hPSC-INS+cells. Additionally, it would be in-teresting to analyze using MARIS recently described glucose-responsive hPSC-derived insulin-expressing cells (55) to deter-mine their relationship to adultβ cells.
The data reported here point to at least three classes of genes that are differentially expressed between INS+ cells produced from stem cells in vitro and bona fide adult humanβ cells. The first class of genes regulates the lineage commitment of hPSC-INS+cells toward β cells and away from other pancreatic en-docrine cell types. The second class of genes, which are similarly expressed in human fetalβ cells and hPSC-INS+cells, and dif-ferentially expressed in adult β cells, may be responsible for functionalβ-cell maturation to achieve normal glucose response. The third class, which is uniquely expressed in hPSC-INS+cells, are sterol biosynthesis/metabolism genes typically expressed in liver instead of pancreatic cells and may represent inappropriate gene expression arising from the differentiation protocols. The challenge for the field can be defined as finding ways to manipulate the expression of these multiple genes so that one can reproducibly prepare large numbers of fully functional humanβ cells.
Experimental Procedures
MARIS Staining and FACS. hPSC-derived cells and human islets were dispersed to a single-cell suspension using TrypLE Express (Invitrogen). Human fetal pancreata were mechanically dispersed in the presence of 1 mg/mL Dispase (Roche) and 1 mM Collagenase P (Roche). All cells were passed through a 40-μm filter and washed with PBS at least twice. Cells were fixed and stained according to the MARIS. The list of primary and secondary antibodies used is provided in
Table S3. Cells were sorted on the FACSAria (BD Biosciences) using FACSDiva software. Gates were set with reference to negative controls. The sorting speed was adjusted to ensure sorting efficiency above 90%. Cells were col-lected in tubes that were coated with a small amount of Sort buffer.
Global Gene Expression Analysis (Microarray). Using the Illumina TotalPrep RNA Amplification kit (Ambion), double-stranded cDNA was generated following reverse transcription from 100 ng of total RNA. In vitro transcription overnight with biotin-labeled nucleotides created amplified mRNA (cRNA), which was concentrated by vacuum centrifugation at 30 °C; 750 ng cRNA per sample was then hybridized to Human HT-12 Expression BeadChips (Illumina) using the Whole- Genome Expression Direct Hybridization kit (Illumina). Finally, chips were scanned on the Illumina Beadstation 500. The chip annotation manifest was version 4, revision 1. For differential expression analysis and the genera-tion of gene lists for funcgenera-tional annotagenera-tion and pathway analysis, microarray data were processed in GenomeStudio (V2011.1; Illumina). Raw data were adjusted by background subtraction and rank-invariant normalization. Before calculating fold change, an offset of 20 was added to all probe set means to eliminate negative signals. The P values for differences between mean signals were calculated in GenomeStudio by t test and corrected for multiple hypotheses testing by the Benjamini–Hochberg method in combi-nation with the Illumina custom false discovery rate model.
Global Gene Expression Analysis (RNA-seq). Isolated RNA was obtained from two biological replicates of HUES8-derived INS+cells and human adultβ cells, as well as one replicate of live and processed stage-6 cells. Samples were poly-A–purified and converted to cDNA libraries using the Illumina TruSeq protocol and prepared into Illumina libraries using the Beckman Coulter Genomics SPRIworks system using custom adapters; 6-nt 3′ barcodes were added during PCR enrichment and the resulting frag-ments were evaluated using Agilent BioAnalyzer 2100. Samples were multiplexed two-per-lane for sequencing using the Illumina HiSEq 2000 platform with paired-end read lengths of 80 nt, resulting in 68 million to 112 million paired reads per sample, and an average biological fragment length of 168–179 nt. Reads were aligned to the human genome (GRCh37/hg19) using STAR (version 2.2.0c) guided by GENCODE gene annotations (version 14) (56). RNA-seq FPKM (fragments per kilobase of
exon per million fragments) gene enrichment was determined using maximum likelihood by Cuffdiff (57, 58) (version 2.0.2) and visualized using CummeRbund (57). Transcript differential expression was calculated by Cuffdiff using the default negative binomial model, with significant hits also confirmed using the count-based technique DESEq (59).
ACKNOWLEDGMENTS. The authors thank Dena Cohen for helpful discus-sion and Eliza Scadden and Priya Makhijani for technical help. S.H. is a Biological and Biomedical Sciences Ph.D. student supported by the Sternlicht Director’s Fund Fellowship. J.R.M. was supported by a Harvard Stem Cell Institute (HSCI) Training Grant. D.A.M. is an investigator of the Howard Hughes Medical Institute (HHMI). This project was supported in part by the Helmsley Charitable Trust, the Harvard Stem Cell Institute, and the National Institutes of Health Grants 2U01DK07247307, RL1DK081184, and 1U01HL10040804.
1. Takahashi K, et al. (2007) Induction of pluripotent stem cells from adult human fi-broblasts by defined factors. Cell 131(5):861–872.
2. Thomson JA, et al. (1998) Embryonic stem cell lines derived from human blastocysts. Science 282(5391):1145–1147.
3. Yu J, et al. (2007) Induced pluripotent stem cell lines derived from human somatic cells. Science 318(5858):1917–1920.
4. Park I-H, et al. (2008) Reprogramming of human somatic cells to pluripotency with defined factors. Nature 451(7175):141–146.
5. Colman A, Dreesen O (2009) Pluripotent stem cells and disease modeling. Cell Stem Cell 5(3):244–247.
6. Daley GQ (2010) Stem cells: Roadmap to the clinic. J Clin Invest 120(1):8–10. 7. Rubin LL (2008) Stem cells and drug discovery: The beginning of a new era? Cell
132(4):549–552.
8. Chin MH, et al. (2009) Induced pluripotent stem cells and embryonic stem cells are distinguished by gene expression signatures. Cell Stem Cell 5(1):111–123. 9. Doi A, et al. (2009) Differential methylation of tissue- and cancer-specific CpG island
shores distinguishes human induced pluripotent stem cells, embryonic stem cells and fibroblasts. Nat Genet 41(12):1350–1353.
10. Hu B-Y, et al. (2010) Neural differentiation of human induced pluripotent stem cells follows developmental principles but with variable potency. Proc Natl Acad Sci USA 107(9):4335–4340.
11. Osafune K, et al. (2008) Marked differences in differentiation propensity among human embryonic stem cell lines. Nat Biotechnol 26(3):313–315.
12. Bock C, et al. (2011) Reference Maps of human ES and iPS cell variation enable high-throughput characterization of pluripotent cell lines. Cell 144(3):439–452.
13. Chetty S, et al. (2013) A simple tool to improve pluripotent stem cell differentiation. Nat Methods 10(6):553–556.
14. Nostro MC, et al. (2011) Stage-specific signaling through TGFβ family members and WNT regulates patterning and pancreatic specification of human pluripotent stem cells. Development 138(5):861–871.
15. Ginis I, et al. (2004) Differences between human and mouse embryonic stem cells. Dev Biol 269(2):360–380.
16. Odom DT, et al. (2007) Tissue-specific transcriptional regulation has diverged signif-icantly between human and mouse. Nat Genet 39(6):730–732.
17. Riedel MJ, et al. (2012) Immunohistochemical characterisation of cells co-producing insulin and glucagon in the developing human pancreas. Diabetologia 55(2):372–381. 18. Polak M, Bouchareb-Banaei L, Scharfmann R, Czernichow P (2000) Early pattern of
differentiation in the human pancreas. Diabetes 49(2):225–232.
19. De Krijger RR, et al. (1992) The midgestational human fetal pancreas contains cells coex-pressing islet hormones. Dev Biol 153(2):368–375.
20. Hayek A, Beattie GM (1997) Experimental transplantation of human fetal and adult pancreatic islets. J Clin Endocrinol Metab 82(8):2471–2475.
21. Beattie GM, Butler C, Hayek A (1994) Morphology and function of cultured human fetal pancreatic cells transplanted into athymic mice: A longitudinal study. Cell Transplant 3(5):421–425.
22. Rezania A, et al. (2012) Maturation of human embryonic stem cell-derived pancreatic progenitors into functional islets capable of treating pre-existing diabetes in mice. Diabetes 61(8):2016–2029.
23. Maehr R, et al. (2009) Generation of pluripotent stem cells from patients with type 1 diabetes. Proc Natl Acad Sci USA 106(37):15768–15773.
24. Chen S, et al. (2009) A small molecule that directs differentiation of human ESCs into the pancreatic lineage. Nat Chem Biol 5(4):258–265.
25. Kelly OG, et al. (2011) Cell-surface markers for the isolation of pancreatic cell types derived from human embryonic stem cells. Nat Biotechnol 29(8):750–756. 26. Kroon E, et al. (2008) Pancreatic endoderm derived from human embryonic stem cells
generates glucose-responsive insulin-secreting cells in vivo. Nat Biotechnol 26(4):443–452. 27. D’Amour KA, et al. (2006) Production of pancreatic hormone-expressing endocrine
cells from human embryonic stem cells. Nat Biotechnol 24(11):1392–1401. 28. Basford CL, et al. (2012) The functional and molecular characterisation of human
em-bryonic stem cell-derived insulin-positive cells compared with adult pancreatic beta cells. Diabetologia 55(2):358–371.
29. Micallef SJ, et al. (2012) INS(GFP/w) human embryonic stem cells facilitate isolation of in vitro derived insulin-producing cells. Diabetologia 55(3):694–706.
30. Jiang J, et al. (2007) Generation of insulin-producing islet-like clusters from human embryonic stem cells. Stem Cells 25(8):1940–1953.
31. Tateishi K, et al. (2008) Generation of insulin-secreting islet-like clusters from human skin fibroblasts. J Biol Chem 283(46):31601–31607.
32. Zhang D, et al. (2009) Highly efficient differentiation of human ES cells and iPS cells into mature pancreatic insulin-producing cells. Cell Res 19(4):429–438.
33. Xie R, et al. (2013) Dynamic chromatin remodeling mediated by polycomb proteins orchestrates pancreatic differentiation of human embryonic stem cells. Cell Stem Cell 12(2):224–237.
34. Morán I, et al. (2012) Humanβ cell transcriptome analysis uncovers lncRNAs that are tissue-specific, dynamically regulated, and abnormally expressed in type 2 diabetes. Cell Metab 16(4):435–448.
35. Dorrell C, et al. (2011) Transcriptomes of the major human pancreatic cell types. Di-abetologia 54(11):2832–2844.
36. Hrvatin S, Deng F, O’Donnell CW, Gifford DK, Melton DA (2014) MARIS: Method for analyzing RNA following intracellular sorting. PLoS ONE, 10.1371/journal.pone.0089459. 37. Bonal C, Herrera PL (2008) Genes controlling pancreas ontogeny. Int J Dev Biol 52(7):
823–835.
38. Blum B, et al. (2012) Functional beta-cell maturation is marked by an increased glu-cose threshold and by expression of urocortin 3. Nat Biotechnol 30(3):261–264. 39. Bonett RM, Hu F, Bagamasbad P, Denver RJ (2009) Stressor and
glucocorticoid-dependent induction of the immediate early gene kruppel-like factor 9: Implications for neural development and plasticity. Endocrinology 150(4):1757–1765.
40. Lavado A, Lagutin OV, Chow LM, Baker SJ, Oliver G (2010) Prox1 is required for granule cell maturation and intermediate progenitor maintenance during brain neurogenesis. PLoS Biol 8(8):e1000460.
41. Paz H, Lynch MR, Bogue CW, Gasson JC (2010) The homeobox gene Hhex regulates the earliest stages of definitive hematopoiesis. Blood 116(8):1254–1262.
42. Steele-Perkins G, et al. (2005) The transcription factor gene Nfib is essential for both lung maturation and brain development. Mol Cell Biol 25(2):685–698.
43. Weinhaus AJ, et al. (2003) Insulin secretagogues, but not glucose, stimulate an increase in [Ca2+]i in the fetal human and porcine beta-cell. J Clin Endocrinol Metab 88(6):2753–2759. 44. Dalgin G, et al. (2011) Zebrafish mnx1 controls cell fate choice in the developing
endocrine pancreas. Development 138(21):4597–4608.
45. Sander M, et al. (2000) Homeobox gene Nkx6.1 lies downstream of Nkx2.2 in the major pathway of beta-cell formation in the pancreas. Development 127(24):5533–5540. 46. Yang Y-P, Thorel F, Boyer DF, Herrera PL, Wright CV (2011) Context-specificα- to-β-cell
reprogramming by forced Pdx1 expression. Genes Dev 25(16):1680–1685. 47. Collombat P, et al. (2003) Opposing actions of Arx and Pax4 in endocrine pancreas
development. Genes Dev 17(20):2591–2603.
48. Petri A, et al. (2006) The effect of neurogenin3 deficiency on pancreatic gene ex-pression in embryonic mice. J Mol Endocrinol 37(2):301–316.
49. Shih DQ, Navas MA, Kuwajima S, Duncan SA, Stoffel M (1999) Impaired glucose ho-meostasis and neonatal mortality in hepatocyte nuclear factor 3alpha-deficient mice. Proc Natl Acad Sci USA 96(18):10152–10157.
50. Aguayo-Mazzucato C, et al. (2011) Mafa expression enhances glucose-responsive in-sulin secretion in neonatal rat beta cells. Diabetologia 54(3):583–593.
51. Brun T, et al. (2004) The diabetes-linked transcription factor PAX4 promotes beta-cell proliferation and survival in rat and human islets. J Cell Biol 167(6):1123–1135. 52. Gelling RW, et al. (2003) Lower blood glucose, hyperglucagonemia, and pancreatic
alpha cell hyperplasia in glucagon receptor knockout mice. Proc Natl Acad Sci USA 100(3):1438–1443.
53. Obermüller S, et al. (2010) Defective secretion of islet hormones in chromogranin-B deficient mice. PLoS ONE 5(1):e8936.
54. Ingelsson E, et al.; MAGIC investigators (2010) Detailed physiologic characterization reveals diverse mechanisms for novel genetic Loci regulating glucose and insulin metabolism in humans. Diabetes 59(5):1266–1275.
55. Cheng X, et al. (2012) Self-renewing endodermal progenitor lines generated from human pluripotent stem cells. Cell Stem Cell 10(4):371–384.
56. Harrow J, et al. (2012) GENCODE: The reference human genome annotation for The ENCODE Project. Genome Res 22(9):1760–1774.
57. Trapnell C, et al. (2012) Differential gene and transcript expression analysis of RNA-seq experiments with TopHat and Cufflinks. Nat Protoc 7(3):562–578.
58. Trapnell C, et al. (2010) Transcript assembly and quantification by RNA-Seq reveals un-annotated transcripts and isoform switching during cell differentiation. Nat Biotechnol 28(5):511–515.
59. Anders S, Huber W (2010) Differential expression analysis for sequence count data. Genome Biol 11(10):R106.
Hrvatin et al. PNAS | February 25, 2014 | vol. 111 | no. 8 | 3043
DEVELOPM
ENTAL
BIOLO