HAL Id: insu-01214269
https://hal-insu.archives-ouvertes.fr/insu-01214269
Submitted on 11 Oct 2015
HAL is a multi-disciplinary open access
archive for the deposit and dissemination of
sci-entific research documents, whether they are
pub-lished or not. The documents may come from
teaching and research institutions in France or
abroad, or from public or private research centers.
L’archive ouverte pluridisciplinaire HAL, est
destinée au dépôt et à la diffusion de documents
scientifiques de niveau recherche, publiés ou non,
émanant des établissements d’enseignement et de
recherche français ou étrangers, des laboratoires
publics ou privés.
and Sahel rainfall: The role of Saharan heat low–forced
winds
Weijie Wang, Amato T. Evan, Cyrille Flamant, Christophe Lavaysse
To cite this version:
Weijie Wang, Amato T. Evan, Cyrille Flamant, Christophe Lavaysse. On the decadal scale
correla-tion between African dust and Sahel rainfall: The role of Saharan heat low–forced winds. Science
Advances , American Association for the Advancement of Science (AAAS), 2015, 1 (9), pp.e1500646.
�10.1126/sciadv.1500646�. �insu-01214269�
C L I M A T O L O G Y 2015 © The Authors, some rights reserved; exclusive licensee American Association for the Advancement of Science. Distributed under a Creative Commons Attribution NonCommercial License 4.0 (CC BY-NC). 10.1126/sciadv.1500646
On the decadal scale correlation between African
dust and Sahel rainfall: The role of Saharan heat
low
–forced winds
Weijie Wang,1 Amato T. Evan,1* Cyrille Flamant,2Christophe Lavaysse3
A large body of work has shown that year-to-year variations in North African dust emission are inversely pro-portional to previous-year monsoon rainfall in the Sahel, implying that African dust emission is highly sensitive to vegetation changes in this narrow transitional zone. However, such a theory is not supported by field ob-servations or modeling studies, as both suggest that interannual variability in dust is due to changes in wind speeds over the major emitting regions, which lie to the north of the Sahelian vegetated zone. We reconcile this contradiction showing that interannual variability in Sahelian rainfall and surface wind speeds over the Sahara are the result of changes in lower tropospheric air temperatures over the Saharan heat low (SHL). As the SHL warms, an anomalous tropospheric circulation develops that reduces wind speeds over the Sahara and dis-places the monsoonal rainfall northward, thus simultaneously increasing Sahelian rainfall and reducing dust emission from the major dust“hotspots” in the Sahara. Our results shed light on why climate models are, to date, unable to reproduce observed historical variability in dust emission and transport from this region. INTRODUCTION
By mass, aeolian dust is the most pervasive aerosol in the atmosphere (1). The presence of suspended dust affects the local energy balance through direct (2) and indirect effects (3), modifies the hydrological cycle via radiative forcing (4) and modification of cloud microphysical properties (5), and is a vehicle for the long-range transport of nutri-ents to global oceans (6) and terrestrial land surfaces (7). However, despite the importance of dust to the Earth system, coupled climate models are not able to reproduce historical variability in dust emission and transport (8), and thus, there is little confidence in projections of how atmospheric dust concentrations will change in the future. Hence, there is a need to understand the controls on historical changes in dust using observational data.
North Africa is the world’s largest dust source, accounting for more than 55% of global dust emissions (9, 10), and nearly 60% of the dust transported off the continent is deposited in the Atlantic Ocean (1). Long-term in situ observations at Barbados (11) and coral reef proxy and satellite data (12, 13) have shown that dust emission from North Africa peaked during the mid-1980s and has followed a downward trend through at least the late 2000s. Studies have found that dust cover over the Atlantic is anticorrelated with previous-year Sahelian precipitation (11), and a causal relationship between the de-cline in dust emission and the increase in Sahelian rainfall is plausible because increasing soil moisture would strengthen soil cohesion forces (14), and more dense vegetation cover would increase surface rough-ness (15), both acting to limit erosion and the mobilization of particles from the surface into the atmosphere. However, there are several as-pects of such a theory that are not consistent. For example, satellite imagery suggests that most dust-emitting regions lie to the north of the vegetated region of the Sahel (10, 16), and in situ observations have shown that a more northward propagation of the monsoon, which
results in greater Sahelian rainfall, should increase the occurrence of dust emission from sources in the Sahel via haboobs (17). Addition-ally, a recent study demonstrated that the downward trend in dust that started in the mid-1980s could be reproduced in an aerosol emission and transport model when forced only by historical wind fields from reanalysis and when holding the Sahelian vegetation density constant (18).
Therefore, on the one hand, it would appear as though changes in surface winds over the hyperarid Sahara Desert should be sufficient to describe year-to-year changes in summertime dust emission, yet on the other hand, there is clear evidence showing that dust transported across the Atlantic is inversely proportional to rainfall, as well as veg-etation density, in the Sahel. Here, we reconcile this contradiction by showing that both Saharan surface wind fields over the major regional dust-emitting regions and the northward propagation of the monsoon flow, and thus Sahel rainfall, are forced by the thermodynamic state of a meteorological feature termed the Saharan heat low (SHL).
RESULTS
Dust and precipitation
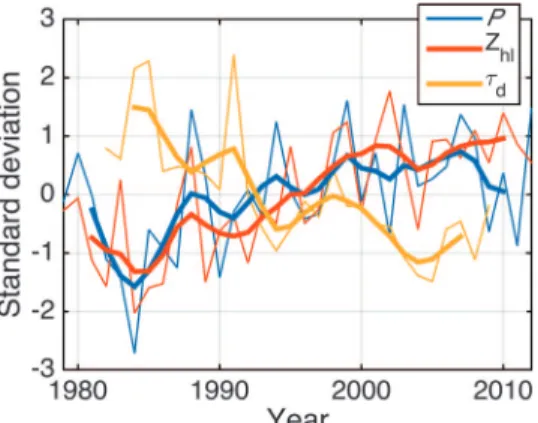
The Sahelian region of North Africa is an arid to semiarid region lying between the Sahara and the more tropical regions near the Guinea coast that is characterized by average summertime precip-itation rates from 2 to 6 mm day−1. Numerous studies have suggested that Atlantic dust cover is sensitive to rainfall in the Sahel, given the negative correlations between dust and monsoon season precipitation (11, 17). Indeed, the time series of summertime, June to August, the season when dust production peaks (19), with tropical North Atlantic dust aerosol optical depth (td) estimated from satellites (12), shows that tdhas been decreasing since the mid-1980s, whereas Sahelian rainfall, from the Global Precipitation Climatology Project (20), has been increasing over the same time period (Fig. 1). The time series of monsoon season Sahelian rainfall and satellite-retrievedtd, over the period 1982–2010, are statistically significantly correlated at an r value 1
Scripps Institution of Oceanography, University of California, San Diego, La Jolla, CA 92093, USA.2Sorbonne Universités, UPMC (Université Pierre et Marie Curie) Université
Paris 6, CNRS & UVSQ, UMR 8190 LATMOS, 75252 Paris, France.3European Commission,
Joint Research Centre, Ispra, Varese 21027, Italy. *Corresponding author. E-mail: [email protected]
on October 11, 2015
http://advances.sciencemag.org/
of−0.53 (P = 0.014). Using dust concentration measurements from Barbados (11) and the same rainfall data, but over the period 1965– 2009, the correlation between dust and precipitation is−0.52.
The basis for the theory that Sahelian rainfall affects dust emis-sion is that although the correlation between concurrent-year rain-fall and dust is statistically significant and negative, the magnitude of the correlation between previous-year rainfall and dust is larger in magnitude (11) (−0.68 using satellite data and −0.66 using the
Barbados data). However, on the basis of the results from a Fisher’s z test to determine the significance of the difference in correlation coefficients, we cannot rule out the null hypothesis that the lagged correlations are statistically indistinguishable from the nonlagged correlations. That is, the fact that the correlation magnitude peaks when Sahelian rainfall leads dust by 1 year may simply be a statis-tical artifact.
The Saharan heat low
We next examine the concurrent roles of the SHL in dust emission and rainfall in the summer. The SHL is a region of a local surface and lower tropospheric temperature maximum and surface pressure minimum that is present in the western Sahara Desert during the summer (June to August) months, and is characterized by a broad low-level cyclonic circulation and mid-level anticyclonic circulation, about the SHL center (21) (Fig. 2A). The magnitude and extent of these two circulation features can be described by the atmospheric thickness between the 700- and 925-hPa levels, averaged spatially over the SHL center (Zhl), using geopotential height from ERA-Interim re-analysis (22). Larger values of Zhl indicate a strengthening of the characteristic SHL circulation features (21). The SHL center is detected in a manner identical to the Lagrangian SHL tracking method de-scribed in (21). The temperature and thickness of the SHL change on time scales ranging from synoptic (23) to interannual (24), and over the last three decades,Zhlhas increased (Fig. 1), a trend that is corroborated by in situ observations (24).
As the SHL warms andZhlincreases, there is an intensification of the low-level cyclonic circulation that has its center of action about the SHL (23), and this strengthened low-level circulation increases
Fig. 1. Seasonal (June to August) time series ofZhl(blue),
precipita-tion (P, green), and td(red). The monthly mean precipitation series is
averaged over 5°W to 20°E, 10° to 20°N, andtdis averaged over 10° to
65° W and 0° to 30°N. The thin lines are the seasonal means, and the thick lines are the five-season smoothed time series (via a 1-4-7-4-1 filter).
Fig. 2. Climatology and regressed precipitation and winds. (A) Shown is a map of long-term mean dust emission (shading), seasonal mean precipitation (magenta contour lines, mm day−1), and seasonal mean 925-hPa climatological wind vectors (June to August). Dust emission rates are in nondimensional units of % of total annual mean of North Africa dust emission rates. The red circle indicates the location of the mean seasonal (June to August) position of the SHL. The brown boxes are the major dust hotspots of the Bodélé depression (14° to 24°E, 14° to 21°N), the depression in the lee of the Aïr and Adrar Mountains (2° to 10°E, 16° to 24°N), and the Mauritania and Western Sahara source region (12° to 2°W, 18° to 27°N, dashed lines). (B) Map of the coefficients of the regression of 925-hPa meridional and zonal winds (vectors and shading) and precipitation onto Zhl, for June to August and 1979 through 2012. Vectors are all
unit length to indicate anomalous wind direction, and the shaded regions are the wind speed coefficients, where only coefficients statistically significant at the 90% level are shown.
on October 11, 2015
http://advances.sciencemag.org/
Sahelian rainfall during the monsoon season via a northward dis-placement of the monsoon flow (24). Covariability of Zhland precip-itation is evidenced by a statistically significant correlation of their seasonal time series (r = 0.54, P = 0.01) (Fig. 1). This covariability is also seen in Fig. 2B, which shows coefficients of the regression of monthly precipitation anomalies onto monthly meanZhlanomalies, for the summer months (June to August) and from 1979 through 2012. Here, given an anomalously warm SHL, there is an increase in Sahelian precipitation and a reduction in rainfall along the Gulf of Guinea (Fig. 2B), indicating an anomalously northward position of the monsoon rain band, which is consistent with other studies (24). The dependency of the Sahelian rainfall on the intensity of the SHL is also evident in the regression of 925-hPa winds onto Zhl, also for the months of the monsoon season, which show an anomalous low-level southwesterly flow between the Gulf of Guinea and the Sahel (Fig. 2B) that intensifies the climatological southerly monsoon flow (Fig. 2A) and thus increases the northward transport of moisture to the Sahel (24).
Simultaneous with the increase in Sahel rainfall that is associated with an anomalously warm SHL, there is also a reduction in wind speeds over the three most important dust-emitting regions of the Sahara: the Bodélé depression, a depression in the lee of the Aïr and Adrar Mountains, and western Mauritania and the Western Sa-hara (10, 16, 24, 25) (Fig. 2A). We note that although the dust
emis-sion map from (25) does not show high (relative) emission rates over Mauritania and the Western Sahara, another independent estimate of North African dust emission (10) suggests that this region has the highest emission rates for the entire region.
For all three major dust source regions, the climatological low-level winds are northerly to northeasterly (Fig. 2A), but the anomalous wind fields associated with an increase inZhlare southwesterly (Fig. 2B), a result of the anomalous cyclonic rotation about the SHL center of action. Consequently, as Zhl increases and the SHL circulation strengthens, there is a net reduction in the scalar 925-mbar wind speeds over these important source regions, as evidenced by the sta-tistically significant coefficients of the regression of wind speed onto Zhl(shading, Fig. 2B). Thus, the regressions of monsoon rainfall and winds ontoZhl(Fig 2B) demonstrate that changes in the low-level cir-culation associated with the SHL can simultaneously increase Sahelian rainfall and reduce North African dust emission, via the well-established relationship between surface wind speeds and emission [for example, (14)].
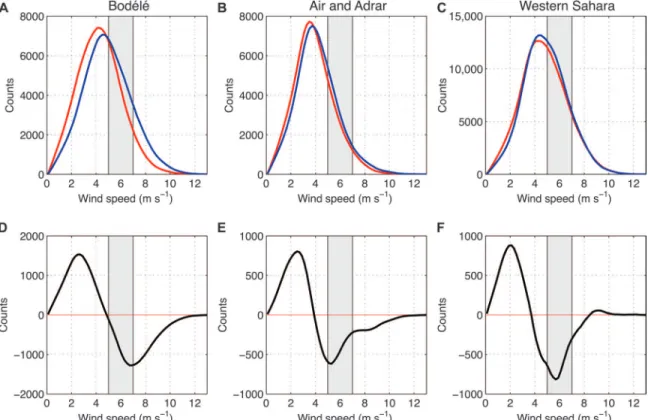
Surface wind speeds during strong and weak SHL phases To more clearly link the dynamics of the SHL to dust emission over the three major source regions (Fig. 3A), we created histograms of re-analysis (22) of six hourly 10-m wind speed for the 300 largest and 300 smallest daily values ofZhl(Fig. 3, A to C). The surface wind speed
Fig. 3. Wind speed histograms. (A to C) Histogram counts (per 0.2 m s−1) of 10-m wind speed from ERA-Interim reanalysis for the 300 strongest (red) and weakest (blue) phases of the SHL in the Bodélé Depression (A), a depression in the lee of the Aïr and Adrar Mountains (B), and the Mauritania and Western Sahara (C) in the summertime from 1979 through 2012. The mean values of the wind speed for the strong and weak SHL are statistically significantly different in (A), (B), and (C) based on the t score from a two-tailed t test. (D to F) Wind speed histogram differences for the warm minus cool SHL cases. The gray-shaded region represents wind speed threshold for dust emission. A qualitatively identical shift in the wind speed distribution is also observed during the month of May (not shown).
on October 11, 2015
http://advances.sciencemag.org/
threshold for dust emission to occur in the Sahara is about 5 to 7 m s−1 (15, 26, 27), and thus only changes in the wind speed distribution within and above this threshold range have an effect on dust emission. The climatological 10-m wind speed histograms for the Bodélé (Fig. 3A), Aïr and Adrar Mountains lee region (Fig. 3B), and Mauritania and Western Sahara (Fig. 3C) source regions all peak at speeds below the threshold for emission. Hence, besides changes in the mean wind speed, changes in tails of the distribution are important for under-standing the winds’ influence on dust emission.
In all three cases, the difference between the two wind speed his-tograms (large minus smallZhl) demonstrates that there is a shift in the wind speed distributions over the source regions toward lower wind speeds for largerZhl(Fig. 3, D to F). Quantitatively, there is a 22.5% (Bodélé), 6.5% (Aïr and Adrar), and 4.1% (Mauritania and Western Sahara) increase in the frequency of occurrence of wind speeds below the 5 m s−1threshold when comparing large and small Zhl. We find a qualitatively identical shift in the wind speed distri-bution during the month of May. This reduction in dust emission with an anomalously warm SHL and strong SHL circulation is re-flected in the time series oftdandZhl(Fig. 1), which are statistically significantly correlated (r = −0.73, P < 0.01).
DISCUSSION
Our results suggest that the long-noted negative correlation between dust and rainfall is by association and that both features are simul-taneously responding to large-scale forcing by the SHL. Such an in-terpretation of the data is consistent with previous work regarding the influence of the SHL on the physical characteristics of the West African monsoon (21, 23, 24), and with the Ridley et al. model (18) and observational studies (10, 16, 25) of North African dust sources. We cannot exclude the possibility that dust emission in Sahel is caus-ally correlated to rainfall via changes in vegetation cover and soil moisture [for example, (15)]; rather we suggest that such effects are to first-order negligible when compared to the coincident changes in dust emission over the vastly larger Sahara.
Finally, when forced with observed sea surface temperatures, cli-mate models are unable to reproduce the observed year-to-year vari-ability of dust over the North Atlantic (8). In light of this work, it is plausible that an underlying cause of this deficiency is an inaccurate representation of the location of the major dust-emitting regions (8). Additionally, initial work (4) suggests that climate models may not sufficiently represent the SHL and its influence on the regional cli-mate, which we have shown is requisite to represent the dust cycle in this part of the world, although more work is needed to compre-hensively evaluate the representation of the SHL in climate models.
MATERIALS AND METHODS Data
Monthly meantd, retrieved from satellite radiance measurements from the Advanced Very High Resolution Radiometer, is used to construct the time series oftdover the northern tropical Atlantic for the summer months (June to August) from 1982 through 2009 (12). In Fig. 1, tdis averaged over 10° to 65°W and 0° to 30°N. We use monthly mean precipitation data from the Global Precipitation Climatology Project Version 2 to construct the time series of the
Sahel precipitation (21). The precipitation series is averaged over 5°W to 20°E, 10° to 20°N in the summer months (June to August) from 1979 through 2012. We use geopotential height at 925 and 700 hPa at 0600 UT from ERA-Interim daily product to calculate theZhl, which is the difference in the geopotential heights at these two pressure levels over North Africa (22). Dust emission rates (16) were derived from Spinning Enhanced Visible and Infrared Imager infrared dust index images from March 2006 to February 2008. Last, 925 hPa and 10-m meridional and zonal winds at 0600 UT are from the ERA-Interim daily product from 1979 through 2012. Although wind speeds in the data-sparse Sahara are subject to error, a recent comparison of reanalysis and observed surface winds within the Sahel demonstrated that the ERI-Interim is best suited for analysis of dust emission processes there (28).
Statistical analysis
Correlation coefficients and significance of correlations (using a two-tailedt test) for the time series in Fig. 1 were calculated using the seasonal (June to August) means of each variable and over the time period 1982–2009. We used a Fisher’s z transformation to test the statistical significance of the difference between the correlation coeffi-cients of previous- and concurrent-year Sahelian rainfall andtd. More specifically, this test provides a method of obtaining uncertainty esti-mates on correlation coefficients, based only on the degrees of free-dom in the data. For the zero-lagged correlation between Sahel rainfall and dust, using the 43-year-long Barbados dust data, the cor-relation coefficient and its 95% confidence interval is 0.53 ± 0.22, and the same quantity for the 1-year lagged correlation is 0.66 ± 0.18.
In Fig. 2B, the anomalous wind field was obtained by separate re-gressions of the meridional and zonal 925-mbar 0600 UT winds onto dailyZhl, using data from the months June to August and the period 1979–2012. Notably, the results in Figs. 2B and 3 (D to F), which were based on daily data, were obtained without first removing the annual cycle in the various data sets examined. However, we were able to re-produce all results after first removing the annual cycles in these data (not shown).
REFERENCES AND NOTES
1. Y. J. Kaufman, I. Koren, L. A. Remer, D. Tanré, P. Ginoux, S. Fan, Dust transport and deposition observed from the Terra-Moderate Resolution Imaging Spectroradiometer (MODIS) spacecraft over the Atlantic Ocean. J. Geophys. Res. 110, D10S12 (2005).
2. A. T. Evan, D. J. Vimont, A. K. Heidinger, J. P. Kossin, R. Bennartz, The role of aerosols in the evolution of tropical North Atlantic Ocean temperature anomalies. Science 324, 778–781 (2009). 3. P. J. DeMott, K. Sassen, M. R. Poellot, D. Baumgardner, D. C. Rogers, S. D. Brooks, A. J. Prenni, S. M. Kreidenweis, African dust aerosols as atmospheric ice nuclei. Geophys. Res. Lett. 30, 1732 (2003).
4. M. Yoshioka, N. M. Mahowald, A. J. Conley, W. D. Collins, D. W. Fillmore, C. S. Zender, D. B. Coleman, Impact of desert dust radiative forcing on Sahel precipitation: Relative importance of dust compared to sea surface temperature variations, vegetation changes, and greenhouse gas warming. J. Climate 20, 1445–1467 (2007). 5. J. M. Creamean, K. J. Suski, D. Rosenfeld, A. Cazorla, P. J. DeMott, R. C. Sullivan, A. B. White,
F. M. Ralph, P. Minnis, J. M. Comstock, J. M. Tomlinson, K. A. Prather, Dust and biological aerosols from the Sahara and Asia influence precipitation in the Western U.S. Science 339, 1572–1578 (2013).
6. G. S. Okin, A. R. Baker, I. Tegen, N. M. Mahowald, F. J. Dentener, R. A. Duce, J. N. Galloway, K. Hunter, M. Kanakidou, N. Kubilay, J. M. Prospero, M. Sarin, V. Surapipith, M. Uematsu, T. Zhu, Impacts of atmospheric nutrient deposition on marine productivity: Roles of nitrogen, phos-phorus, and iron. Global Biogeochem. Cycles 25, GB2022 (2011).
7. R. Das, A. T. Evan, D. Lawrence, Contributions of long-distance dust transport to
atmo-spheric P inputs in the Yucatan Peninsula. Global Biogeochem. Cycles 27, 167–175 (2013).
on October 11, 2015
http://advances.sciencemag.org/
8. A. T. Evan, C. Flamant, S. Fiedler, O. Doherty, An analysis of aeolian dust in climate models. Geophys. Res. Lett. 41, 5996–6001 (2014).
9. S. Engelstaedter, I. Tegen, R. Wahsington, North African dust emissions and transport. Earth-Sci. Rev. 79, 73–100 (2006).
10. P. Ginoux, J. M. Prospero, T. E. Gill, N. C. Hsu, M. Zhao, Global-scale attribution of anthro-pogenic and natural dust sources and their emission rates based on MODIS Deep Blue aerosol products. Rev. Geophys. 50, RG3005 (2012).
11. J. M. Prospero, P. J. Lamb, African droughts and dust transport to the Caribbean: Climate change implications, Science 302, 1024–1027 (2003).
12. A. T. Evan, S. Mukhopadhyay, African dust over the northern tropical Atlantic: 1955–2008.
J. Appl. Meteor. Climatol. 49, 2213–2229 (2010).
13. G. R. Foltz, M. J. McPhaden, Impact of Saharan dust on tropical North Atlantic SST. J. Clim. 21 5048–5060 (2008).
14. F. Fécan, B. Marticorena, G. Bergametti, Parameterization of the increase of the aeolian erosion threshold wind friction velocity due to soil moisture for arid and semi-arid areas.
Ann. Geophys. 17, 149–157 (1999).
15. S. M. Cowie, P. Knippertz, J. H. Marsham, Are vegetation-related roughness changes the cause of the recent decrease in dust emission from the Sahel? Geophys. Res. Lett. 40 1868–1872 (2013). 16. K. Schepanski, I. Tegen, M. C. Todd, B. Heinold, G. Bönisch, B. Laurent, A. Macke, Meteoro-logical processes forcing Saharan dust emission inferred from MSG-SEVIRI observations of subdaily dust source activation and numerical models. J. Geophys. Res. 114, D10201 (2009). 17. P. Knippertz, M. C. Todd, Mineral dust aerosols over the Sahara: Meteorological controls on emission and transport and implications for modeling. Rev. Geophys. 50, RG1007 (2012). 18. D. A. Ridley, C. L. Heald, J. M. Prospero, What controls the recent changes in African mineral
dust aerosol across the Atlantic? Atmos. Chem. Phys. 14, 5735–5747 (2014).
19. S. Engelstaedter, R. Washington, Temporal controls on global dust emissions: The role of surface gustiness. Geophys. Res. Lett. 34, L15805 (2007).
20. R. F. Adler, G. J. Huffmann, A. Chang, R. Ferraro, P.-P. Xie, J. Janowiak, B. Rudolf, U. Schneider, S. Curtis, D. Bolvin, A. Gruber, J. Susskind, P. Arkin, E. Nelkin, The version-2 global precipitation
climatology project (GPCP) monthly precipitation analysis (1979–present). J. Hydrometeor 4,
1147–1167 (2003).
21. C. Lavaysse, C. Flamant, S. Janicot, D. J. Parker, J.-P. Lafore, B. Sultan, J. Pelon, Seasonal evolution of the West African heat low: A climatological perspective. Clim. Dyn. 33,
313–330 (2009).
22. D. P. Dee, S. M. Uppala, A. J. Simmons, P. Berrisford, P. Poli, S. Kobayashi, U. Andrae, M. A. Balmaseda, G. Balsamo, P. Bauer, P. Bechtold, A. C. M. Beljaars, L. van de Berg, J. Bidlot, N. Bormann, C. Delsol, R. Dragani, M. Fuentes, A. J. Geer, L. Haimberger, S. B. Healy, H. Hersbach, E. V. Hólm, L. Isaksen, P. Kållberg, M. Köhler, M. Matricardi, A. P. McNally, B. M. Monge-Sanz, J.-J. Morcrette, B.-K. Park, C. Peubey, P. de Rosnay, C. Tavolato, J.-N. Thépaut,
F. Vitart, The ERA-Interim reanalysis: Configuration and performance of the data assimilation system. Q. J. R. Meteorol. Soc. 137, 553–597 (2011).
23. C. Lavaysse, C. Flamant, S. Janicot, Regional-scale convection patterns during strong and weak phases of the Saharan heat low. Atmos. Sci. Lett. 11, 255–264 (2010).
24. A. T. Evan, C. Flamant, C. Lavaysee, C. Kocha, A. Saci, Water vapor–forced greenhouse
warming over the Sahara desert and the recent recovery from the Sahelian drought. J. Clim.
28, 108–123 (2015).
25. A. T. Evan, S. Fiedler, C. Zhao, L. Menut, K. Schepanski, C. Flamant, O. Doherty, Derivation of an observation-based map of North African dust emission. Aeolian Res. 16, 153–162 (2015).
26. D. L. Westphal, O. B. Toon, T. N. Carlson, A two-dimensional numerical investigation of the
dynamics and microphysics of Saharan dust storms. J. Geophys. Res. 92, 3027–3049 (1987).
27. I. Tegen, I. Fung, Modeling of mineral dust in the atmosphere: Sources, transport, and
optical thickness, J. Geophys. Res. 99, 22897–22914 (1994).
28. Y. Largeron, F. Guichard, D. Bouniol, F. Couvreux, L. Kergoat, B. Marticorena, Can we use surface wind fields from meteorological reanalyses for Sahelian dust emission simulations? Geophys. Res. Lett. 42, 2490–2499 (2015).
Acknowledgments: We would like to thank two anonymous reviewers for their helpful com-ments on an earlier version of this manuscript. Funding: This work benefitted from the support of the Agence Nationale de la Recherche (ANR) grant ANR-10-LABX-18-01 of the national Pro-gramme Investissements d’Avenir. Funding for this work was also provided by Laboratoire
d’excellence Institut Pierre Simon Laplace (L-IPSL). Author contributions: W.W. and A.T.E.
de-signed the study. W.W. carried out the main analysis and wrote the manuscript. C.L. provided historical heat low data. All authors discussed the main findings and contributed to the man-uscript writeup. Competing interests: The authors declare that they have no competing in-terests. Data and materials availability: Reanalysis data from the European Centre for Medium Range Weather Forecasts was downloaded from http://apps.ecmwf.int/datasets/. Global Precipitation Climatology Project data were downloaded from the National Climatic Data Center Web site (http://ncdc.noaa.gov).
Submitted 20 May 2015 Accepted 31 July 2015 Published 9 October 2015 10.1126/sciadv.1500646
Citation: W. Wang, A. T. Evan, C. Flamant, C. Lavaysse, On the decadal scale correlation between African dust and Sahel rainfall: The role of Saharan heat low–forced winds. Sci. Adv. 1, e1500646 (2015).
on October 11, 2015
http://advances.sciencemag.org/
doi: 10.1126/sciadv.1500646 2015, 1:.
Sci Adv
Lavaysse (October 9, 2015)
Weijie Wang, Amato T. Evan, Cyrille Flamant and Christophe−
this article is published is noted on the first page.
This article is publisher under a Creative Commons license. The specific license under which
article, including for commercial purposes, provided you give proper attribution.
licenses, you may freely distribute, adapt, or reuse the CC BY
For articles published under
. here
Association for the Advancement of Science (AAAS). You may request permission by clicking for non-commerical purposes. Commercial use requires prior permission from the American
licenses, you may distribute, adapt, or reuse the article CC BY-NC
For articles published under
http://advances.sciencemag.org. (This information is current as of October 11, 2015): The following resources related to this article are available online at
http://advances.sciencemag.org/content/1/9/e1500646.full.html online version of this article at:
including high-resolution figures, can be found in the
Updated information and services,
http://advances.sciencemag.org/content/1/9/e1500646#BIBL 3 of which you can be accessed free:
cites 28 articles,
This article
trademark of AAAS
otherwise. AAAS is the exclusive licensee. The title Science Advances is a registered York Avenue NW, Washington, DC 20005. Copyright is held by the Authors unless stated published by the American Association for the Advancement of Science (AAAS), 1200 New
(ISSN 2375-2548) publishes new articles weekly. The journal is Science Advances
on October 11, 2015
http://advances.sciencemag.org/