HAL Id: hal-02324121
https://hal.archives-ouvertes.fr/hal-02324121
Submitted on 5 Jan 2021HAL is a multi-disciplinary open access archive for the deposit and dissemination of sci-entific research documents, whether they are pub-lished or not. The documents may come from teaching and research institutions in France or abroad, or from public or private research centers.
L’archive ouverte pluridisciplinaire HAL, est destinée au dépôt et à la diffusion de documents scientifiques de niveau recherche, publiés ou non, émanant des établissements d’enseignement et de recherche français ou étrangers, des laboratoires publics ou privés.
Sub-lethal effects of waterborne copper in early
developmental stages of rainbow trout (Oncorhynchus
mykiss)
Shannon Weeks Santos, Jérôme Cachot, Pierre-Yves Gourves, Christelle
Clérandeau, Bénédicte Morin, Patrice Gonzalez
To cite this version:
Shannon Weeks Santos, Jérôme Cachot, Pierre-Yves Gourves, Christelle Clérandeau, Bénédicte Morin, et al.. Sub-lethal effects of waterborne copper in early developmental stages of rainbow trout (Oncorhynchus mykiss). Ecotoxicology and Environmental Safety, Elsevier, 2019, 170, pp.778-788. �10.1016/j.ecoenv.2018.12.045�. �hal-02324121�
SUB-LETHAL EFFECTS OF WATERBORNE COPPER IN EARLY DEVELOPMENTAL 1
STAGES OF RAINBOW TROUT (ONCORHYNCHUS MYKISS) 2
3 4
Shannon Weeks Santos1, Jérôme Cachot1, Pierre-Yves Gourves2, Christelle Clérandeau1, 5
Bénédicte Morin1, Patrice Gonzalez2, * 6
7
1UMR CNRS 5805 EPOC, University of Bordeaux, Avenue des Facultés, 33405, Talence 8
Cedex, France 9
2UMR CNRS 5805 EPOC, University of Bordeaux, Place du Dr B. Peyneau, 33120 10
Arcachon, France 11
12
*Corresponding author: [email protected] 13
ABSTRACT 14
The aim of this work was to study the impact of copper during a sub-chronic exposure to 15
environmental concentrations in the early life stages of rainbow trout (Oncorhynchus mykiss). 16
Eyed-stage embryos of rainbow trout, at 265°D, were exposed in semi-static conditions to sub-17
lethal concentrations of CuSO4 up to the larval stage (528 °D) under laboratory-controlled 18
conditions. During 3 weeks, they were exposed to the environmentally-realistic concentration 19
of 2 µg/L Cu and to a 10-fold higher concentration, 20 µg/L Cu. Several biological (survival, 20
hatching success, malformation, growth) and behavioral (swimming activity) and molecular 21
endpoints (genotoxicity and gene transcription) were studied. Exposure to 20 µg/L Cu had an 22
inhibitory effect on hatching and increased half-hatched embryos (25%). At the end of the 23
exposure, no significant differences were observed in growth of the larvae exposed to the 24
highest Cu concentration. However, larvae exposed to 2 µg/L Cu exhibited increased growth 25
in comparison with non-exposed larvae. The percentage of malformed larvae was significantly 26
higher for both copper conditions, with skeletal malformations being the most observed. 27
Expression of several genes was evaluated in whole larvae using quantitative real-time PCR. 28
Genes involved in detoxification (gst, mt1 and mt2) and in cell cycle arrest (p53) were 29
significantly repressed in both copper conditions when compared to control. In addition, 30
potential genotoxic effects on larvae were investigated by the comet assay on blood cells, but 31
this test did not demonstrate any significant DNA damage on larvae exposed to copper. This 32
study confirms the adverse effects of copper on early life stages of rainbow trout even at the 33
lowest environmentally relevant tested concentration. 34
35
Keywords: copper, Oncorhynchus mykiss, early life-stage, developmental toxicity, 36
genotoxicity, gene transcription. 37
38 39 40
1. Introduction 41
Copper is one of the few metals that occurs naturally in ecosystems, as well as being one of 42
the first used by humans since 8000 B.C. Over 95 % of all copper in circulation today has been 43
extracted since 1900. It is an essential trace element involved in numerous biological 44
processes, such as photosynthesis in plants. It also plays an essential role in certain enzyme 45
functions in animals, including copper-zinc superoxide dismutase and cytochrome c-oxidase 46
(Eisler, 1998). Copper is widely used in industrial, agricultural and urban activities, and 47
consequently is one of the priority substances listed in the Water Framework Directive (WFD). 48
With its significant anti-microbial and anti-fungal properties, copper has been used extensively 49
in vineyards, resulting in high levels of transfer to soils and aquatic ecosystems (Devez et al., 50
2005; El Azzi et al., 2013; Komárek et al., 2010; Ruyters et al., 2013). Recent reports have 51
shown that Cu-containing fungicides and boat antifouling paints appear to be the main 52
anthropogenic sources of Cu in aquatic ecosystems (Babcsányi et al., 2014; Devier et al., 53
2005; Petit et al., 2013; Singh & Turner, 2009). Monitoring this element in the coastal marine 54
environment by the Chemical Contamination Observation Network (ROCCH, IFREMER) using 55
the Pacific oyster (Magallana gigas) as a sentinel species showed an increase in its 56
concentration at certain points along the French coast, such as Arcachon Bay (Claisse and 57
Alzieu, 1993; Gamain et al., 2016). 58
Pollution of surface water and groundwater is one of the biggest environmental issues. The 59
background copper concentrations in unpolluted water bodies varied between 0.2 to 6 µg/L 60
(Flemming and Trevors, 1989; Willis and Bishop, 2016). Levels of copper can increase from 61
anthropogenic pollution as a result of urban and agricultural runoffs (Davis et al., 2001; Devez 62
et al., 2005). Copper concentration in Beysehir lake (Turkey) was up to 100 µg/L in spring 2004 63
(Tekin-Özan, 2008). The river Lot (southern France), with a large history of metal pollution, 64
concentrations of copper in water column was 17 µg/L in 1987; but, this concentration 65
decreased in 2006 to 3.2 µg/L (Shinn et al, 2009). In several Asturians rivers (Spain), copper 66
concentrations were between 2.5 and 4.9 µg/L (Linde et al., 1998), and in Boulder river 67
(Montana, USA) was ranged from 1.4 to 23 µg/L (Farag et al., 2007). 68
High concentrations of copper in ecosystems may be harmful to aquatic organisms. Indeed, 69
although essential, Cu induces toxic effects during chronic exposure and over-accumulates in 70
living organisms (Marr et al., 1996; Kamunde et al., 2002; Vardy et al., 2013). Since copper 71
can participate in Fenton and Haber-Weiss reactions, it can produce reactive oxygen species 72
(ROS), which react with H2O2 and cause cellular damage to lipids, nucleic acids and proteins 73
that can lead to cell death (Manzl et al., 2004; Prousek, 2007; Bopp et al., 2008). Many studies 74
have highlighted the toxic effects of copper on fish and mollusks (Vardy et al., 2013; Gamain 75
et al., 2016; Boukadida et al., 2017). Sensitivity to copper can vary greatly from one fish 76
species to another. For example, Vardy et al. (2013) determined the lethal concentrations 77
(LC50) at 96 h of Cu exposure at different life stages of fish, which for swim-up larvae of white 78
sturgeon and rainbow trout was 10 and 21 µg/L of Cu, respectively. McKim et al. (1978) 79
examined embryo mortality of eight different fish species after Cu exposure and observed 80
significant mortality between 37 and 555 µg/L. Besides, this sensitivity to metals could also 81
differ according to the development stage (McKim et al., 1978; Vardy et al., 2013) and water 82
chemistry parameters like hardness, pH, organic carbon and alkalinity (Brix et al., 2017; 83
Crémazy et al., 2017; Eisler, 1998). 84
Several reports have revealed that early life stages of fish are a great deal more vulnerable to 85
pollutants than juveniles and adults (Eaton et al., 1978; Hutchinson et al., 1998; Van Leeuwen 86
et al., 1985; Vardy et al., 2013). Embryos and larvae organs, such as liver, gills and kidney, 87
are not entirely developed, which can result into a higher sensitivity to toxicants (Mohammed, 88
2013). Additionally, larvae have a permeable skin that could allow the uptake of pollutants 89
(Mohammed, 2013). Because fish embryos and larvae have an important role in the trophic 90
chain and, in the persistence of population as well, the use of these stages are relevant for the 91
assessment of toxicity in the aquatic environment. Several reports have studied copper toxicity 92
in early life stages of fishes (Barjhoux et al., 2012; El-Fiky, 2001; Kazlauskienë, 2002; 93
Stasiūnaitė, 2005; Witeska et al., 2010). 94
Early life stages of rainbow trout (Oncorhynchus mykiss) can be easily raised under laboratory 95
conditions, and it is considered, along with other species, as a model animal in ecotoxicology 96
(OECD, 2013). Due to its slow embryo-larval development, toxicity tests allow longer sub-97
chronic exposures to toxicants. This species has been extensively studied and, because of its 98
low tolerance to poor water quality, is considered as one of the most commonly used sentinel 99
species for aquatic ecotoxicology (De Boeck et al., 2004; Hansen et al., 2002; Kamunde et al., 100
2002; Olsson et al., 1990). 101
The purpose of the present work was to evaluate and to characterize the sub-lethal effects of 102
environmental concentrations of copper to early developmental stage of rainbow trout. At the 103
end of the 3-week Cu exposure, several end-points like viability, hatching rate, developmental 104
abnormalities, larval swimming behavior, genotoxicity (DNA damage), lipid and protein 105
peroxidation, and gene expression were analyzed. 106
107
2. Materials and methods 108
2.1. Chemicals 109
Copper sulfate (CuSO4·H2O, CAS 7758-99-8, 99.99%) and low melting point agarose (LMPA) 110
were purchased from Sigma Aldrich (Lyon, FR). Phosphate-buffered saline (PBS), nitric acid 111
65% and normal melting point agarose (NMPA) were purchased from Fluka Chemie 112 (Buchs, CH). 113 114 2.2. Exposure condition 115
Rainbow trout embryos (Oncorhynchus mykiss) at eyed stage were provided by INRA-PEIMA 116
(Sizun, FFR). They were incubated in total darkness under a temperature of 12°C. Embryos 117
were exposed to copper from 265 DD (degrees days) up to the larval stage of 528 DD for a 118
total of 23 days of exposure. Two concentrations of exposure for copper were chosen: 2 119
(environmental concentration) and 20 µg/L. These solutions Copper solutions (2 and 20 µg/L 120
Cu) were prepared using CuSO4·5H2O and the required concentrations were calculated 121
according to the quantity of copper ions (Cu2+). Each studied condition, and a control without 122
Cu, involved 3 replicates with 100 embryos in 1 L aquaria. Exposure water was prepared in 123
three 5 L tanks of Saint-Etienne spring water (63 mg/L Ca, 10.2 mg/L Mg, 1.4 mg/L Na, 0.4 124
mg/L K, 173.2 mg/L HCO3-, 51.3 mg/L SO42-, 2 mg/L NO3-, pH 7.6, <1 mg/L Cl-, <1.5 mg/L 125
DOC). A peristaltic pump (Watson Marlow, USA) was used to maintain a continuous flow rate 126
of water (9 mL/min) into the incubation chambers. To keep the require copper concentration in 127
aquaria, water was renewed every 48 h. At the end of the experiment, larvae were sampled 128
per replicate as follow: 10 larvae to record for biometrics and morphological anomalies, 6 129
larvae for the study of swimming behavior, 6 larvae for blood sampling for genotoxicity test. 130
The remaining larvae were pooled and stored at -80°C for biochemical analysis and gene 131
transcription. 132
133
2.3. Analysis of copper in water and larvae 134
Fish and water samples were analyzed to determine Cu concentrations. Fish samples (2 pools 135
of 5 larvae from each replicate) were lyophilized and digested by nitric acid (0.3 mL of HNO3 136
67 %). Four tubes containing the international certified reference material, Dolt-5 samples 137
(Fish liver), were prepared in order to verify the accuracy of the method. Approximately 80 mg 138
of this material was digested by 3 mL of nitric acid in polypropylene tubes. Then, this mixture 139
was heated by Hot Block for 3 h at 100°C, and after cooling 1.5 mL and 15 mL of ultrapure 140
water (Milli-Q®) was respectively added to sample larvae and certified reference. Finally, 3 141
blank samples were also prepared in the same conditions (3 mL of HNO3 before heating and 142
15 mL of Milli-Q water added after cooling). 40 mL of water sample of each condition were 143
collected in 3 random days through the experiment, and acidified with 5 % of nitric acid (Nitric 144
acid 65 %, Fluka). Copper concentrations in water of condition “20 µg/L” and fish samples were 145
analyzed by inductively Coupled Plasma Optic Emission Spectrometry (ICP-OES 720, Agilent 146
Technologies), whereas copper concentrations in water of controls and “2 µg/L” conditions 147
were analyzed by atomic absorption spectrophotometer (Varian SpectrAA 240Z, Agilent 148
Technologies, Santa Clara, USA). Detection limits (DL) for ICP-OES was 2.26 µg/L Cu2+ and 149
for atomic absorption was 0.5 µg/L Cu2+. 150
2.4. Phenotypic effects 151
Dead embryos and larvae were recorded daily and removed immediately to prevent water 152
alterations. Individuals were considered half-hatched when at least a part of the body was 153
inside the chorion. Embryonic and larval mortality refer to the number of dead individual 154
compared to the total number of embryos at the start of the experiment or total number of 155
totally hatched larvae. Half-hatched mortality was only considered when at least a part of the 156
body was inside the chorion. Hatching time refers to the number of degree days (DD: number 157
of days x temperature) from fertilization to hatching. Hatching rate is calculated by dividing the 158
number of half-hatched embryos by the total number of embryos at the beginning of the 159
experiment. The appearance of anomalies was microscopically examined in 10 larvae per 160
replicate randomly chosen. The larvae were placed in a Petri dish with carbonated water and 161
ice to sedate them. Photos were taken for each larva with a stereomicroscope (MZ7.5 Leica) 162
coupled to a camera CCD (DFP420C Leica) and a cold light (Intralux® 4100, Volpi AG, 163
Schlieren, Switzerland). From the photos, we measured total body and head length for each 164
larva using Leica Microsystems software v3.8 (Nanterre, France). Larvae were also observed 165
to locate possible malformations such as edemas, spinal and craniofacial deformities, cardiac 166
anomalies, hemorrhages and yolks sac resorption. 167
168 169 170
2.5. Genotoxicity test 171
The comet assay was performed according to the Singh et al. (1988) protocol, adapted by Le 172
Bihanic et al. (2014). Blood sampling were performed in 6 larvae per replicate by decapitation 173
using a heparinized pipette. Samples were stored in a microtube with 200 µL of 174
cryopreservation solution (250 mM sucrose, 40 mM citrate trisodique, 5 % DMSO, pH adjusted 175
to 7.6 with nitric acid 1 M) and immediately frozen in liquid nitrogen until analysis. These 176
storage conditions have already been described by Barillet et al. (2005) and Bony et al. (2008), 177
this protocol has been validated for rainbow trout blood cells in our laboratory. 50 µL of cell 178
suspension was added to 100 µL of LMPA (Low Melting Point Agarose). Two aliquots of 50 µL 179
of the suspension were placed onto slides previously covered with NMPA (Normal Melting 180
Point Agarose, 1 %, w/w) and a coverslip (18x18 mm) was added. The gels were left to harden 181
for 15 min at 4°C and then the coverslips were removed from each slice and a second layer of 182
LMPA was placed on the gels with new coverslips and hardened at 4°C for 15 minutes. The 183
slices were put in a lysis solution (10 mM Tris; 2.5 M NaCl; 100 mM EDTA; 1% Triton x-100; 184
10% DMSO; pH adjusted to 10 with NaOH) at 4°C for 90 minutes. Slices were placed 185
horizontally on a tray with electrophoresis solution (0.3 M NaOH, 1 mM EDTA, pH> 13) for 20 186
minutes to allow the DNA to unwind. Electrophoresis was performed with a voltage of 25 V and 187
290 mA for 20 minutes. After electrophoresis, slices were rinsed 3 times with a neutralizing 188
solution (0.4 M Tris, pH 7.5) for 5 minutes at 4°C. Then, slices were soaked with absolute 189
ethanol for 20 minutes and dried at a room temperature for at least 24 hours. Slices were 190
stained with 20 µg/mL of ethidium bromide solution. Comet analysis was performed using an 191
epifluorescence microscope, and DNA damage was measured with Comet Assay IV software 192
on 100 cells randomly selected. Results are expressed as percentage of degradation of DNA 193
tail. Heavily degraded cells, or inexistent head with diffuse tail, were not counted in the tail 194
DNA measurements as proposed by Kumaravel et al. (2009). However, they were counted as 195
hedgehogs on a total of 100 cells per gel. 196
2.6. Behavioral analysis: swimming test 198
The swimming behavior of 528 DD larvae was studied using the Daniovision Image analysis 199
system version 10.0 Noldus. Six larvae per replicate were placed in 6-well microplates 200
containing 8 mL of exposure water. The microplates were placed in the recording chamber in 201
the dark at 12 °C for about 30 min to acclimate the larvae. Then the analysis was started. An 202
infrared camera in the chamber recorded the movements of each larvae focusing on their 203
center of gravity. The analysis takes 30 min with dark/light/dark cycle of 10 min each. This 204
cycle allows to analyze the behavior of larvae in response to light stimulation. Ethovision 205
software allows to record the average speed of each larvae every 30 seconds. For each larva, 206
the swimming performance was assessed by determining the total distance moved (cm) in 10-207
minute period, and time of mobility accumulated (s) on larvae. Mobility is defined as the period 208
of time where the area of total larva is modified albeit central point of larvae had not changed. 209
If more than 60 % of the area was changed, it was considered as highly mobile. Otherwise, 210
less than 60 %, it was considered only as mobile. 211 212 2.7. Biochemical analysis 213 Preparation of supernatant 214
Pools of 5 larvae were frozen in liquid nitrogen and then stored at -80°C until analysis. At the 215
moment of analysis, yolk sac from larvae were removed and then larvae (approximately 250 216
mg) were homogenized in a chilled phosphate buffer (0.1 M; pH 7.5) using an UltraTurrax® 217
tissue homogenizer fitted with a potter at 3,000 rpm (4°C). The supernatant was centrifuged at 218
9,000 g for 25 min at 4°C to obtain the supernatant S9 fraction. This fraction contains soluble 219
proteins from cytosol and microsomes (Parmentier et al., 2007). Total protein, TBARS levels 220
and protein carbonyls content were analyzed using the S9 fraction. 221
Total protein
223
The total protein concentration was measured on S9 fraction by the method of Lowry et al., 224
(1951) using Bovine Serum Albumin (BSA) as a standard and Folin’s reagent. Measurements 225
were done using a spectrophotometer microplate reader (Synergy HT, BioTek). 226
Lipid peroxidation
227
Lipid peroxidation was determined using the adapted technique of Buege and Aust (1978) 228
adapted to a microplate reader. 500 µL of a solution containing 20 % of trichloroacetic acid 229
(TCA) and 20 % butylated hydroxytoluene (BHT) was added to 500 µL of S9 fraction and then 230
mixture was centrifuged for 10 min at 9,000 g. Afterwards, 600 µL of supernatant with 480 µL 231
of TRISbase (25 mM)-TBA (thiobarbituric acid-100 mM) and 120 µL of 0.6 N HCl heated at 232
80°C for 15 min. The tubes were then cooled and mixed. TBARS levels were read using a UV-233
spectrophotometer (Biotek Synergy HT) in a microplate at 530 nm. Results were expressed as 234
nmoles of thiobarbituric acid reactive substance (TBARS) equivalents per milligram of protein. 235
Protein Carbonyl analysis
236
Protein carbonyl content was assessed using the spectrophotometry method described in 237
Augustyniak et al., (2015). 50 µL of a solution of 11 % streptomycin sulfate – phosphate buffer 238
(100 mM pH 7.4) were added to 500 µL of S9 fraction, then it was mixed and incubated for 15 239
min at room temperature. Afterwards, mixtures were centrifuged for 10 min at 6,000 g. Then 240
200 µL supernatant was added to 800 µL of DNPH (2.4-dinitrophenylhydrazine 10 mM) used 241
as a sample tube, and to 800 µL of HCl 2.5 M used as a control tube; then, incubated for 1 h 242
at room temperature with vortexing every 15 min. Proteins were precipitated with 1 mL of 20 % 243
TCA (trichloroacetic acid), vortexed and centrifuged for 10 min at 10,000 g. The pellets were 244
rinsed with 1 mL of ethanol-ethyl acetate (v:v), vortexed and centrifuged three times. Then 245
pellets were solubilized with 500 µL of 6 M guanidine HCl and centrifuged at 10,000 g for 10 246
min. The carbonyl content was measured using a UV-spectrophotometer (Biotek Synergy HT) 247
at 370 nm. Results were expressed as nanomoles of DNPH incorporated/mg protein. 248
2.8. Gene expression 249
6 larvae per replicate were collected in a storage buffer (RNA later, Qiagen). Samples were 250
frozen in liquid nitrogen and stored at -80°C until analysis. 251
RNA extraction
252
Total RNA extraction from whole larvae was performed with the kit “SV Total RNA Isolation 253
system” (Promega) following the supplier’s recommendations. Larvae were homogenized 254
using the MP fastprep®-24 (Biorad, 6 m/s, 40s) with 14.4 mm diameter ceramics beads (MP 255
Biomedicals, Lyssing Matrix D Bulk). 256
Retro-transcription of total RNA into cDNA
257
The retro-transcription of total purified RNA was carried out with the kit “GoScript Reverse 258
Transcription System” (Promega). To execute the Reverse transcription, 1 µL of oligodT (1 259
µM) and 1 µL of hexanucleotides (1 µM) have been added to 10 µL of total purified RNA (1 260
µg). Then, the mix was heated at 70°C for 5 minutes with a thermocycler (Eppendorf 261
Mastercycler) followed by 5 minutes at 4°C to allow primer annealing. Subsequently, 1 µL of 262
dNTP solution (10 mM), 4 µL of activity buffer, 1.5 µL of MgCl2 (25 mM), 1 µL or reverse 263
transcriptase (1 U/µL) and 0.5 µL or RNAsine were added. The reverse transcription reaction 264
was performed for 1 h at 42°C in a thermocycler. The cDNA thus obtained were stored at -265
20°C pending analysis by quantitative real-time PCR reaction. 266
Quantitative real-time PCR
267
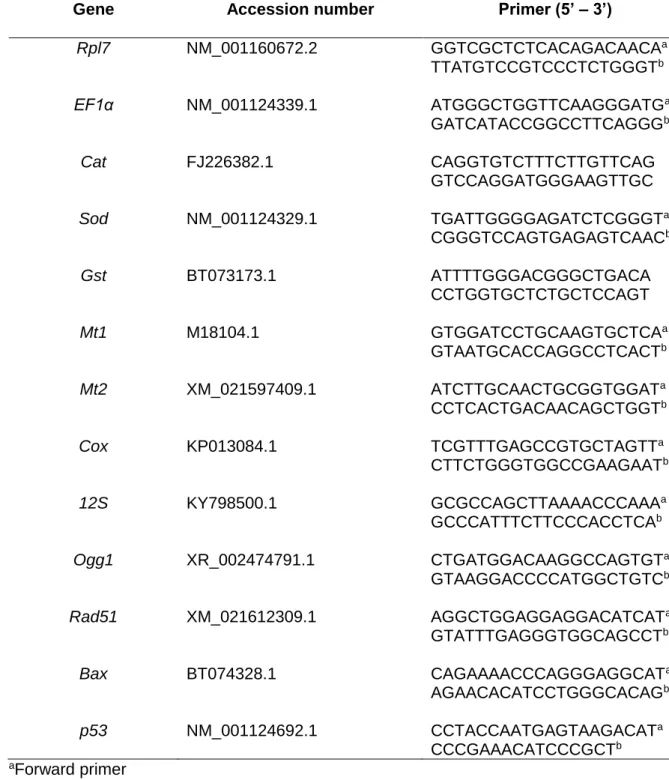
Thirteen genes were investigated and specific primer-pairs designed with primer3plus software 268
(Table 1). All the primer-pairs used in this study have an efficiency upper than 95%. Real-time 269
qPCR was carried out using GoTaq® qPCR Master Mix kit (Promega). PCR reactions 270
contained 17 µL of a mixture of Nuclease-Free Water and GoTaq® qPCR Master Mix 271
containing the SyberGreen fluorescent dye, 2 µL of specific primer pairs mix (200 µM each) 272
and 1 µL of cDNA. Real-time quantitative PCR reactions were performed in a Mx3000P® 273
qPCR System (Stratagene). The amplification program consisted in one cycle at 95°C for 10 274
min, then 45 amplification cycles at 95°C for 30 s, 60°C for 30 s and 72°C for 30 s. Specificity 275
was determined for each reaction from the dissociation curve of the PCR products. This 276
dissociation curve was obtained by following the SYBR Green fluorescence level during a 277
gradual heating of the PCR products from 60 to 95°C. 278
Cycle thresholds (Ct) were obtained from MxProTM qPCR software for each gene. Two different 279
reference genes were investigated (Rpl7 and EF1α) and were found to be stable in our 280
conditions. Consequently, relative quantification of each gene expression level was normalized 281
according to the mean Ct value of these two reference genes according to the 2∆Ct methods 282
described by Livak and Schmittgen (2001). The ratio of transcription level to exposed 283
individuals with the control ones gives the induction factor (>2) or repression factor (<0.5) of 284 studied genes. 285 286 2.9. Statistics 287
Each studied condition was triplicated identically and each replicate was considered as an 288
independent sample. All data are represented by the mean ± SE (Standard Error). Statistical 289
analyzes were carried out using R (http://cran.r-projet.org/). The Normality of data distribution 290
was verified on the residues by the Shapiro-Wilk test (p < 0.01) and the homogeneity of 291
variances was evaluated by the Levene test (p < 0.05). In the case of normal distribution, a 292
one-way ANOVA analysis was used (p < 0.05) followed by a Tukey post-hoc test. In the case 293
that data was not normal, data was evaluated by non-parametric tests of Kruskal-Wallis 294
(p < 0.05). 295
3. Results 297
3.1. Test condition 298
Dissolved oxygen in water varied between 81.4 and 95.7 % throughout embryonic and larval 299
exposure. Table 2 shows Cu concentrations determined in the exposure water. Water samples 300
were collected in 3 random days. In the control group, Cu concentrations were below the 301
detection limit. Cu concentrations of the treatment at 20 µg/L were close to the nominal 302
concentration. However, results from 2 samples of the treatment at 2 µg/L were below the 303
detection limit (0.5 µg/L Cu). 304
305
3.2. Embryonic and larval survival 306
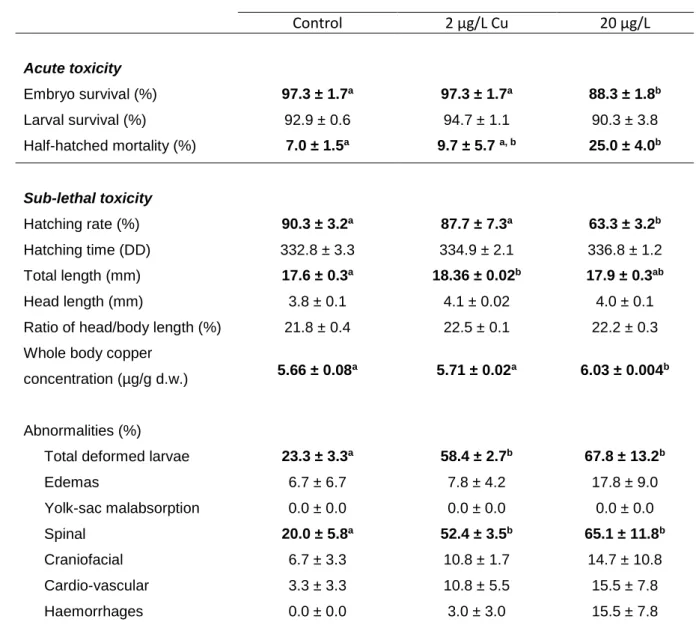
No significant differences in embryonic and larval survival were observed between the control 307
group and the condition at 2 µg Cu /L (Table 3). Regarding the condition of 20 µg/L Cu, a 308
significant decrease of embryonic survival was observed compared to control. Mortality of half-309
hatched embryos was significantly higher for those exposed to 20 µg/L Cu compared to other 310
conditions. In addition, Figure 1 and Table 3 show a significant lower hatchability for this 311
condition in comparison to control and 2 µg/L Cu. On the other hand, the hatching time (DD) 312
did not show any significant differences between the control and the two Cu exposure 313
conditions (Table 3). 314
315
3.3. Larvae copper accumulation 316
After 3 weeks of exposure, larvae exposed to 20 µg/L Cu showed a significantly higher 317
accumulation of Cu (p < 0.01) compared to control and larvae exposed to 2 µg/L Cu(Table 3). 318
No significant difference in Cu accumulation was observed in larvae exposed to 2 µg/L Cu 319
comparatively to control. 320
3.4. Biometrics 322
Exposure to the higher concentration of Cu (20 µg/L) did not promote significant changes on 323
larvae biometrics compared to control (Table 3). However, larvae exposed to 2 µg/L Cuwere 324
significantly longer compared to control larvae. However, this difference is small representing 325
only 4.14 % of increase between the two conditions. No significant differences were observed 326
between the length of head and the ratio between the size of head and the total length for the 327
two studied Cu conditions and the control (Table 3). 328
329
3.5. Malformations 330
Both copper conditions impaired normal development of larvae, where total malformations 331
were significantly higher when compared to control condition (Table 3). Spinal anomalies 332
(kyphosis, lordosis and c-shaped curvature) were the most frequently observed malformation, 333
but its incidence was much higher in the Cu exposed groups than in control. The incidence of 334
all the other recorded abnormalities (edemas, yolk sac malabsorption and craniofacial 335
malformation) tended to increase with increasing Cu concentration in the exposure water, 336
although no significant differences were observed among groups (Table 3). 337
338
3.6. Behavior 339
Responses lo light stimulation of larvae are presented in Figure 2. The results represent the 340
average distance traveled by larvae (Figure 2-A) and the cumulative time of high mobility 341
(Figure 2-B) and mobility (Figure 2-C) of larvae. Over the light period, larvae from all conditions 342
showed similar responses to light stimulation and all larvae increased their distance traveled 343
and their mobility compared to the first dark period. However, no significant differences were 344
observed between conditions on all studied parameters. 345
3.7. Genotoxicity 347
Results from the comet assay did not reveal any significant DNA damage in both Cu studied 348
conditions when compared to control larvae (Figure 3-A). Nevertheless, the percentage of 349
severely damage cells or ghost cells (“hedgehog”) was significantly increased in larvae 350
exposed to 20 µg/L Cu in comparison to control (Figure 3-B). 351
352
3.8. Lipid and protein oxidation 353
Larvae exposed to 2 and 20 µg/L of Cu exhibited no significant changes on the content of 354
thiobarbituric acid (Figure 3-D) and protein carbonylation (Figure 3-C) comparatively to non-355 exposed larvae. 356 357 3.9. Gene expression 358
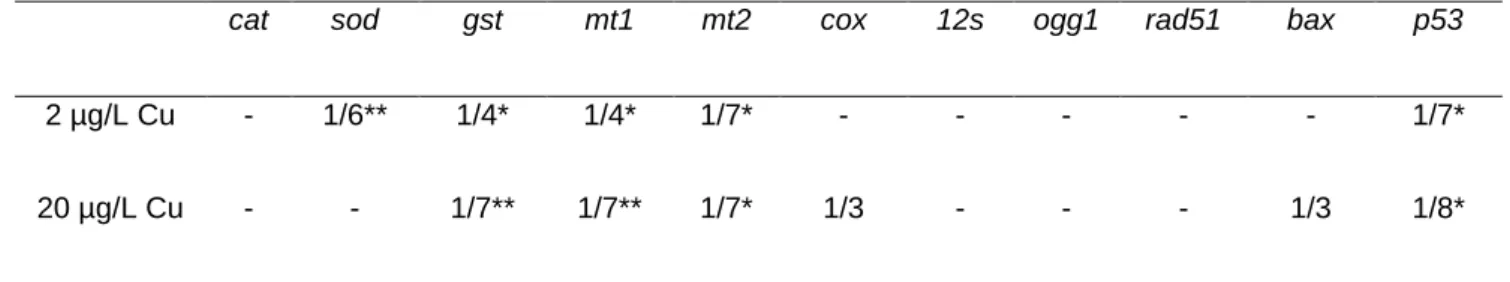
Cu effects on gene transcription were pronounced on both larvae exposed to 2 and 20 µg/L Cu 359
(Table 4). Indeed, genes involved in detoxification (gst, mt1 and mt2) and in cell cycle arrest 360
and apoptose (p53) were significantly repressed compared to control larvae. In contrast, gene 361
transcription related to DNA repair system (ogg1 and rad51) was not significantly altered at the 362
end of 3-weeks Cu exposure. Also, no effects were observed on cat and 12s genes for both 363
studied conditions. In the case of larvae exposed to 2 µg/L Cu, the transcription of sod was 364
significantly decreased when compared to control larvae. 365
366
4. Discussion 367
Copper is a ubiquitous metal that is naturally present in the environment. Although copper is 368
an important trace element for the proper functioning of the organism, strong concentrations 369
may be harmful to aquatic organisms (Flemming and Trevors, 1989; McKim et al., 1978). In 370
the present study, exposure to 2 µg/L Cu did not increase embryonic and larval survival and 371
hatching rate of rainbow trout when compared to control. Regarding the exposure to 20 µg/L 372
Cu, a significant decreased of embryonic viability was observed. However, the embryonic 373
viability was superior to the survival criteria given by OECD (2013) at 75 % for control condition 374
of rainbow trout. On the other hand, our results from this condition show a strong mortality 375
during hatching of rainbow trout. Regarding the literature, our results are comparable to those 376
found by other authors. McKim et al., (1978) demonstrated an almost complete embryo 377
mortality on rainbow trout when exposed to 37 µg/L Cu. Compared to other species, rainbow 378
trout showed greater sensitivity to Cu. For example, for a complete embryo mortality of brook 379
trout (Salvelinus fontinalis), lake trout (Salvelinus namaycush) and herring (Coregonus artedi) 380
about 555 µg/L of Cu were needed (McKim et al., 1978). Vardy et al. (2013) determined that 381
the LC50 at 96 h for yolk-sac stages of white sturgeon (Acipenser transmontanus), rainbow 382
trout and fathead minnows (Pimephales promelas) was 22, 40 and 102 µg/L of Cu respectively. 383
It was also observed that later larval stages of white sturgeon and rainbow trout were even 384
more sensitive to the effects of Cu than yolk sac stages (9 and 22 µg/L of Cu respectively). 385
Another study was performed on two different stages of rainbow trout, embryo and swim-up 386
stages, where lethal responses to Cu were observed from 22 µg/L for both stages after a sub-387
chronic exposure (Besser et al., 2005). Cu lethality not only depends on the sensitivity of the 388
fish species and stage, but also on the water chemistry parameters such as pH, concentration 389
of DOM (dissolved organic manner), and hardness (Brix et al., 2017; Crémazy et al., 2017). 390
Crémazy et al. (2017) observed that tolerance of juvenile rainbow trout to Cu was augmented 391
when pH, hardness and concentration of DOM were increased. 392
Mortality of half-hatched embryos exposed to 20 µg/L of Cu was significant during hatching 393
time; hence, the hatchability was significantly reduced compared to the control group. Hatching 394
can be a very critical step for fishes. Throughout the embryonic stage, the chorion offers 395
protection to embryos in a contaminated environment. However, during hatching this protection 396
is no longer present and the larvae are in direct contact with the contaminated medium (Arukwe 397
et al., 1997). One hypothesis is that copper may have an inhibitory effect on the activity of the 398
chorionase enzyme, which degrades the inner area of the chorion to facilitate the hatching by 399
mechanical and osmotic process (Johnson et al., 2007; Jezierska et al., 2009; Barjhoux et al., 400
2012). 401
At the end of exposure, control larvae had accumulated 5.66 ± 0.13 µg/g Cu (d.w.). According 402
to Shearer (1984), Cu accumulation in unexposed larvae of rainbow trout can vary between 2 403
and 7 µg/g Cu d.w. Results of Cu accumulation on unexposed larvae from Shearer (1984) and 404
Hansen et al. (2002) are comparable to our results. Marr et al. (1996) revealed that swim-up 405
fry rainbow trout exposed to 9 µg/L Cu accumulated 9.89 µg/g Cu after 20 days exposure and 406
continue to accumulate up to 17.91 µg/g after 60 days exposure. This accumulation is higher 407
than that obtained in our study after 3-weeks of exposure at 20 µg/L Cu. Several authors have 408
suggested that copper accumulation is regulated by the depuration and the slow exchange 409
capacity of metals with the surrounding medium (Carbonell and Tarazona, 1994; Marr et al., 410
1996). Despite the lethal effects observed, no significant changes on larvae biometry was 411
reported at the end of exposure to 20 µg/L Cu.A decrease on total size of larvae was expected, 412
since the process of metabolism and homeostasis consume energy and the growing rate of 413
fish may be affected as explained by Marr et al. (1996). Several studies have shown a 414
relationship between the metal accumulation and the total size of larvae when they are 415
exposed to metals (Guo et al., 2016; Marr et al., 1996). However, our results seem to be 416
consistent with the low Cu accumulation in larvae exposed to this condition. Regarding Vardy 417
et al (2013) results about the differences in tolerance according to the larval stage, we might 418
presume that the lack of Cu accumulation in our larvae is probably link to the fact that, at the 419
end of the 3-weeks Cu exposure, our larvae were still absorbing their yolk-sac and probably 420
just starting to change to exogenous feeding. Swim-up rainbow trout larvae used in Marr et al. 421
(1996) were fed and were more active leading to a larger exposure to Cu since more water is 422
pumped through the gills. Since our larvae were not fed, there was no contamination or Cu 423
accumulation by trophic way. 424
For larvae in control conditions, the most commonly observed malformations were edema, 425
vertebral abnormalities and craniofacial anomalies. These kinds of malformations in control 426
condition have already been noticed by several authors (Barjhoux et al., 2012; Jezierska et al., 427
2009; Witeska et al., 2010), and can be attributed to parental factors or laboratory culture 428
conditions. In this study, exposure to 2 and 20 µg/L Cu showed a significant increase on 429
malformed larvae compared to control larvae. Vertebral abnormalities (kyphosis, lordosis, 430
scoliosis and C-shape form) were the most recorded among all observed deformities. In the 431
literature, vertebral deformations are also the most observed malformations (Barjhoux et al., 432
2012; Jezierska et al., 2009; Witeska et al., 2010). For instance, 80% of malformations 433
recorded on barbel larvae (Barbus barbus), after exposure to different concentrations of copper 434
and lead were vertebral abnormalities (Ługowska and Kubik, 2011). Japanese medaka larvae 435
(Oryzias latipes) showed 35 and 59 % of spinal deformities following an embryonic exposure 436
to copper and cadmium spiked-sediment (Barjhoux et al., 2012). These defects can be caused 437
by disturbances induced by metal exposure that may occur at early stages of development or 438
difficulties encountered during a laborious hatching (Jezierska et al., 2009). 439
One aim of this work was to study the impact of copper on swimming behavior of larvae. 440
Exposed larvae covered similar distances as control larvae and no significant difference was 441
observed on travelled distance. The study of Haverroth et al. (2015) showed significant 442
reduction on total distance traveled and restricted mobility on zebrafish (Danio rerio) exposed 443
to 6 µg/L Cu after 24 hours. This can suggest that locomotor patterns were weakened 444
(Haverroth et al., 2015). Atchinson et al. (1980) described the different ways by which metals 445
can alter the locomotion on fish, either by the influence on the attraction or the evasion to a 446
contaminated area, the impaired sensory perception on hyper or hypoactivity, or reducing the 447
swimming performance. 448
The comet assay did not reveal any significant induction of DNA damage promoted by Cu 449
exposure. However, several studies have reported DNA damage upon exposure to Cu or other 450
metals (Barjhoux et al., 2012; Bopp et al., 2008; Canalejo et al., 2016; Oss et al., 2013; Santos 451
et al., 2010). Barjhoux et al. (2012) demonstrated the genotoxic potential of Cu and Cd on 452
Japanese medaka larvae after embryonic exposure to environmental sediments from
453
contaminated sites of the Lot-Garonne-Gironde continuum. Oss et al. (2013) observed an 454
increase of micronuclei levels after 30-days exposure to environmental concentrations of Cu 455
(0, 25, 50 µg/L) on juvenile fat snook (Centropomus parallelus), and these differences did not 456
change after 30-days of recovery. In one study, a significant increase of micronuclei levels was 457
also observed on European seabass (Dicentrarchus labrax) exposed to Cu (0.01-1 mg/L) for 458
96 h (Canalejo et al., 2016). However, at 24 h exposure, differences were only observed on 459
fish exposed to the strongest Cu concentration (1 mg/L). Canalejo et al. (2016) also observed 460
that micronuclei frequency was even more important for fish exposed to Cu than those exposed 461
to As or Pb at the same concentrations. Environmental concentrations of Cu (3.2 to 128 µg/L) 462
induced DNA strand breaks in a concentration-dependent manner in blood cells of mature 463
male stickleback after exposure for 4-days (Santos et al., 2010). Oss et al. (2013) observed 464
an increase of micronuclei levels after 30-days exposure to environmental concentrations of 465
Cu (0, 25, 50 µg/L) on juvenile fat snook (Centropomus parallelus), and these differences did 466
not change after 30-days of recovery. In our study comet assays were performed after 3-weeks 467
exposure which could allow DNA repair system activation and efficient DNA damage repair. 468
However, this is not in accordance to Oss et al. (2013) which did not observed recovery of 469
micronuclei. On the other hand, we found an increase of very damaged cells counted as 470
“hedgehog” in the group of 20 µg/L Cu. An increase of these cells may be explained by the 471
generation of DNA strand breaks through the production of reactive oxygen species by Cu. 472
These “hedgehog cells” were currently considered as apoptotic or necrotic cells (Barjhoux et 473
al., 2012). However, some studies have evidenced that these hedgehog cells could be repaired 474
and should not be considered as apoptotic cells (Lorenzo et al., 2013; Meintières et al., 2003). 475
To determine the real nature of these cells, other analytical techniques would be required such 476
as flow cytometry. In our study case, an increase of these cells may be explained by the 477
generation of DNA strand breaks through the production of reactive oxygen species by Cu. To 478
confirm this hypothesis, it would be necessary to evaluate ROS production in cells and/or to 479
determine the real nature of these cells by flow cytometry. 480
One way Cu exerts its toxicity is by the formation of reactive oxygen species (ROS), which at 481
important levels can damage the cell through lipid peroxidation, protein denaturation and DNA 482
damage (Romeó et al., 2000; Sevcikova et al., 2011; Vutukuru et al., 2006). Catalase (cat) 483
and superoxide dismutase (sod) are two of the enzymes that protect cells from the oxidative 484
damage caused by ROS. Sod catalyzes the dismutation of the superoxide anion radical into 485
oxygen and hydrogen peroxide, which could be further decomposed by the cat into water and 486
oxygen. In our study, after a sub-chronic exposure to Cu, RT-PCR results for cat expression 487
did not reveal any significant modulation on rainbow trout larvae. Woo et al. (2009) observed 488
an important induction of cat gene in liver when Javanese medaka (Oryzias javanicus) was 489
exposed to different concentrations of Cu, Cd, and Zn for 48 h. In the study of Casanova et al. 490
(2013) cat expression on tambaqui fish liver increased after 1h of exposure to copper and 491
decreased to basal levels at 3 h of exposure. The expression level of cytoplasmic sod was 492
decreased on larvae exposed to 2 µg/L of Cu when it was compared to control group. No 493
significant induction of sod expression was observed on liver of Javanese medaka (Woo et al., 494
2009) and zebrafish (Craig et al., 2007) after exposure to Cu. However, Craig et al. (2007) 495
stated an important induction on sod and cat genes expression on liver when zebrafish was 496
under protective treatment of 10 mM Na+ plus Cu. Activation and deactivation of the antioxidant 497
defense system are determined by the duration and the intensity of the stress applied to the 498
organism (Casanova et al., 2013). 499
Larvae exposed to copper conditions exhibited a significant repression of genes involved in 500
detoxification (gst, mt1 and mt2) and in cell cycle arrest and apoptosis (p53 and bax). 501
Regarding detoxification genes, it was surprising since, after 21 days of Cu exposure, it was 502
expected an induction, in particular of those genes encoding the metallothioneins (mt1 and 503
mt2). Metallothionein (MTs) proteins have the capacity to bind xenobiotic heavy metals through
504
their thiol groups providing protection against metal toxicity and oxidative stress. Indeed, 505
previous studies have demonstrated an induction of mt1 and mt2 genes when exposing fish to 506
metals including Cu (Gonzalez et al., 2006; Olsson et al., 1989; Sheader et al., 2006; Woo et 507
al., 2006). The study of Doering et al., (2015) also observed a down-regulation response of mt 508
on liver explants from white sturgeon exposed for 24 h to Cu. Glutathione-s-transferase (gst) 509
has an important role in detoxification of xenobiotic compounds, catalyzing the conjugation of 510
reduced glutathione (GSH) to a variety of endogenous and exogenous electrophilic functional 511
groups. Induction of gst gene expression has been reported in Javanese medaka liver after 512
being exposed to different heavy metals (Cu, Ag, Cd, Ni, and Cr) and in European flounder 513
(Platichthys flesus) liver exposed to Cd after 1 and 3 days of exposure (Sheader et al., 2006; 514
Woo et al., 2009). However, we studied gene expression in whole trout larvae and not in a 515
specific fish organ like mostly previous studies refer. Gene repressions of mt1, mt2 and gst 516
could be explained by different hypotheses. The first one, it is the high sensitivity that rainbow 517
trout larvae have to Cu could lead to a significant repression of these genes after 3-weeks 518
exposure at these concentrations of Cu. Certain studies had already observed the differential 519
regulation of mt gene expression in fish exposed to metals like Cu and Cd (Minghetti et al., 520
2008; Tiwari et al., 2010). Differential expression of mt gene was observed in intestine, gill, 521
kidney and liver of sea bream (Sparus aurata) after exposure to dietary (0.3-130 mg/kg) or 522
waterborne (300 µg/L) copper for 30 days (Minghetti et al., 2008). Tiwari et al. (2010) studied 523
the kinetics of mt expression on freshwater murrel (Channa punctata) after exposure to 524
3.74 mg/L of Cd indicating that the expression varied according to the time of exposure. At this 525
study, Tiwari et al. (2010) observed induction of mt expression on liver and repressions on 526
kidney and gill within the first 8 h of exposure, and induction on kidney and repressions of mt 527
expression on liver and gill after 14 days of exposure. Both studies revealed that mt expression 528
was tissue specific. Besides, rainbow trout larvae could also be more sensitive during the 529
transition from endogenous yolk-sac reserve to the exogenous feeding as hypothesized by 530
Vardy et al. (2013). Indeed, Vardy et al. (2013) found that later larval life stages of white 531
sturgeon and rainbow trout were more sensitive to Cu than at yolk-sac stage. In our study, at 532
the end of these 3-weeks of Cu exposure, rainbow trout larvae were probably starting to turn 533
to exogenous feeding, and since their biological activity was increased more water passed 534
through the gills increasing their exposure to Cu (Vardy et al., 2013). Another hypothesis could 535
be that larvae may have implemented other mechanisms of detoxification. Indeed, other 536
proteins like ABC transporters have been previously described to be efficient for trace metal 537
detoxification (Gonzalez et al, 2006). 538
Cell cycle arrest is one of the principal functions of p53 when it recognizes DNA damage 539
(Verhaegh et al., 1997). Having a defective p53 gene could lead to tumorigenesis and cancer. 540
In our study, transcription of p53 was repressed in both Cu conditions. According to several 541
studies (Verhaegh et al., 1997; Sandrini et al., 2009) p53 gene expression could be regulated 542
by the activation of p53 protein. Therefore, a possible inactivation of p53 protein, after Cu 543
exposure, could lead to the inactivation of p53 gene. Additionally, the study of Verhaegh et al. 544
(1997) reported the inactivation of p53 protein after direct interaction with copper on human 545
cell line. Regarding the expression of bax gene, only a slight non-significant repression (p= 546
0.0656) was observed in larvae exposed to 20 µg/L of Cu. Interestingly, Sandrini et al. (2009) 547
observed that bax gene was induced and p53 gene was repressed on zebrafish liver cell line 548
after 24 h of exposure to Cu. Concerning the DNA repair-related genes ogg1 and rad51, we 549
did not see any significant modulation. But since we did not observe genotoxicity on blood cells 550
with the comet assay, a possible explanation is that DNA strand breaks may have been 551
repaired prior the comet analysis at 21 days of Cu exposure. 552
Malondialdehyde (MDA), measured as TBARS (thiobarbituic acid reactive substances), is one 553
of the end-products of lipid peroxidation and it is a biomarker of oxidative stress. ROS degrade 554
polyunsaturated lipids forming MDA, which appears to be potentially mutagenic since it reacts 555
with deoxyadenosine and deoxyguanosine, arising DNA adducts (Janero, 1990). In our study, 556
both Cu concentrations did not increase MDA levels in larvae. However, several authors have 557
reported the effects of high concentrations of metals and other xenobiotics on lipid peroxidation 558
in aquatic organisms (Baker et al., 1998; Doyotte et al., 1997; Radi and Matkovics, 1988; 559
Romeó et al., 2000; Thomas and Wofford, 1993; Vutukuru et al., 2006). For example, Vutukuru 560
et al. (2006) showed an increase of lipid peroxidation in the viscera of Esomus danricus 561
exposed to 5.5 mg/L of Cu. Baker et al. (1998) fed juvenile grey mullet (Chelon labrosus) with 562
a high-Cu diet for 4 weeks and found a rise of 3-fold in hepatic MDA. Pandey et al., (2001) 563
observed that Channa punctatus exposed to 10 mg/L of Cu for 4 weeks did not induced lipid 564
peroxidation in liver, kidney and gill. Interestingly, Cu showed to have a protective role on lipid 565
peroxidation in liver when fish were exposed to endosulfan for 24 h (Pandey et al., 2001). 566
Regarding the carbonyl protein content, non-significant increase was observed on larvae after 567
3 weeks of copper exposure. Protein carbonyl content is one of the most used biomarker of 568
protein oxidation (Stadtman and Berlett, 1998) because of its irreversible alteration. Craig et 569
al. (2007) observed an induction of protein carbonyl levels in liver and gills after 48 h of 570
exposure to 15 µg/L of Cu on zebrafish. Besides, Craig et al. (2007) also remarked the 571
protective actions of Ca2+ and Na2+ ions in generation of protein carbonyl levels in gills and 572
liver when they were added during Cu-treatment. Ransberry et al., (2015) alluded tissue-573
specific responses, since exposure of 50 and 200 µg/L of Cu on zebrafish induced protein 574
carbonyls in intestines, but not in the gills and livers. 575
Cu is known to cause oxidative damage in lipids and proteins, with a potential to induce 576
genotoxic effects. However, in our study no significant alterations were observed on lipid 577
peroxidation, protein contents and DNA damage. We could hypothesize that the 578
concentrations of Cu used in this study were not enough to cause oxidative alteration in lipid, 579
protein and DNA of rainbow trout. 580
581
5. Conclusion 582
Copper is an essential trace element important for the metabolism of the body. However, at 583
high concentrations it can interfere with certain processes such as protein synthesis and 584
cellular damage. This study provides an extensive evaluation of Cu impact or early 585
developmental stages of rainbow trout that includes phenotypic, behavioral, genetics and 586
biochemical endpoints. Results revealed sub-lethal effects of copper on development mainly 587
on embryos exposed to the higher copper concentration. Defects included increase of half-588
hatched embryos, spinal deformities, genotoxicity and deregulation of genes involved in 589
detoxification and cell cycle arrest. Mortality was higher at hatching but larvae appeared to 590
adapt to the contaminated condition. However, alteration on gene expression, primarily those 591
involved in detoxification (gst, mt1 and mt2) could compromise the survival of this species 592
under natural conditions, since environmentally realistic concentration of copper were used in 593 this study. 594 595 Acknowledge 596
This work was supported by grants from SENACYT (Secretaría Nacional de Ciencia y 597
Tecnología e Innovación) as a part of a PhD program. We thank SFERE (Société Française 598
d’Exportation des Ressources Educatives) for their collaboration. We also want to thank 599
Laurent Labbé et Lionel Goardon (PEIMA, Sizun) for supplying rainbow trout embryos and for 600
all the recommendations that they have given us. Authors would like to thank James Emery 601
for providing English proofreading services. This work was part of the LABEX COTE cluster of 602
excellence “Continental to Coastal Ecosystems: evolution, adaptability and governance”. 603
References 605
Arukwe, A., Knudsen, F.R., Goksyr, A., 1997. Fish Zona Radiata (Eggshell) Protein: A 606
Sensitive Biomarker for Environmental Estrogens. Environ. Health Perspect. 105. 607
Atchinson, G.J., Henry, M.G., Sandheinrich, M.B., 1980. Effects of metals on fish behavior: a 608
review. Environ. Biol. fishes 18, 11–25. 609
Augustyniak, E., Adam, A., Wojdyla, K., Rogowska-Wrzesinska, A., Willetts, R., Korkmaz, A., 610
Atalay, M., Weber, D., Grune, T., Borsa, C., Gradinaru, D., Chand Bollineni, R., 611
Fedorova, M., Griffiths, H.R., 2015. Validation of protein carbonyl measurement: A multi-612
centre study. Redox Biol. 4, 149–157. https://doi.org/10.1016/j.redox.2014.12.014 613
Babcsányi, I., Imfeld, G., Granet, M., Chabaux, F., 2014. Copper stable isotopes to trace 614
copper behavior in wetland systems. Environ. Sci. Technol. 48, 5520–5529. 615
https://doi.org/10.1021/es405688v 616
Baker, R.T.M.., Handy, R.D.., Davies, S.J.., Snook, J.C.., 1998. Chronic dietary exposure to 617
copper affects growth, tissue lipid peroxidation, and metal composition of the grey 618
mullet, Chelon labrosus. Mar. Environ. Res. 45, 357–365. https://doi.org/10.1016/s0141-619
1136(98)00098-1 620
Barillet, S., Buet, A., Adam, C., Devaux, A., 2005. Does uranium exposure induce 621
genotoxicity in the teleostean Danio rerio? First experimental results. Radioprotection 622
40, 175–181. https://doi.org/10.1051/radiopro:2005s1-028 623
Barjhoux, I., Baudrimont, M., Morin, B., Landi, L., Gonzalez, P., Cachot, J., 2012. Effects of 624
copper and cadmium spiked-sediments on embryonic development of Japanese 625
medaka (Oryzias latipes). Ecotoxicol. Environ. Saf. 79, 272–282. 626
https://doi.org/10.1016/j.ecoenv.2012.01.011 627
Besser, J.M., Wang, N., Dwyer, F.J., Mayer, F.L., Ingersoll, C.G., 2005. Assessing 628
contaminant sensitivity of endangered and threatened aquatic species: Part II. Chronic 629
toxicity of copper and pentachlorophenol to two endangered species and two surrogate 630
species. Arch. Environ. Contam. Toxicol. 48, 155–165. https://doi.org/10.1007/s00244-631
003-0039-z 632
Bony, S., Gillet, C., Bouchez, a., Margoum, C., Devaux, a., 2008. Genotoxic pressure of 633
vineyard pesticides in fish: Field and mesocosm surveys. Aquat. Toxicol. 89, 197–203. 634
https://doi.org/10.1016/j.aquatox.2008.06.017 635
Bopp, S.K., Abicht, H.K., Knauer, K., 2008. Copper-induced oxidative stress in rainbow trout 636
gill cells. Aquat. Toxicol. 86, 197–204. https://doi.org/10.1016/j.aquatox.2007.10.014 637
Boukadida, K., Cachot, J., Clérandeaux, C., Gourves, P.Y., Banni, M., 2017. Early and 638
efficient induction of antioxidant defense system in Mytilus galloprovincialis embryos 639
exposed to metals and heat stress. Ecotoxicol. Environ. Saf. 138, 105–112. 640
https://doi.org/10.1016/j.ecoenv.2016.12.021 641
Brix, K. V., DeForest, D.K., Tear, L., Grosell, M., Adams, W.J., 2017. Use of Multiple Linear 642
Regression Models for Setting Water Quality Criteria for Copper: A Complementary 643
Approach to the Biotic Ligand Model. Environ. Sci. Technol. 51, 5182–5192. 644
https://doi.org/10.1021/acs.est.6b05533 645
Buege, J.A., Aust, S.D., 1978. Microsomal Lipid Peroxidation. Methods Enzymol. 52, 302– 646
310. https://doi.org/10.1016/S0076-6879(78)52032-6 647
Canalejo, A., Diaz-de-Alba, M., Granado-Castro, M.D., Cordoba, F., Espada-Bellido, E., 648
Galindo-Riaño, M.D., Torronteras, R., 2016. Early genotoxic response and accumulation 649
induced by waterborne copper, lead, and arsenic in European seabass, Dicentrarchus 650
labrax. Environ. Sci. Pollut. Res. 23, 3256–3266. https://doi.org/10.1007/s11356-015-651
5435-1 652
Carbonell, G., Tarazona, J. V., 1994. Toxicokinetics of copper in rainbow trout 653
(Oncorhynchus mykiss). Aquat. Toxicol. 29, 213–221. 654
Casanova, F.M., Honda, R.T., Ferreira-nozawa, M.S., 2013. Effects of Copper and Cadmium 655
Exposure on mRNA Expression of Catalase, Glutamine Synthetase, Cytochrome P450 656
and Heat Shock Protein 70 in Tambaqui Fish (Colossoma Macropomum). Gene Expr. to 657
Genet. Genomics 1. https://doi.org/10.4137/GGG.S10716 658
Claisse, D., Alzieu, C., 1993. Copper contamination as a result of antifouling paint 659
regulations? Mar. Pollut. Bull. 26, 395–397. https://doi.org/10.1016/0025-660
326X(93)90188-P 661
Craig, P.M., Wood, C.M., McClelland, G.B., 2007. Oxidative stress response and gene 662
expression with acute copper exposure in zebrafish (Danio rerio) 293, R1882-1892. 663
https://doi.org/10.1152/ajpregu.00383.2007. 664
Crémazy, A., Wood, C.M., Ng, T.Y.T., Smith, D.S., Chowdhury, M.J., 2017. Experimentally 665
derived acute and chronic copper Biotic Ligand Models for rainbow trout. Aquat. Toxicol. 666
192, 224–240. https://doi.org/10.1016/j.aquatox.2017.07.013 667
Davis, A.P., Shokouhian, M., Ni, S., 2001. Loading estimates of lead , copper , cadmium , 668
and zinc in urban runo € from speci ® c sources. Chemosphere 44, 997–1009. 669
De Boeck, G., Meeus, W., Coen, W. De, Blust, R., 2004. Tissue-specific Cu bioaccumulation 670
patterns and differences in sensitivity to waterborne Cu in three freshwater fish: 671
Rainbow trout (Oncorhynchus mykiss), common carp (Cyprinus carpio), and gibel carp 672
(Carassius auratus gibelio). Aquat. Toxicol. 70, 179–188. 673
https://doi.org/10.1016/j.aquatox.2004.07.001 674
Devez, A., Gomez, E., Gilbin, R., Elbaz-Poulichet, F., Persin, F., Andrieux, P., Casellas, C., 675
2005. Assessment of copper bioavailability and toxicity in vineyard runoff waters by 676
DPASV and algal bioassay. Sci. Total Environ. 348, 82–92. 677
https://doi.org/10.1016/j.scitotenv.2005.01.004 678
Devier, M.-H., Augagneur, S., Budzinski, H., Le Menach, K., Mora, P., Narbonne, J.-F., 679
Garrigues, P., 2005. One-year monitoring survey of organic compounds (PAHs, PCBs, 680
TBT), heavy metals and biomarkers in blue mussels from the Arcachon Bay, France. J. 681
Environ. Monit. 7, 224–240. https://doi.org/10.1039/b409577d 682
Doering, J.A., Beitel, S.C., Eisner, B.K., Heide, T., Hollert, H., Giesy, J.P., Hecker, M., 683
Wiseman, S.B., 2015. Identification and response to metals of metallothionein in two 684
ancient fishes: White sturgeon (Acipenser transmontanus) and lake sturgeon (Acipenser 685
fulvescens). Comp. Biochem. Physiol. Part - C Toxicol. Pharmacol. 171, 41–48. 686
https://doi.org/10.1016/j.cbpc.2015.03.002 687
Doyotte, A., Cossu, C., Jacquin, M.C., Babut, M., Vasseur, P., 1997. Antioxidant enzymes, 688
glutathione and lipid peroxidation as relevant biomarkers of experimental or field 689
exposure in the gills and the digestive gland of the freshwater bivalve Unio tumidus. 690
Aquat. Toxicol. 39, 93–110. https://doi.org/10.1016/S0166-445X(97)00024-6 691
Eaton, J.G., McKim, J.M., Holcombe, G.W., 1978. Metal toxicity to embryos and larvae of 692
eight species of freshwater fish-II: copper. Bull. Environ. Contam. Toxicol. 19, 608–616. 693
https://doi.org/10.1007/BF01685847 694
Eisler, R., 1998. Copper hazards to fish, wildlife, and invertebrates: a synoptic review, 695
Biological Science Report. https://doi.org/10.5962/bhl.title.11357 696
El-Fiky, N.K., 2001. Toxic and teratogenic effects of copper sulphate on the developing 697
embryos and larvae of silver carp, 261, 227–261. 698
El Azzi, D., Viers, J., Guiresse, M., Probst, A., Aubert, D., Caparros, J., Charles, F., Guizien, 699
K., Probst, J.L., 2013. Origin and fate of copper in a small Mediterranean vineyard 700
catchment: New insights from combined chemical extraction and δ65Cu isotopic 701
composition. Sci. Total Environ. 463–464, 91–101. 702
https://doi.org/10.1016/j.scitotenv.2013.05.058 703
Farag, A.M., Nimick, D.A., Kimball, B.A., Church, S.E., Harper, D.D., Brumbaugh, W.G., 704
2007. Concentrations of metals in water, sediment, biofilm, benthic macroinvertebrates, 705
and fish in the boulder river watershed, Montana, and the role of colloids in metal 706
uptake. Arch. Environ. Contam. Toxicol. 52, 397–409. https://doi.org/10.1007/s00244-707
005-0021-z 708
Flemming, C., Trevors, J., 1989. Copper toxicity and chemistry in the environment: a review 709
143–158. 710
Gamain, P., Gonzalez, P., Cachot, J., Pardon, P., Tapie, N., Gourves, P.Y., Budzinski, H., 711
Morin, B., 2016. Combined effects of pollutants and salinity on embryo-larval 712
development of the Pacific oyster, Crassostrea gigas. Mar. Environ. Res. 113, 31–38. 713
https://doi.org/10.1016/j.marenvres.2015.11.002 714
Gonzalez, P., Baudrimont, M., Boudou, A., Bourdineaud, J.P., 2006. Comparative effects of 715
direct cadmium contamination on gene expression in gills, liver, skeletal muscles and 716
brain of the zebrafish (Danio rerio). BioMetals 19, 225–235. 717
https://doi.org/10.1007/s10534-005-5670-x 718
Guo, Z., Zhang, W., Du, S., Green, I., Tan, Q., Zhang, L., 2016. Developmental patterns of 719
copper bioaccumulation in a marine fish model Oryzias melastigma. Aquat. Toxicol. 720
170, 216–222. https://doi.org/10.1016/j.aquatox.2015.11.026 721
Hansen, J.A., Lipton, J., Welsh, P.G., Morris, J., Cacela, D., Suedkamp, M.J., 2002. 722
Relationship between exposure duration, tissue residues, growth, and mortality in 723
rainbow trout (Oncorhynchus mykiss) juveniles sub-chronically exposed to copper. 724
Aquat. Toxicol. 58, 175–188. https://doi.org/10.1016/S0166-445X(01)00234-X 725
Haverroth, G.M.B., Welang, C., Mocelin, R.N., Postay, D., Bertoncello, K.T., Franscescon, F., 726
Rosemberg, D.B., Dal Magro, J., Dalla Corte, C.L., 2015. Copper acutely impairs 727
behavioral function and muscle acetylcholinesterase activity in zebrafish (Danio rerio). 728
Ecotoxicol. Environ. Saf. 122, 440–447. https://doi.org/10.1016/j.ecoenv.2015.09.012 729
Hutchinson, T.H., Solbé, J., Kloepper-Sams, P.J., 1998. Analysis of the ECETOC aquatic 730
toxicity (EAT) database III - Comparative toxicity of chemical substances to different life 731
stages of aquatic organisms 36, 129–142. 732
Janero, D.R., 1990. Malondialdehyde and Thiobarbituric Acid-Reactivity as Diagnostic 733
Indices of Lipid Peroxidation and Peroxidative Tissue Injury. Free Radic. Biol. Med. 9, 734
515–540. https://doi.org/10.1016/0891-5849(90)90131-2 735
Jezierska, B., Ługowska, K., Witeska, M., 2009. The effects of heavy metals on embryonic 736
development of fish (a review). Fish Physiol. Biochem. 35, 625–640. 737
https://doi.org/10.1007/s10695-008-9284-4 738
Johnson, A., Carew, E., Sloman, K. a., 2007. The effects of copper on the morphological and 739
functional development of zebrafish embryos. Aquat. Toxicol. 84, 431–438. 740
https://doi.org/10.1016/j.aquatox.2007.07.003 741
Kamunde, C., Clayton, C., Wood, C.M., 2002. Waterborne vs. dietary copper uptake in 742
rainbow trout and the effects of previous waterborne copper exposure. Am. J. Physiol. - 743
Regul. Integr. Comp. Physiol. 283, R69–R78. 744
https://doi.org/10.1152/ajpregu.00016.2002 745
Kazlauskienë, N., 2002. Long-term effect of copper on sea trout ( Salmo trutta trutta L .) in 746
early ontogenesis. Ekologija 65–68. 747
Komárek, M., Čadková, E., Chrastný, V., Bordas, F., Bollinger, J.-C., 2010. Contamination of 748
vineyard soils with fungicides: A review of environmental and toxicological aspects. 749
Environ. Int. 36, 138–151. https://doi.org/10.1016/j.envint.2009.10.005 750
Kumaravel, T.S., Vilhar, B., Faux, S.P., Jha, A.N., 2009. Comet Assay measurements: a 751
perspective. Cell Biol. Toxicol. 25, 53–64. https://doi.org/10.1007/s10565-007-9043-9 752
Le Bihanic, F., Morin, B., Cousin, X., Le Menach, K., Budzinski, H., Cachot, J., 2014. 753
Developmental toxicity of PAH mixtures in fish early life stages. Part I: adverse effects in 754
rainbow trout. Environ. Sci. Pollut. Res. 21, 13720–13731. 755
https://doi.org/10.1007/s11356-014-2804-0 756
Linde, A.R., Sánchez-Galán, S., Izquierdo, J.I., Arribas, P., Marañón, E., García-Vázquez, 757
E., 1998. Brown Trout as Biomonitor of Heavy Metal Pollution: Effect of Age on the 758
Reliability of the Assessment. Ecotoxicol. Environ. Saf. 40, 120–125. 759
https://doi.org/10.1006/eesa.1998.1652 760
Livak, K.J., Schmittgen, T.D., 2001. Analysis of relative gene expression data using real-time 761
quantitative PCR and the 2-ΔΔCT method. Methods 25, 402–408. 762
https://doi.org/10.1006/meth.2001.1262 763
Lorenzo, Y., Costa, S., Collins, A.R., Azqueta, A., 2013. The comet assay, DNA damage, 764
DNA repair and cytotoxicity: Hedgehogs are not always dead. Mutagenesis 28, 427– 765
432. https://doi.org/10.1093/mutage/get018 766
Lowry, O., Rosebrough, N., Farr, L., Randall, R., 1951. Protein measurement with the folin 767
phenol reagent. Readings 193, 265–275. https://doi.org/10.1016/0304-3894(92)87011-4 768
Ługowska, K., Kubik, J., 2011. Malformations of barbel ( Barbus barbus ) larvae induced by 769
copper and cadmium Deformacje larw brzany ( Barbus barbus ) pod wpływem miedzi i 770
kadmu. Ochr. Środowiska i Zasobów Nat. 170–178. 771
Manzl, C., Enrich, J., Ebner, H., Dallinger, R., Krumschnabel, G., 2004. Copper-induced 772
formation of reactive oxygen species causes cell death and disruption of calcium 773
homeostasis in trout hepatocytes. Toxicology 196, 57–64. 774
https://doi.org/10.1016/j.tox.2003.11.001 775
Marr, J., Lipton, J., Cacela, D., Hansen, J.A., Bergman, H.L., Meyer, J.S., Hogstrand, C., 776
1996. Relationship between copper exposure duration, tissue copper concentration, and 777
rainbow trout growth 36, 17–30. 778
McKim, J.M., Eaton, J.G., Holcombe, G.W., 1978. Metal toxicity to embryos and larvae of 779