HAL Id: hal-01468227
https://hal.sorbonne-universite.fr/hal-01468227
Submitted on 15 Feb 2017
HAL is a multi-disciplinary open access
archive for the deposit and dissemination of sci-entific research documents, whether they are pub-lished or not. The documents may come from teaching and research institutions in France or abroad, or from public or private research centers.
L’archive ouverte pluridisciplinaire HAL, est destinée au dépôt et à la diffusion de documents scientifiques de niveau recherche, publiés ou non, émanant des établissements d’enseignement et de recherche français ou étrangers, des laboratoires publics ou privés.
Distributed under a Creative Commons Attribution| 4.0 International License
3D Functional Ultrasound Imaging of the cerebral visual
system in rodents
Marc Gesnik, Kevin Blaize, Thomas Deffieux, Jean-Luc Gennisson, José-Alain
Sahel, Mathias Fink, Serge Picaud, Mickaël Tanter
To cite this version:
Marc Gesnik, Kevin Blaize, Thomas Deffieux, Jean-Luc Gennisson, José-Alain Sahel, et al.. 3D Functional Ultrasound Imaging of the cerebral visual system in rodents. NeuroImage, Elsevier, 2017, �10.1016/j.neuroimage.2017.01.071�. �hal-01468227�
Author’s Accepted Manuscript
3D Functional Ultrasound Imaging of the cerebral
visual system in rodents
Marc Gesnik, Kevin Blaize, Thomas Deffieux,
Jean-Luc Gennisson, José-Alain Sahel, Mathias
Fink, Serge Picaud, Mickaël Tanter
PII:
S1053-8119(17)30097-6
DOI:
http://dx.doi.org/10.1016/j.neuroimage.2017.01.071
Reference:
YNIMG13775
To appear in:
NeuroImage
Received date: 5 October 2016
Revised date:
27 January 2017
Accepted date: 30 January 2017
Cite this article as: Marc Gesnik, Kevin Blaize, Thomas Deffieux, Jean-Luc
Gennisson, José-Alain Sahel, Mathias Fink, Serge Picaud and Mickaël Tanter,
3D Functional Ultrasound Imaging of the cerebral visual system in rodents,
NeuroImage,
http://dx.doi.org/10.1016/j.neuroimage.2017.01.071
This is a PDF file of an unedited manuscript that has been accepted for
publication. As a service to our customers we are providing this early version of
the manuscript. The manuscript will undergo copyediting, typesetting, and
review of the resulting galley proof before it is published in its final citable form.
Please note that during the production process errors may be discovered which
could affect the content, and all legal disclaimers that apply to the journal pertain.
3D Functional Ultrasound Imaging of the cerebral visual
system in rodents
Marc Gesnik11, Kevin Blaize2+, Thomas Deffieux1, Jean-Luc Gennisson1, José-Alain Sahel2-3-4-5, Mathias Fink1, Serge Picaud22, Mickaël Tanter1*
1Institut Langevin, ESPCI Paris, PSL Research University, CNRS UMR 7587, INSERM U979, 17 rue
Moreau, Paris, France
2Institut de la Vision, Sorbonne Universités UPMC, University of Paris 06, INSERM UMR_S 968, CNRS
UMR 7210, 75012 Paris, France
3Fondation Ophtalmologique Adolphe de Rothschild, 75019 Paris, France
4Centre d'Investigation Clinique 1423, Inserm-Center Hospitalier National d'Ophtalmologie des
Quinze-Vingts, 75571 Paris, France
5Department of Ophthalmology, University of Pittsburgh School of Medicine, Pittsburgh, 15213
Pennsylvania, USA
ABSTRACT
3D functional imaging of the whole brain activity during visual task is a challenging task in rodents due to the complex tri-dimensional shape of involved brain regions and the fine spatial and temporal resolutions required to reveal the visual tract. By coupling functional ultrasound (fUS) imaging with a translational motorized stage and an episodic visual stimulation device, we managed to accurately map and to recover the activity of the visual cortices, the Superior Colliculus (SC) and the Lateral Geniculate Nuclei (LGN) in 3D. Cerebral Blood Volume (CBV) responses during visual stimuli were found to be highly correlated with the visual stimulus time profile in visual cortices (r = 0.6), SC (r = 0.7) and LGN (r = 0.7). These responses were found dependent on flickering frequency and contrast, and optimal stimulus parameters for largest CBV increases were obtained. In particular, increasing the flickering frequency higher than 7 Hz revealed a decrease of visual cortices response while the SC response was preserved. Finally, cross-correlation between CBV signals exhibited significant delays (d = 0.35s +/- 0.1s) between blood volume response in SC and visual cortices in response to our visual stimulus. These results emphasize the interest of fUS imaging as a whole brain neuroimaging modality for brain vision studies in rodent models.
Introduction
1 MG and KB and co-first authors
The ability to process visual information surrounding each individual is one of the most astonishing and complex task each vertebrate can perform. This ability relies on the cerebral visual system. Its complex chain of information processing begins with the gathering of photons on the retina. Visual information travels along the optic nerves, is pre-processed in sub-cortical relays such as the left and right Lateral Geniculate Nuclei (LGN) or the Superior Colliculus (SC) and is finally processed in the Visual Cortex. The so-processed information is then sent to other cerebral areas that will for instance trigger an action or a memorization (Nolte, 2009). This complex and multi-component system has been widely studied using electrophysiology (Adams and Forrester, 1968; Espinoza et al., 1983; Hubel et al., 1962). Nevertheless, due to its three dimensional spatial complexity at varying depths in the brain, to its interactions with other functional regions of the brain and to a variety of dynamic tasks performed along the chain, the full understanding of the visual system remains a challenge.
Although electrophysiology benefits from an excellent sensitivity and gives fundamental information from the direct measurement of the neurons activity, it is mainly restricted to local measurements. Mapping the full visual system activity, is therefore a time-consuming task and remains constrained by a limited number of implantable electrodes per subject. Furthermore, this approach is very invasive when considering deep brain areas like thalamic relays.
Additionally functional Magnetic Resonance Imaging (fMRI), has extensively contributed to understand the visual system through its ability to map the brain activity in 3D (Op de Beeck et al., 2008). Its non-invasiveness and ability to map the brain in 3D makes it a highly suited method for the study of vision in human (Denison et al., 2012; Reitsma et al., 2013; Warnking et al., 2002). However, its spatial and temporal resolution can become a struggle when scaling down the technique to rodents, since it requires always higher magnetic fields, averaging functional maps over several animals (Niranjan et al., 2016; Pawela et al., 2008a, 2008b; Zhou et al., 2012) or contrast agent (Chan et al., 2014) to resolve smaller structures, especially for the study of small sub-cortical structures such as the LGN (Lau et al., 2011a, 2011b) and SC (Chan et al., 2010) or for retinotopic map reconstruction in the rodent visual cortex (Bissig and Berkowitz, 2011, 2009). Moreover, the limited temporal resolution of fMRI makes it difficult to estimate response delays between different brain regions. To answer this drawback in rodents, optical intrinsic imaging becomes a competitive imaging modality and allows to realize accurate measurements at the surface of the cortex (Gias et al., 2005; Kalatsky and Stryker, 2003; Schuett et al., 2002). However, optical imaging is limited by the strong multiple scattering of the optical waves in biological tissues and is restricted to measurements at the superficial layers of the cortex, down to a few micro-meters (Gias et al., 2005). Neither the function of deep layers of the visual cortex nor of the thalamic relays can be imaged this way with a wide field of view.
In the present study, a new technique so-called functional ultrasound (fUS) imaging (Macé et al., 2011) is presented. fUS is a recently developed functional neuroimaging technique based on ultrafast ultrasound imaging (Tanter and Fink, 2014) which has already offered new insights in diagnostic imaging (Tanter et al., 2008) and blood flow imaging (Bercoff et al., 2011; Osmanski et al., 2012; Udesen et al., 2008). Ultrafast ultrasound imaging can capture more than 20,000 frames per second, compared to the usual 50 frames per second in conventional ultrasound scanners. This increase in temporal resolution allows to revisit Power Doppler imaging (Rubin et al., 1994) and results in a high boost (up to 50) of sensitivity to blood flow. Contrary to the Doppler frequency which is dependent on the angle between the ultrasonic beam and the vessel, the integral of the Doppler spectrum (known as Power Doppler) in a pixel is proportional to the number of moving red blood cells within the ultrasonic sample volume (Rubin et al., 1995, 1997; Shung et al., 1976). This proportionality is valid only if backscattering properties do no vary versus time. As long as the haematocrit and shear
rate remain time-invariant during the acquisition time, this assumption was proven to be valid (Cloutier and Qin, 1997). Note that the CBV measurement from Power Doppler is independent of the direction of the flow except when the flow direction becomes almost perpendicular to the ultrasonic beam (between 80° and 90°) as shown in (Mace et al., 2013). Thus measuring CBV with ultrafast ultrasound allows a detection of subtle hemodynamic changes in much smaller vessels compared to conventional Doppler ultrasound.
Similar to other neuroimaging techniques based on the neurovascular coupling such as fMRI (Ogawa and Lee, 1990) with Blood-Oxygen-Level-Dependant (BOLD) and optical intrinsic imaging (Frostig et al., 1990; Grinvald et al., 1986), fUS relies on activity-dependant CBV changes in small blood vessels to detect active neuronal assemblies in vivo (Mace et al., 2013; Shung et al., 1976). Though CBV convey distinct information from BOLD, they both are a manifestation of the neurovascular coupling (Martindale et al., 2003) and their measurements yield indirect information on brain neuronal activity. CBV gives access to the number of red blood cells within the pixel whereas BOLD signal depends on Blood Oxygenation. Similarly to BOLD fMRI fUS was shown to map the brain activity in response to sensory-motors stimuli (Macé et al., 2011) and to odor-evoked stimuli deep in the brain (Osmanski et al., 2014) with an excellent spatiotemporal resolution (100µm in plane and 100ms for a single trial acquisition).
By using fUS imaging and a simple visual stimulation setup we investigated the feasibility of mapping the visual system in the rat brain. Using a motorized translation of the ultrasonic probe to overcome the two dimensional limitation of our field of view and extend it to 3D, we were able to map the activation of the visual cortex and of the SC and LGN along the visual pathway. We leveraged simple changes in the visual stimuli to assess changes in the response intensity or localization in these visual areas. We also measured CBV response delays between the different vision-involved areas.
Materials and methods
Animals, surgical procedures
Adult male Long-Evans rats (Janvier Labs; France) weighting 250 g to 350 g, and aged 7 to 9 weeks were included in this study. They were housed two by cage with free access to food and water and maintained under standard conditions (12/12 h light-darkness cycle, 22 °C). All experiments were conducted in accordance with the European Council Directive (2010/63/EU) and the study was approved by the institutional and regional committees for animal care (Committee Charles Darwin n°5, registration number 5486).
All rats underwent surgical craniotomy before the imaging session. Anaesthesia was induced with 5% isoflurane and followed by intraperitoneal (i.p.) injection of a mixture of ketamine (60 mg/kg, Imalgene 1000®, Merial; France) and medetomidine (0.4 mg/kg, Domitor®, Pfizer, Santé Animal; France). Anaesthesia was maintained by a periodic i.p. dosage using 1/3 of the initial dose every 45 minutes. Buprenorphine was injected subcutaneously (0.05 mg/kg, Buprecare®). Body Temperature was maintained at 37 °C using a heating blanket throughout the experiment. Animals were placed in a stereotaxic apparatus during surgery and imaging. A sagittal skin incision was performed across the posterior part of the head to expose the skull. Parietal bone were removed by drilling rectangular flaps and gently moving the bone away from the dura mater. Thus exposing the cortex over the visual cortex from Bregma -4 to Bregma -7 mm, with a maximal width of 14 mm. For 3D scans more of the bone was removed so that the cortex exposure spans from Bregma +2 to Bregma -8 mm. The
animals were kept under dark conditions from the beginning of the surgery to the stimuli trials. The surgery lasting about an hour, animals can be considered to be dark-adapted.
Stimuli delivery
Visual stimuli were delivered using a 51 x 29 cm², 1920 x 1080 pixels screen (P2314H 23”, Dell), in front of the rat at 8 cm, therefore covering 145° of the visual field in the horizontal dimension and about 122° in the vertical dimension. At 8 cm, we measured a maximum luminance of 8 cd/m² (full white screen) and a minimum luminance of 0.04 cd/m² (full black screen). Stimulation runs consist in episodic presentations of black and white flickering on the screen interleaved with black screen period for rest: A run consisted in 30 s of rest followed by 30 s of flicker repeated 5 times and ended with 30 s of rest for a total duration of 330 s (Figure 1A and B). The stimuli were designed and displayed using Matlab (Psychtoolbox-3, Mathworks, Natick, Massachusetts, USA), which allows a great flexibility in the change of the stimuli parameters. Between stimuli presentation sessions, the rats were kept in a dark environment.
2D fUS acquisition sequence and data analysis
fUS imaging was performed using a linear ultrasound probe (128 elements, 15 MHz, 110 µm pitch and 8 mm elevation focus, Vermon; Tours, France) driven by an ultrafast ultrasound scanner (Aixplorer, Supersonic Imagine; Aix-en-Provence, France). The biophysics, technical procedure and statistical analysis for fUS were fully explained in our previous publications (Mace et al., 2013; Macé et al., 2011; Osmanski et al., 2014).
In summary, the ultrasound sequence works as follow: First, the brain is insonified by using ultrasonic plane wave with a high Pulse Repetition Frequency (PRF) (25 kHz). Second, the backscattered echoes coming from a wide-field view on the transducer array are recorded. Finally, the raw data are beamformed to produce an image in few hundreds of milliseconds.
In order to ensure a high-quality ultrasound image while preserving an ultrafast framerate, we added several plane wave images coherently (with amplitude and phase) from successive transmissions of tilted plane waves (Montaldo et al., 2009). In this study, the plane wave compounding consisted of coherently adding the images of the brain tissue from 11 different tilted plane waves, with angles varying from −10° to 10° and at 2° step in order to compute one high-quality ultrasound image. To sample blood flow changes, we repeated this sequence 200 times with a 500 Hz frame rate (corresponding to a 400 ms acquisition time). To discriminate the blood motion from tissue motion artefacts in these sets of data, we used a recently developed Singular Value Decomposition (SVD) based spatiotemporal clutter filter technique (Demene et al., 2015). Finally one image of Power Doppler intensity is obtained by the incoherent temporal averaging of the blood signal in each pixel. Our ultrafast scanner (6 CPU core unit, 24 GB RAM) requires 0.6 s to beamform the 200 echo-based images, resulting in a final temporal sampling rate of 1 s per power Doppler image. After 5 minutes and 30 seconds of a 5-trials session, we thus obtain 330 images with a dimension of 14.08 mm along the direction (x) and 8 mm in depth (z), with 128 x 78 pixels of 110 x 100 µm² resolution.
As well as in (Macé et al., 2011; Osmanski et al., 2014), for each session, a map of activated pixels was reconstructed by computing the normalized correlation coefficient (r) between the local power Doppler signal obtained from fUS and the temporal pattern of the visual stimulus. Activation was considered significant for a correlation r > 3σ, where σ is the spatial standard deviation of at least 400 correlation values from non-active areas of the correlation map, in agreement with the Paxinos rat brain atlas. . The time course for a given region was calculated by averaging the Power Doppler signal over time for all responding pixels in the activated region (r > 3σ). The intensity of the Power
Doppler was represented as the percentage of change relative to the baseline calculated during the 30 s of rest before each 5-trials session.
3D acquisition protocol
For 3D fUS acquisition sequences, we used a 4 axis motorized stage (three VT-80 Pollux and one DT-80 Pollux, PI Micos; Germany): 3 translations along x, y and z axis and one rotation around z (Figure 1A) that has been previously described in (Demené et al., 2015). The 3D fUS sequence consists in the repetition of the 2D stimulating (Figure 1B) imaging sequence we previously described in each coronal plan spanning from Bregma -3 mm to Bregma -8 mm, with a 0.5 mm step. The thickness of the imaging plane, shaped by the elevation lens of our ultrasonic probe being approximately 500 µm, this is the biggest step we can achieve without missing a potentially activated structure in the brain. Our voxel size is therefore 110 x 500 x 100 µm3. Since we repeat 2D fUS acquisitions in different planes that last 330 s each, with no supplementary time for rest, the overall time of acquisition of a whole volume is about an hour (11 plans from B-3 to B-8 mm times 5 minutes and 30 seconds). We therefore spaced the i.p. injections of anaesthetic from 1 hour instead of 45 minutes.
Figure 1 A. Schematic view of the experimental setup. B. Stimulus pattern for episodic visual stimulation: 30 s of rest are followed with 30 s of flickering of the screen at a frequency in the [0; 10 Hz] range.
Delays measurement
For delay measurement between two signals, the parabolic interpolation of the maximum of correlation of those two signals has been used. This consists in the construction of the unique parabola that passes through the three points around the maximum of correlation to locate its summit. This constitutes an unbiased estimator of the delay between two correlated band-limited signals. Previous reports have shown a typical precision below 5% of the sampling time which is ultimately limited by the SNR of the signals (Carter, 1987; DEJONG et al., 1990; Sandrin et al., 1999; Walker and Trahey, 1994).
Results
The ultrasonic probe was positioned over a coronal plane at Bregma -4.5 mm. That plane presents several known vision-involved structures (Paxinos and Watson, 2007). Those structures are, the visual cortex (V1/V2), the Lateral Geniculate Nucleus (LGN) and the Superior Colliculus (SC) (Figure 2A). While imaging with fUS ultrasonic sequence, we episodically stimulated the full visual receptive field by 3 Hz full screen flickering during stimulation periods. Figure 2B-C present the results of that 330 s 5-trials single imaging session.
After correlation with the stimulus pattern and noise σ-thresholding, we obtained a functional activation map (Figure 2B) that matches very nicely the expected areas. Making the assumption that each cluster of correlated pixels constitutes one of these areas, we extracted and plotted the mean CBV signal over the responding pixels in the visual cortex area (Figure 2C). We can clearly see an increase in CBV correlated to the stimulation periods. A similar increase in CBV during stimulation periods can also be observed in the other vision-involved areas, the LGN and SC (Figure 2C).
Figure 2 : Result of a single 5-trials 330 seconds fUS imaging session of the visual areas in the rat. A. Coronal schematic view of the rat brain at Bregma -4.5 mm with the delimitations of Visual Cortex (V1/V2), Lateral Geniculate Nucleus (LGN) and Superior Colliculus (SC). B. fUS imaging of the vision-induced activity at Bregma -4.5 mm, with superimposition of the correlated pixels (hot scale) over the brain vasculature (grey scale). The precision of the map allows to retrieve the shape of the 3 vision related structures present in that coronal slice. Scale bar = 2 mm. C. Mean CBV signal over responding pixels in the visual cortices (blue, up), SC (red, middle) and LGN (green, bottom) during that single imaging session composed of 5 flickering screen stimulation trials.
Influence of stimulus parameters
After demonstrating the feasibility of using fUS to image vision-involved structures, we tackled the task of finding optimal stimulation parameters in terms of frequency and contrast. The whole screen was used to stimulate the full receptive field and investigate two parameters. First the Flickering frequency: is simply defined by the frequency of the black/white alternation of the screen during the 30 s stimulation periods. A flickering frequency of 0 Hz corresponds to a steady white screen for 30 s. Second the Flickering contrast: is defined by the luminance ratio between the white screen and the black screen during the stimulation period. A flickering contrast of 1 corresponds to the most brilliant white and the darkest black we can get with our set-up. While a contrast of 0 correspond to a constant 50 % grey screen. Only these two parameters of the protocol were modified during the experiment.
For the optimization part, we first evaluated the effect of these parameters on two rats (one for frequency, one for contrast) over the Bregma -5 mm coronal plane. The 5-trials imaging session protocol described above was used. Each session was dedicated to test one different value (e.g. 5 times 30 s of flickering at 5 Hz with a contrast of 1 interleaved with 30 s of black for rest) in a randomized order. Each imaging session was repeated five times. In post-processing, for each session, fUS activation maps were computed and the maximum value of correlation was recovered. To get a good compromise for the whole brain, we choose to recover the maximum of correlation in two different vision-involved areas: the SC region and the visual cortex (both hemispheres). A contrast of 1 is expected to produce the best response. Therefore we first performed the frequency study with a contrast of 1. Figures 3A to C illustrate the evolution of response in the rat brain to a flickering frequency of 0 Hz, 3 Hz and 10 Hz and Figure 3D summarizes this evolution for the different tested frequencies. In the visual cortex, it appeared that the best response is obtained at a 3 Hz flickering frequency with a contrast of 1 while the higher 10 Hz frequency was eliciting a lower response. In SC, the maximum was reached earlier at a 1 Hz frequency and the responses remained stable for higher frequencies up to 10 Hz. The 3 Hz frequency, which represents the peak sensitivity for the cortex, was therefore selected to perform the contrast frequency analysis. In the contrast sensitivity, the maximum was reached at a contrast of 0.5 and remained stable for the subsequent contrast values up to 1 in the two structures, the SC and the cortex (Figure 3E). The flickering frequency investigation protocol was repeated on two other rats and similar curves were obtained (see Supplementary figure 1). Thus, despite individual variations, the flickering frequency seems rather robust and was kept at the value eliciting the maximum responses in the following of the study (3 Hz).The contrast was also kept at 1.
Figure 3 : Evolution of the rat brain response to variation of flickering parameters. A to C: fUS imaging of a rat during a 0 Hz (A), 3 Hz (B) and 10 Hz (C) flickering stimulus. Each activation map is the average of 5 imaging sessions. Scale bar = 2 mm. E and D: Influence of flicker parameters for fUS imaging of vision. Influence of the flickering frequency on rat #1 (D.) and the flickering contrast on rat #2 (E.) on the response amplitude in the SC (dashed red line) and in the visual cortex (solid blue line). The quality of the response is measured via the maximum of correlation on the fUS data map. Each curve is normalized with the maximum value of correlation coefficient obtained in the corresponding brain area. Error bars: standard deviation of the normalized maximum of correlation in the considered area over the 5 trials of each parameter. See Supplementary Figure 1 for the influence of the flickering frequency on rat #3 and #4.
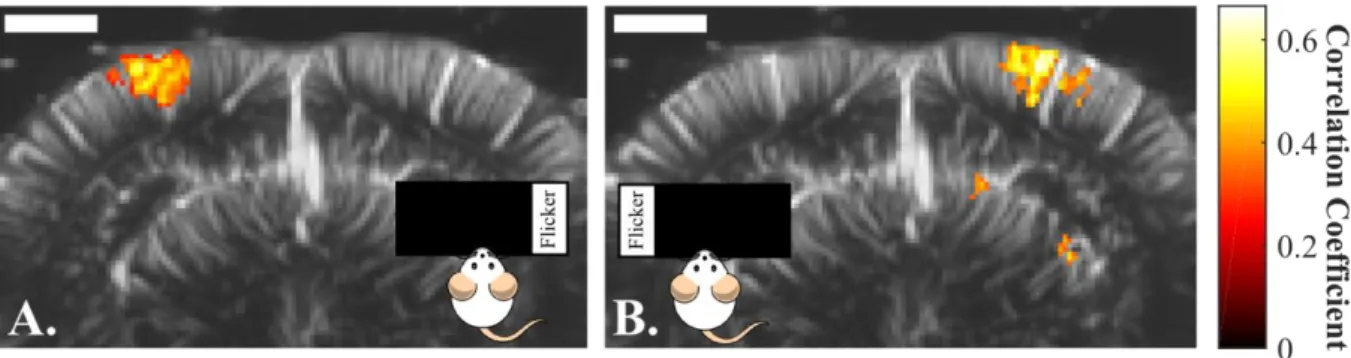
Lateralization of the visual response to simple stimuli
The visual cortex treats information coming from the contralateral visual field, for instance, the left hemisphere treats visual information from the right visual field (Nolte, 2009). This lateralized response can thus serve as an additional confirmation that fUS imaging observations are not mere artefacts but true measurements of visual circuit activities. To address this question the ultrasonic probe was positioned over a coronal slice containing the visual cortex in both hemispheres. The stimulus parameters were fixed at 3 Hz flickering frequency and a contrast of 1. However, instead of stimulating the complete visual field using the whole screen, the screen was divided in 5 column sectors of identical width. In a first 5-trials imaging session, only the extreme-right sector was flickering, whereas in the second session, we shifted the illumination to the extreme-left sector. Figure 4 illustrates the results of those 2 imaging sessions. Each stimulation sector elicits a fUS signal only in the respective contralateral visual cortex. These observations demonstrate the ability of the
fUS imaging set-up to discriminate the projection of spatially distinct stimuli in the brain consistent with the visual processing lateralization.
Figure 4 : Visualization by fUS of the lateralization of the visual response in the visual cortex: A. Activation map after a single 5-trial imaging session, while stimulating only with the extreme right sector of the screen. A CBV increase in the left visual cortex is observed. B Activation map after a single 5-trial imaging session, while stimulating only with the extreme left sector of the screen. A CBV increase in the right visual cortex is observed.. Scale bar = 2 mm.
3D fUS imaging of the visual system
fUS imaging provides a 2D information coming from the imaging plane of the ultrasonic probe. However, the visual cortex and the sub-cortical visual areas are 3D structures that cannot be imaged entirely using a single imaging session. To generate 3D fUS imaging of these structures, several linear scans were performed while moving the probe to successive planes to perform a fUS acquisition at each position.
Following this strategy, we scanned the rat brain from Bregma -8 mm to Bregma -3 mm by 0.5 mm steps. Figure 5 and supplementary video 1 show the functional 3D volumes that can be reconstructed by this imaging strategy. The 3D structures of the visual function are well recovered and the shape of the visual cortex atop the LGN and the SC can easily be identified.
Figure 5 : 3D fUS imaging of brain structures responding to visual stimuli. A. General View of the activated areas, left and right visual cortices (V1/V2), Superior Colliculus (SC) and LGN, which were manually superimposed to a Calabrese rat brain model. B. Sagittal cut at Bregma showing the activated SC. C. Sagittal cut at Bregma +3.7 mm showing both LGN and V1/V2. D. Top view of the brain surface showing V1/V2 activation. E. Transversal cut at 3 mm depth showing the activated SC. F. Transversal cut at 5.4 mm depth showing the activated LGN. Scale bars = 2 mm. Brain mini-maps made using (Bakker et al., 2015; Kjonigsen et al., 2015; Papp et al., 2014; Sergejeva et al., 2015) brain atlas.
Measuring CBV response delays
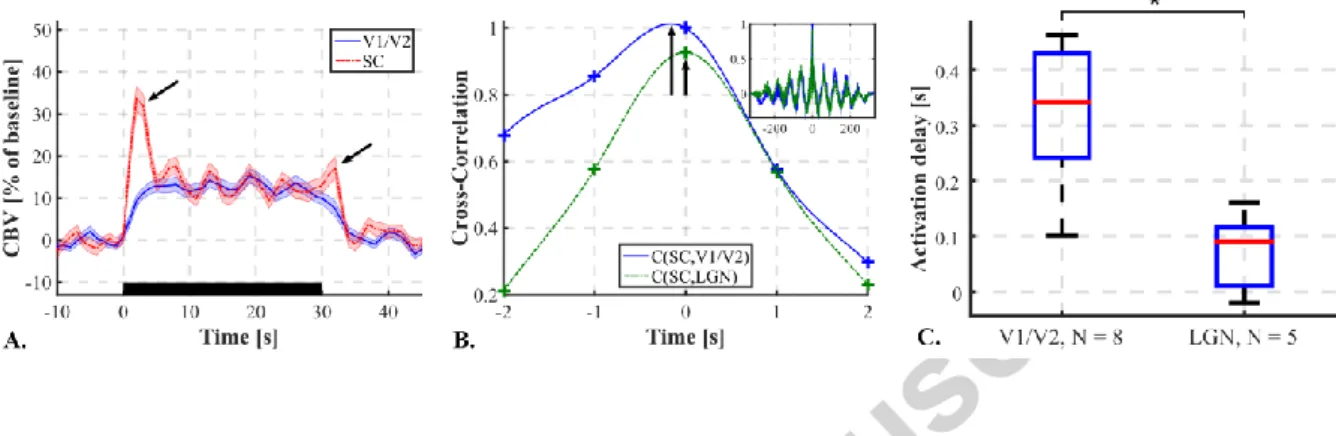
As three areas of the brain are mainly involved here, CBV response delays between those zones were investigated. First, plotting the mean CBV response to N = 30 stimuli in responding pixels in the SC and in the visual cortex (Figure 6A) reveals a difference of shape of the CBV response curve for this two areas. We can, for instance, observe the “on” and “off” peaks in the SC response (Fukuda and Activity, 1978; Van Camp et al., 2006; Wang et al., 2010). Furthermore, the response in the visual cortex seems to be slower.
To go further, on N = 8 rats, we performed the fUS imaging over a plane containing the visual cortex and the SC (Bregma -5.5 mm) and on N = 5 rats we performed the imaging over a plane that contains also the LGN (Bregma -4.5 mm). Stimuli consisted in 3 Hz full field flickering. Then the temporal CBV
response was recovered over responding pixels in the visual cortex, SC and LGN. Within cortices and LGNs the CBV response was averaged over both hemispheres. The CBV in the SC was taken as a reference. Delays between the SC and cortex and between the SC and LGN were measured using a parabolic interpolation of the maximum of cross-correlation between both signals (see example, Figure 6B). However, the “off” peaks in the SC response might lengthen the CBV response with respect to the other areas and therefore distort the delay measurement. Thus the falling edge of all CBV responses were cut beforehand and replaced by the mean CBV value over the following period of rest. On Figure 6C are presented CBV response delays for both couple of regions. It appears that the CBV response happens about 0.35 s earlier in the SC than in the visual cortex (two-tailed t-test, p<0.001). It also seems that the CBV response happens earlier in the SC than in the LGN. The CBV response seems to happen significantly earlier in V1/V2 than in the LGN (two-tailed t-test, p<0.002).
Figure 6 : CBV Response delays between visual areas. A. Average CBV response curves to the stimulus in the visual cortex (solid blue line) and in SC (dashed red line). Error: Standard Error of the Mean. Black rectangle = Stimulus. “On” and “Off” CBV peaks in SC (black arrows). B. Example of Cross-Correlation curves between CBV responses in SC and visual cortex (Solid blue line) and between SC and LGN (dashed green line), zoom around the maximum of cross-correlation. Crosses: experimental data points. Lines: interpolated curves between data points to visualize the delay at maximum of cross-correlation (black arrows) (not used for measurement). Mini-box in up-right corner: Full view of the cross-correlation curves. C. CBV response delays measured between SC and both visual cortices (V1/V2), N = 8 rats, and between SC and both LGNs, N = 5 rats. *p<0.002
Discussion
In the present study, fUS imaging was used on anesthetized rats to perform several basic functional imaging studies related to vision. The high resolution mapping of visual patterns in the whole brain such as lateralized stimuli and flickering stimuli was presented. The best stimulation parameters for imaging of the visual cortex were investigated. A flickering frequency of 3 Hz was found to elicit the highest CBV response in accordance with previous BOLD studies (Bailey et al., 2013; Pawela et al., 2009). We also showed a contrast saturation effect after a 0.5 contrast value also in accordance with the literature (Albrecht and Hamilton, 1982; Lund et al., 1999).
A 3D protocol was developed and tested and has allowed the reconstruction of the main visual structures of the brain in 3D. The anaesthesia was performed in i.p. just before the beginning of the scan. It is then to be expected that the last planes to be acquired may have a different response than the first ones. Therefore an intravenous drip anaesthetic might benefit the measurement of the functional volume. Furthermore, the development of full 3D ultrafast scanners (Provost et al., 2014)
will allow instantaneous acquisitions of the whole brain and remove the need for successive planes acquisitions.
Compared to BOLD fMRI, the fUS technique benefits from a high spatial and temporal resolution at low cost with a portable device. When fMRI needs to average over several animals or to inject contrast agents, fUS allowed us a quicker and simpler retrieval of the visual areas. The main inconvenience of fUS lays in the necessity of a craniotomy to overcome the distortion of the ultrasound waves through the skull and the limitation of the measure in a 2D plane. However it has been shown that fUS can be perform through the skull using microbubbles (Errico et al., 2016). Compared to optical imaging techniques which provides high resolution functional imaging but are limited to the superficial cortical areas, fUS can be used to image the full depth of the brain, including the LGN or the SC in our case.
It has been widely demonstrated through different functional imaging methods (Engel et al., 1997; Espinoza et al., 1992) that the treatment of the visual information is spatialized in the rodent brain. By stimulating the left visual field and the right visual field, we showed that it is possible to study visual spatialization in the brain with fUS. As in (Gias et al., 2005; Schuett et al., 2002), the screen was divided in different sectors and successively used to stimulate the rat visual field by using those different sectors to infer the corresponding activated regions in the brain. Furthermore, the high in-plane resolution of fUS could be leveraged to more finely segregate areas of the brain according to their function. For instance reducing the width of the stimulation sectors on the screen, would yield the detection limit of fUS in term of spatial extend of the responding cerebral areas.
The ability of fUS to measure delays in the CBV response between regions consistent with previous BOLD measurement (Yen et al., 2011) was highlighted, therefore demonstrating its high temporal resolution. However those hemodynamic delays are far larger than the neural delays directly measured in electrophysiology, which are in the [10;100 ms] range (Saul and Feidler, 2002). Thus, the hemodynamic delays we measured here could as well be due to effective delays in the neural response than to different vascular, or neurovascular coupling dynamics (Li and Freeman, 2007; Wibral et al., 2007). Nonetheless, this could be combined with continuously moving bars stimuli that has been shown to produce retinotopic measurements in a much shorter time than by stimulating selectively and successively sectors of the visual field (Kalatsky and Stryker, 2003; M. P. Vanni et al., 2010; Matthieu P. Vanni et al., 2010).
Finally, this study investigated rather simple stimuli and simple responses of the rat brain with simple analysis. However the functional imaging of vision is a very rich field of research. Many subtler stimuli have been designed to stimulate the visual field and investigate the richness of visual information processing in the brain. Furthermore, to date, no side by side comparison between the respective sensitivity of fUS imaging and fMRI was done, but previous fUS papers on whisker or olfactory stimuli have shown that fUS imaging is able to map functional activity for subtle stimuli difficult to assess in fMRI, such as single whisker stimulus. It gives hope that fUS will perform well for these other types of visual stimuli already investigated by fMRI.
The recent demonstration of fUS in awake and freely moving rodents (Sieu et al., 2015) also opens exciting possibilities to study the visual response of the brain in more complex and natural environments and without influence of the anaesthesia.
The association of state of the art visual stimulation techniques with high resolution and sensitivity whole brain functional imaging paves the way to novel original experiments to push our understanding of the vision in the brain.
Conclusion
The fUS imaging technique coupled with a 4 axis motorized stage and a visual stimulation device was shown to accurately detect and 3D map the activation of visual functions in the rat brain. Responses to simple visual flickering were presented. The high sensitivity of fUS imaging enables to record unbiased and repeatable CBV responses even with a small number of stimuli repetition. These experiments emphasize the capability of fUS imaging to become a particularly suitable neuroimaging tool for the fundamental understanding of the cerebral visual system.
Acknowledgements
This work was supported by the European Research Council SYNERGY Grant scheme (HELMHOLTZ, ERC Grant Agreement #610110), Europe and partly supported by the European Union’s Seventh Framework Programme (FP7/2007-2013) / ERC grand agreement no 339244-FUSIMAGINE.
Video legend
"3D fUS imaging of the rat brain structures responding to visual stimuli. Responding areas, left and right visual cortices, Superior Colliculus and LGN, were manually superimposed to a Calabrese rat brain model. Thus allowing 3D visualization in depth in the brain or along different coronal cross-sections."
References
Adams, A.D., Forrester, J.M., 1968. the Projection of the Rat’S Visual Field on the Cerebral Cortex. Q J Exp Physiol Cogn Med Sci 53, 327–336. doi:10.1113/expphysiol.1968.sp001974
Albrecht, D.G., Hamilton, D.B., 1982. Striate cortex of monkey and cat: contrast response function. J. Neurophysiol. 48, 217–237.
Bailey, C.J., Sanganahalli, B.G., Herman, P., Blumenfeld, H., Gjedde, A., Hyder, F., 2013. Analysis of Time and Space Invariance of BOLD Responses in the Rat Visual System. Cereb Cortex 23, 210– 22. doi:10.1093/cercor/bhs008
Bakker, R., Tiesinga, P., K??tter, R., 2015. The Scalable Brain Atlas: Instant Web-Based Access to Public Brain Atlases and Related Content. Neuroinformatics 353–366. doi:10.1007/s12021-014-9258-x
Bercoff, J., Montaldo, G., Loupas, T., Savery, D., M??zi??re, F., Fink, M., Tanter, M., 2011. Ultrafast compound doppler imaging: Providing full blood flow characterization. IEEE Trans. Ultrason. Ferroelectr. Freq. Control 58, 134–147. doi:10.1109/TUFFC.2011.1780
Bissig, D., Berkowitz, B.A., 2011. Same-session functional assessment of rat retina and brain with manganese-enhanced MRI. Neuroimage 58, 749–760. doi:10.1016/j.neuroimage.2011.06.062 Bissig, D., Berkowitz, B.A., 2009. Manganese-enhanced MRI of layer-specific activity in the visual
doi:10.1016/j.neuroimage.2008.10.013
Carter, G.C., 1987. Coherence and time delay estimation. Proc. IEEE 75, 236–255. doi:10.1109/PROC.1987.13723
Chan, K.C., Fan, S.J., Chan, R.W., Cheng, J.S., Zhou, I.Y., Wu, E.X., 2014. In vivo visuotopic brain mapping with manganese-enhanced MRI and resting-state functional connectivity MRI. Neuroimage 90, 235–245. doi:10.1016/j.neuroimage.2013.12.056
Chan, K.C., Xing, K.K., Cheung, M.M., Zhou, I.Y., Wu, E.X., 2010. Functional MRI of postnatal visual development in normal and hypoxic-ischemic-injured superior colliculi. Neuroimage 49, 2013– 2020. doi:10.1016/j.neuroimage.2009.10.069
Cloutier, G., Qin, Z., 1997. Ultrasound backscattering from non-aggregating and aggregating erythrocytes--a review. Biorheology 34, 443–470. doi:10.1016/S0006-355X(98)00026-2 DEJONG, P., ARTS, T., HOEKS, A., RENEMAN, R., 1990. Determination of tissue motion velocity by
correlation interpolation of pulsed ultrasonic echo signals. Ultrason. Imaging 12, 84–98. doi:10.1016/0161-7346(90)90152-N
Demene, C., Deffieux, T., Pernot, M., Osmanski, B.-F., Biran, V., Franqui, S., Correas, J.-M., Cohen, I., Baud, O., Tanter, M., 2015. Spatiotemporal clutter filtering of ultrafast ultrasound data highly increases Doppler and fUltrasound sensitivity. IEEE Trans. Med. Imaging PP, 1.
doi:10.1109/TMI.2015.2428634
Demené, C., Tiran, E., Sieu, L.A., Bergel, A., Gennisson, J.L., Pernot, M., Deffieux, T., Cohen, I., Tanter, M., 2015. 4D microvascular imaging based on ultrafast Doppler tomography. Neuroimage 127, 472–483. doi:10.1016/j.neuroimage.2015.11.014
Denison, R., Vu, a., Feinberg, D., Silver, M., 2012. fMRI of the magnocellular and parvocellular subdivisions of human LGN. J. Vis. 12, 77–77. doi:10.1167/12.9.77
Engel, S.A., Glover, G.H., Wandell, B.A., 1997. Retinotopic organization in human visual cortex and the spatial precision of functional MRI. Cereb. Cortex 7, 181–192. doi:10.1093/cercor/7.2.181 Errico, C., Osmanski, B.F., Pezet, S., Couture, O., Lenkei, Z., Tanter, M., 2016. Transcranial functional
ultrasound imaging of the brain using microbubble-enhanced ultrasensitive Doppler. Neuroimage 124, 752–761. doi:10.1016/j.neuroimage.2015.09.037
Espinoza, S.G., Subiabre, J.E., Thomas, H.C., 1992. Retinotopic organization of striate and extrastriate visual cortex in the golden hamster (Mesocricetus auratus). 25, 101–107.
Espinoza, S.G., Thomas, H.C., Hubel, B.Y.D.H., Wiesel, a D.T.N., Hubel, D.H.N., Wiesel, T.N., Hubel, B.Y.D.H., Wiesel, a D.T.N., 1983. Retinotopic organization of striate and extrastriate visual cortex in the hooded rat. Brain Res. 160, 106–154. doi:papers://47831562-1F78-4B52-B52E-78BF7F97A700/Paper/p352
Frostig, R.D., Lieke, E.E., Ts’o, D.Y., Grinvald, a, 1990. Cortical functional architecture and local coupling between neuronal activity and the microcirculation revealed by in vivo high-resolution optical imaging of intrinsic signals. Proc. Natl. Acad. Sci. U. S. A. 87, 6082–6086.
doi:10.1073/pnas.87.16.6082
Fukuda, Y., Activity, H.N., 1978. Jap. J. Physiol., 28, 385-400, 1978 385–400.
Gias, C., Hewson-Stoate, N., Jones, M., Johnston, D., Mayhew, J.E., Coffey, P.J., 2005. Retinotopy within rat primary visual cortex using optical imaging. Neuroimage 24, 200–206.
Grinvald, a, Lieke, E., Frostig, R.D., Gilbert, C.D., Wiesel, T.N., 1986. Functional architecture of cortex revealed by optical imaging of intrinsic signals. Nature 324, 361–364. doi:10.1038/324361a0 Hubel, B.Y.D.H., Wiesel, a D.T.N., Hubel, D.N., Wiesel, T.N., Hubel, B.Y.D.H., Wiesel, a D.T.N., 1962.
AND FUNCTIONAL ARCHITECTURE IN THE CAT â€TM S VISUAL CORTEX From the Neurophysiolojy Laboratory , Department of Pharmacology central nervous system is the great diversity of its cell types and inter- receptive fields of a more complex type ( Part I ) and to . Most 160, 106– 154. doi:10.1523/JNEUROSCI.1991-09.2009
Kalatsky, V. a., Stryker, M.P., 2003. New paradigm for optical imaging: Temporally encoded maps of intrinsic signal. Neuron 38, 529–545. doi:10.1016/S0896-6273(03)00286-1
Kjonigsen, L.J., Lillehaug, S., Bjaalie, J.G., Witter, M.P., Leergaard, T.B., 2015. Waxholm Space atlas of the rat brain hippocampal region: Three-dimensional delineations based on magnetic
resonance and diffusion tensor imaging. Neuroimage 108, 441–449. doi:10.1016/j.neuroimage.2014.12.080
Lau, C., Zhang, J.W., Xing, K.K., Zhou, I.Y., Cheung, M.M., Chan, K.C., Wu, E.X., 2011a. BOLD responses in the superior colliculus and lateral geniculate nucleus of the rat viewing an apparent motion stimulus. Neuroimage 58, 878–884. doi:10.1016/j.neuroimage.2011.06.055
Lau, C., Zhou, I.Y., Cheung, M.M., Chan, K.C., Wu, E.X., 2011b. BOLD temporal dynamics of rat superior colliculus and lateral geniculate nucleus following short duration visual stimulation. PLoS One 6. doi:10.1371/journal.pone.0018914
Li, B., Freeman, R.D., 2007. High-Resolution Neurometabolic Coupling in the Lateral Geniculate Nucleus. J. Neurosci. 27, 10223–10229. doi:10.1523/JNEUROSCI.1505-07.2007
Lund, R.D., Girman, S. V, Sauve, Y., Sergej, V., Receptive, R.D.L., Sauvé, Y., 1999. Receptive field properties of single neurons in rat primary visual cortex. J. Neurophysiol. 82, 301–11. Macé, E., Montaldo, G., Cohen, I., Baulac, M., Fink, M., Tanter, M., 2011. Functional ultrasound
imaging of the brain. Nat. Methods 8, 662–4. doi:10.1038/nmeth.1641
Mace, E., Montaldo, G., Osmanski, B.-F., Cohen, I., Fink, M., Tanter, M., 2013. Functional ultrasound imaging of the brain: theory and basic principles. IEEE Trans. Ultrason. Ferroelectr. Freq. Control 60, 492–506. doi:10.1109/TUFFC.2013.2592
Martindale, J., Mayhew, J., Berwick, J., Jones, M., Martin, C., Johnston, D., Redgrave, P., Zheng, Y., 2003. The hemodynamic impulse response to a single neural event. J. Cereb. Blood Flow Metab. 23, 546–555. doi:10.1097/01.WCB.0000058871.46954.2B
Montaldo, G., Tanter, M., Bercoff, J., Benech, N., Fink, M., 2009. Coherent plane-wave compounding for very high frame rate ultrasonography and transient elastography. IEEE Trans. Ultrason. Ferroelectr. Freq. Control 56, 489–506.
Niranjan, A., Christie, I.N., Solomon, S.G., Wells, J.A., Lythgoe, M.F., 2016. fMRI mapping of the visual system in the mouse brain with interleaved snapshot GE-EPI. Neuroimage 139, 337–345. doi:10.1016/j.neuroimage.2016.06.015
Nolte, J., 2009. The Human Brain: An Introduction to Its Functional Anatomy.
Ogawa, S., Lee, T., 1990. Brain magnetic resonance imaging with contrast dependent on blood oxygenation. Proc. … 87, 9868–72. doi:10.1073/pnas.87.24.9868
Op de Beeck, H.P., Torfs, K., Wagemans, J., 2008. Perceived shape similarity among unfamiliar objects and the organization of the human object vision pathway. J. Neurosci. 28, 10111–10123.
Osmanski, B.-F., Pernot, M., Montaldo, G., Bel, A., Messas, E., Tanter, M., 2012. Ultrafast Doppler imaging of blood flow dynamics in the myocardium. IEEE Trans. Med. Imaging 31, 1661–8. doi:10.1109/TMI.2012.2203316
Osmanski, B.F., Martin, C., Montaldo, G., Lanièce, P., Pain, F., Tanter, M., Gurden, H., 2014.
Functional ultrasound imaging reveals different odor-evoked patterns of vascular activity in the main olfactory bulb and the anterior piriform cortex. Neuroimage 95, 176–84.
doi:10.1016/j.neuroimage.2014.03.054
Papp, E.A., Leergaard, T.B., Calabrese, E., Johnson, G.A., Bjaalie, J.G., 2014. Waxholm Space atlas of the Sprague Dawley rat brain. Neuroimage 97, 374–386. doi:10.1016/j.neuroimage.2014.04.001 Pawela, C.P., Biswal, B.B., Cho, Y.R., Kao, D.S., Li, R., Jones, S.R., Schulte, M.L., Matloub, H.S., Hudetz,
A.G., Hyde, J.S., 2008a. Resting-state functional connectivity of the rat brain. Magn. Reson. Med. 59, 1021–1029. doi:10.1002/mrm.21524
Pawela, C.P., Biswal, B.B., Hudetz, A.G., Schulte, M.L., Li, R., Jones, S.R., Cho, Y.R., Matloub, H.S., Hyde, J.S., 2009. A protocol for use of medetomidine anesthesia in rats for extended studies using task-induced BOLD contrast and resting-state functional connectivity. Neuroimage 46, 1137–1147. doi:10.1016/j.neuroimage.2009.03.004
Pawela, C.P., Hudetz, A.G., Ward, B.D., Schulte, M.L., Li, R., Kao, D.S., Mauck, M.C., Cho, Y.R., Neitz, J., Hyde, J.S., 2008b. Modeling of region-specific fMRI BOLD neurovascular response functions in rat brain reveals residual differences that correlate with the differences in regional evoked potentials. Neuroimage 41, 525–534. doi:10.1016/j.neuroimage.2008.02.022
Paxinos, G., Watson, C., 2007. The Rat Brain in stereostaxic coordinates. 6th Edition.
Provost, J., Papadacci, C., Arango, J.E., Imbault, M., Fink, M., Gennisson, J.-L., Tanter, M., Pernot, M., 2014. 3D ultrafast ultrasound imaging in vivo. Phys. Med. Biol. 59, L1–L13. doi:10.1088/0031-9155/59/19/L1
Reitsma, D.C., Mathis, J., Ulmer, J.L., Mueller, W., Maciejewski, M.J., DeYoe, E. a, 2013. Atypical Retinotopic Organization of Visual Cortex in Patients with Central Brain Damage: Congenital and Adult Onset. J. Neurosci. 33, 13010–13024. doi:10.1523/JNEUROSCI.0240-13.2013
Rubin, J., Adler, R., Fowlkes, J., Spratt, S., Pallister, J., Carson, P., 1995. Fractional moving blood volume: estimation with power Doppler us. Radiology 197, 183–190.
Rubin, J.M., Bude, R.O., Carson, P.L., Bree, R.L., Adler, R.S., 1994. Power Doppler US: a potentially useful alternative to mean frequency-based color Doppler US. Radiology 190, 853–856. doi:10.1177/875647939601200315
Rubin, J.M., Bude, R.O., Fowlkes, J.B., Spratt, R.S., Carson, P.L., Adler, R.S., 1997. Normalizing fractional moving blood volume estimates with power Doppler US: defining a stable
intravascular point with the cumulative power distribution function. Radiology 205, 757–65. doi:10.1148/radiology.205.3.9393532
Sandrin, L., Catheline, S., Tanter, M., Hennequin, X., Fink, M., 1999. Time-Resolved Pulsed Elastography with Ultrafast Ultrasonic Imaging. Ultrason. Imaging 21, 259–272. doi:10.1177/016173469902100402
Saul, A.B., Feidler, J.C., 2002. Development of Response Timing and Direction Selectivity in Cat Visual Thalamus and Cortex 22, 2945–2955.
Schuett, S., Bonhoeffer, T., Hübener, M., 2002. Mapping retinotopic structure in mouse visual cortex with optical imaging. J. Neurosci. 22, 6549–6559. doi:20026635
Sergejeva, M., Papp, E.A., Bakker, R., Gaudnek, M.A., Okamura-Oho, Y., Boline, J., Bjaalie, J.G., Hess, A., 2015. Anatomical landmarks for registration of experimental image data to volumetric rodent brain atlasing templates. J. Neurosci. Methods 240, 161–169.
doi:10.1016/j.jneumeth.2014.11.005
Shung, K.K., Sigelmann, R. a, Reid, J.M., 1976. Scattering of Ultrasound by Blood. IEEE Trans. Biomed. Eng. BME-23, 460–467.
Sieu, L.-A., Bergel, A., Tiran, E., Deffieux, T., Pernot, M., Gennisson, J.-L., Tanter, M., Cohen, I., 2015. EEG and functional ultrasound imaging in mobile rats. Nat Methods 12, 831–834.
doi:10.1038/nmeth.3506
Tanter, M., Bercoff, J., Athanasiou, A., Deffieux, T., Gennisson, J.L., Montaldo, G., Muller, M., Tardivon, A., Fink, M., 2008. Quantitative Assessment of Breast Lesion Viscoelasticity: Initial Clinical Results Using Supersonic Shear Imaging. Ultrasound Med. Biol. 34, 1373–1386. doi:10.1016/j.ultrasmedbio.2008.02.002
Tanter, M., Fink, M., 2014. Ultrafast imaging in biomedical ultrasound. IEEE Trans. Ultrason. Ferroelectr. Freq. Control 61, 102–19. doi:10.1109/TUFFC.2014.6689779
Udesen, J., Gran, F., Hansen, K.L., Jensen, J.A., Thomsen, C., Nielsen, M.B., 2008. High frame-rate blood vector velocity imaging using plane waves: Simulations and preliminary experiments. IEEE Trans. Ultrason. Ferroelectr. Freq. Control 55, 1729–1743. doi:10.1109/TUFFC.2008.858
Van Camp, N., Verhoye, M., De Zeeuw, C.I., Van der Linden, A., 2006. Light stimulus frequency dependence of activity in the rat visual system as studied with high-resolution BOLD fMRI. J. Neurophysiol. 95, 3164–3170. doi:10.1152/jn.00400.2005
Vanni, M.P., Provost, J., Casanova, C., Lesage, F., 2010. Bimodal modulation and continuous stimulation in optical imaging to map direction selectivity. Neuroimage 49, 1416–1431. doi:10.1016/j.neuroimage.2009.09.044
Vanni, M.P., Provost, J., Lesage, F., Casanova, C., 2010. Evaluation of receptive field size from higher harmonics in visuotopic mapping using continuous stimulation optical imaging. J. Neurosci. Methods 189, 138–150. doi:10.1016/j.jneumeth.2010.03.013
Walker, W.F., Trahey, G.E., 1994. A fundamental limit on the accuracy of speckle signal alignment. IEEE Ultrason. Symp. 1787–1792.
Wang, L., Sarnaik, R., Rangarajan, K., Liu, X., Cang, J., 2010. Visual receptive field properties of neurons in the superficial superior colliculus of the mouse. J. Neurosci. 30, 16573–84. doi:10.1523/JNEUROSCI.3305-10.2010
Warnking, J., Dojat, M., Guérin-Dugué, a, Delon-Martin, C., Olympieff, S., Richard, N., Chéhikian, a, Segebarth, C., 2002. fMRI retinotopic mapping--step by step. Neuroimage 17, 1665–1683. doi:10.1006/nimg.2002.1304
Wibral, M., Muckli, L., Melnikovic, K., Scheller, B., Alink, A., Singer, W., Munk, M.H., 2007. Time-dependent effects of hyperoxia on the BOLD fMRI signal in primate visual cortex and LGN. Neuroimage 35, 1044–1063. doi:10.1016/j.neuroimage.2006.12.039
Yen, C.C.C., Fukuda, M., Kim, S.G., 2011. BOLD responses to different temporal frequency stimuli in the lateral geniculate nucleus and visual cortex: Insights into the neural basis of fMRI.
Neuroimage 58, 82–90. doi:10.1016/j.neuroimage.2011.06.022
Zhou, I.Y., Cheung, M.M., Lau, C., Chan, K.C., Wu, E.X., 2012. Balanced steady-state free precession fMRI with intravascular susceptibility contrast agent. Magn. Reson. Med. 68, 65–73.
![Figure 1 A. Schematic view of the experimental setup. B. Stimulus pattern for episodic visual stimulation: 30 s of rest are followed with 30 s of flickering of the screen at a frequency in the [0; 10 Hz] range](https://thumb-eu.123doks.com/thumbv2/123doknet/14553882.537281/7.892.110.782.453.763/schematic-experimental-stimulus-episodic-stimulation-followed-flickering-frequency.webp)