HAL Id: hal-00495337
https://hal.archives-ouvertes.fr/hal-00495337
Submitted on 25 Jun 2010
HAL is a multi-disciplinary open access archive for the deposit and dissemination of sci-entific research documents, whether they are pub-lished or not. The documents may come from teaching and research institutions in France or abroad, or from public or private research centers.
L’archive ouverte pluridisciplinaire HAL, est destinée au dépôt et à la diffusion de documents scientifiques de niveau recherche, publiés ou non, émanant des établissements d’enseignement et de recherche français ou étrangers, des laboratoires publics ou privés.
Antoine Perriot, Etienne Barthel, Guillaume Kermouche, Gilles Querel,
Damien Vandembroucq
To cite this version:
Antoine Perriot, Etienne Barthel, Guillaume Kermouche, Gilles Querel, Damien Vandembroucq. On the plastic deformation of soda-lime glass - a Cr3+ luminescence study of densification. Philosophical Magazine, Taylor & Francis, 2011, 91 (7-9), pp.1245-1255. �10.1080/14786435.2010.491808�. �hal-00495337�
Philosophical Magazine
Vol. 00, No. 00, 19 November 2009, 1–10
RESEARCH ARTICLE
On the plastic deformation of soda-lime glass – a Cr3+ luminescence study of densification
A. Perriota, E. Barthela∗, G. Kermoucheb, G. Qu´erelc and D. Vandembroucqd
aUnit´e Mixte de Recherche CNRS/Saint-Gobain, 39 Quai Lucien Lefranc, 93303 Aubervilliers Cedex, France.;bUniversit´e de Lyon, ENI Saint-Etienne, LTDS, UMR5513,58 rue Jean Parot, 42023 Saint-Etienne, France.;cSaint-Gobain Recherche, 39
Quai Lucien Lefranc, 93303 Aubervilliers Cedex, France.;dLaboratory PMMH, ESPCI, 10 rue Vauquelin, 75231 Paris Cedex 05, France.
(v4.4 released ??? november 2009)
Silicate glasses are known to experience an anomalous plastic behavior at micron-scale: 1) they exhibit densification when flowing plastically and 2) hydrostatic pressure affects the yield point. We have previously shown (A. Perriot et al. J. Am. Ceram. Soc. 89 (2006) 596) that densification maps are useful to infer a reliable constitutive law for the plastic response of silicate glasses. It is shown here that for soda-lime glass Cr3+luminescence microspectroscopy
may be used for that purpose. We also show that the constitutive law we have previously developed for amorphous silica provides a qualitative description of normal glasses although it is unable to account for the finer details. More work is needed to quantitatively model normal-glass plasticity at the continuum length-scale.
Keywords: Plasticity, Glass, Indentation, Constitutive model
1. Introduction
Silicate glasses are considered as the archetype of brittle materials. However, var-ious experiments [1–3] have shown that they exhibit plastic response in highly confined geometries (Diamond-Anvil Cell (DAC) [4, 5], indentation [1, 6],...). More-over, this so-called “micro-ductile” behavior departs from the ubiquitous crystalline plasticity which is triggered by shear and conserves volume. Indeed silicate glasses exhibit densification under purely hydrostatic loading [7], but they also densify during plastic shear flow [6]. The permanent volumetric strain (densification) is known to saturate [8, 9] at a value which depends on the glass composition. The less polymerized, the smaller the maximum possible densification. It amounts to a few percents for highly modified glasses [10], which are commonly called, for obvi-ous historical reasons, “normal” glasses. It can reach as much as 20% in the case of amorphous silica [9], which is the archetype of the so-called ”anomalous” glasses.
For predictive purposes, it is useful to obtain a constitutive equation for the plas-tic deformation of amorphous silicates. To take densification into account, a few authors have proposed a Dr¨ucker-Prager-like plastic criterion [9, 11]. The model parameters were adjusted using a trial-and-error approach based on Finite Element (FE) analysis of indentation experiments. This is a delicate task, because indenta-tion is a highly inhomogeneous loading and indentaindenta-tion curves [11, 12] or residual
∗Corresponding author. Email: etienne.barthel@saint-gobain.com
ISSN: 1478-6435 print/ISSN 1478-6443 online c
° 2009 Taylor & Francis
DOI: 10.1080/1478643YYxxxxxxxx http://www.informaworld.com
indent profile [11] provide a very limited set of data to fit a complex constitutive equation. A richer set of data is required but due to the brittle nature of amorphous silicates, which exhibit plasticity only at the micron-scale, these experiments must be performed at the micron-scale.
Previously [13], we used Raman micro-spectroscopy to provide densification maps of indents in amorphous silica. We also proposed a constitutive law for the elasto-plastic response of amorphous silicates. This model, which is inspired by porous materials, takes into account the hydrostatic hardening behavior of silica, which has been independently identified with the help of Diamond Anvil Cell ments [14]. Starting from this constitutive law, a good agreement with the experi-mental indentation-induced densification maps [13] is obtained.
However, for silica, the measurement of the densification maps relies on the D2 -line shift. Indeed the relation of this shift with density has been reported in details in the literature [4, 7, 15]. Unfortunately, for normal silicate glasses, spectral bands appear with the addition of modifiers and they tend to conceal the D2 band. As a
result, another way to characterize material density at the local scale is required. Transition and rare-earth ions have long been used to characterize the structural changes in densified glasses [16]. Qu´erel has studied the evolution of the lumines-cence spectrum of Cr3+ ion in doped silicate glasses [17, 18]. The results suggest
that luminescence could be used as a local probe for density. In the present work, we performed a microspectroscopic mapping of the Cr3+ ion luminescence
spec-trum of indented areas in two Cr3+-doped commercial-grade glass samples. We
show that Cr3+ luminescence is a promising way to extend the measurement of
residual densification map to other silicate glasses. In addition, the resulting maps are compared to numerical predictions based on the constitutive model we have previously developed for silica [19], demonstrating rough agreement. However, it is shown that for a full prediction of the shape of the density distribution, additional features must be included in the constitutive law.
2. Experimental procedure
For the samples, two commercial bottles were fused into discs. The composition of the glasses, labelled G1 and G2, are about 71% SiO2, 12% Na20 and 10% CaO
(Table 1), which is a typical industrial formulation of soda-lime glass. Plates of dimension 8×8×0.5 cm3 were cut out from these discs and polished. The residual
stresses induced by polishing where relaxed by annealing and 2-kg Vickers inden-tations were performed on the plates.
We used a Raman microspectroscopy device (Thermonicolet) including a 25 mW, 532 nm laser, under a ×100 objective. The laser beam was focused on the surface using a confocal setup. The excited volume of glass was approximately 2×2×2 µm3. We performed surface mappings on three indents of each type of glass. A typical map consists in a collection of 52 spectra taken with a 10 µm-spacing on half views of indents. For each spectrum, the luminescence signal was accumulated during 1 s, to be compared with the 900 s necessary to obtain an equivalent spectrum while performing Raman microspectroscopic mapping of indented silica [13].
3. Results
Figure 1 contrasts a spectrum obtained in the center of an indent with a reference spectrum acquired away from the indents. Between 12,163 and 14,924 cm−1, the
3 centered around 12,800 cm−1 and a narrower band around 14,550 cm−1, forming
a shoulder on the first. According to Qu´erel [17, 18], these two bands respectively correspond to the transitions 4T
2 → 4A2 and 2E → 4A2. This lineshape results
from a wide distribution of Cr3+sites with a range of crystal field environments [20,
21].
Let us consider the Tanabe-Sugano diagram for Cr3+ ion in an octahedral site
(Fig. 2). Dq/B quantifies the overall influence of the crystal field since Dq is related to the crystal field intensity and B to the covalent nature of the Cr3+atomic bonds.
The energy of the4T
2 level crosses the 2E level for Dq/B ' 2. As both 4T2 and 2E levels comply with the transition rules, they are both emissive. As a result the
Tanabe-Sugano diagram suggests that when Dq/b < 2, the luminescence transition is4T2 → 4A2, while it is2E → 4A2 for Dq/B > 2.
Experiments performed with a DAC [18] have shown that under hydrostatic compression Cr3+-doped silicate glasses exhibit two main pattern changes: 1) the intensity of the 2E → 4A
2 band increases with respect to the 4T2 → 4A2 band
and 2) it shifts to lower frequencies. These phenomena were interpreted as a local compression of the Cr3+ sites [17]. Indeed, the hydrostatic pressure enhances the
crystal field and increases Dq/B. With increasing hydrostatic pressure, Cr3+ sites
shrink, Dq/B increases and the intensity ratio (2E → 4A2)/(4T2 → 4A2) increase.
As a result a shift to lower frequencies is observed, due to the increase of the population of2E → 4A2 sites with pressure.
The 2E → 4A
2 band positions and relative intensities are markers of the local
volume distortion of the material. Experimentally, these two markers were evalu-ated through spectral deconvolution: the high frequency side of the 4T
2 → 4A2
band was fitted with a gaussian, providing a good estimate for the band height. This gaussian was used as a baseline which was subtracted to the spectrum. Finally the 2E → 4A
2 band was fitted with a Pearson IV function for band height and
position.
The resulting maps are presented on Fig. 3. The lines satisfy the symmetries of the indenter. Moreover, notice that for both indicators and both samples the center of the indent does appear as the most densified part of the indented area: as the laser spot moves nearer to the center of the indent, the2E → 4A
2 band shifts
towards low frequencies and its relative intensity increases.
4. Density estimation
Qu´erel [17] has given a relation between the2E → 4A
2 band shift and the average
hydrostatic pressure applied on several glass samples of different compositions. Since this approximate relation is otherwise unpublished, we give some more details here. It is assumed that shear does not affect the2E → 4A2 band position and that
the bulk modulus remains reasonably unchanged with density. If α is the band shift per unit of pressure and B the bulk modulus of the material, then, the densification as a function of the band shift ∆ν is given by
∆ρ
ρ =
∆ν
αB (1)
In the case of a model 60%-SiO2–20%-Na2O–20%-CaO soda-lime glass, α is
eval-uated to about 12.5 cm−1/GPa towards low frequencies, while B ' 39 GPa, for a
Young’s modulus equal to 70 GPa and a Poisson ratio equal to 0.2.
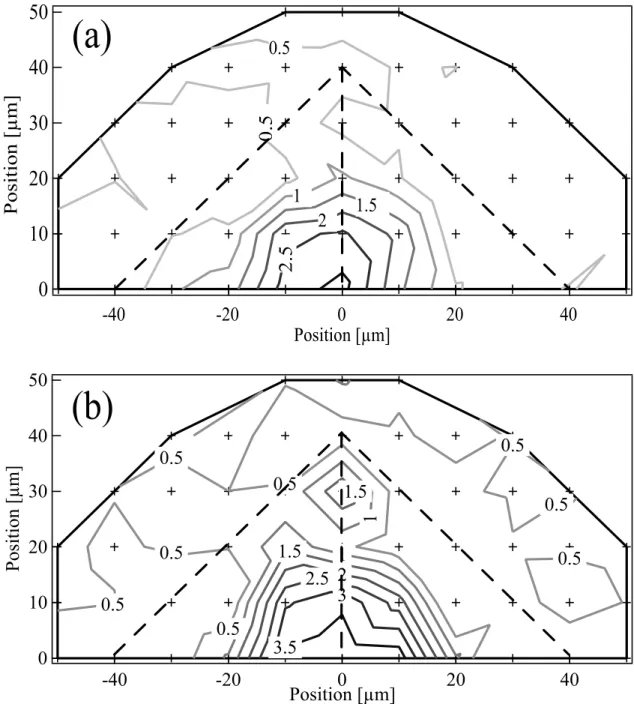
Then, with equation (1), we obtain the densification maps presented on Fig. 4. We notice that the maximum densification is about 3 to 4%. These values are
reasonably consistent with the “normality” of the samples. In comparison, Ji et al [22] report a maximum densification equal to about 5-6% for window (soda-lime) glass, which is consistent with the present results.
Clearly Eq. 1 provides only a rough evaluation and further refinements are needed if the method is to be used more extensively. At the present stage of development of the method it is difficult to provide error bars but, given the crudeness of the approximation, we believe that the qualitative agreement with previous results for similar glasses [22] is encouraging.
5. Iso-density contours
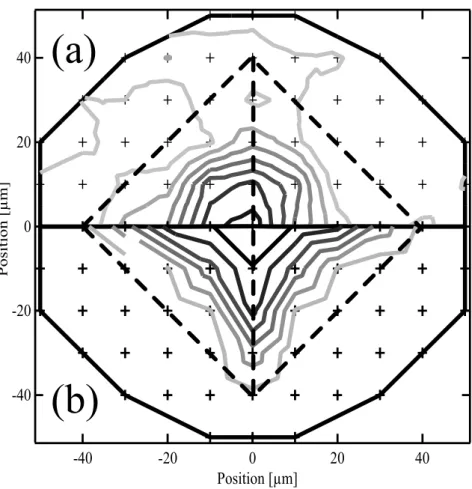
We now discuss the shape of the iso-density contours. Fig. 3 demonstrates that for the silicate glasses G1 and G2 the contours are convex. This shape strongly contrasts with the concave iso-density contours observed on Vickers-indented sil-ica (Figure 5). Note that for silsil-ica (bottom), the concave contours result in a star-shaped pattern, while a much more circular figure is revealed in the case of soda-lime glass. The density contrast between the Vickers edges and faces is less marked for soda-lime glass than for amorphous silica [13]. This result is consistent with the fact that soda-lime glasses are normal, in contrast to silica. Indeed, op-tical observations by Hagan and Van der Zwaag [10], as well as a rough model by Yoffe [23], demonstrate that the densified area under the indenter is expected to be more regular and spherical with increasing glass normality.These contrasted shapes for the iso-density contours of normal and anomalous glasses is the main result of the paper. It is to be emphasized that it should be robust against uncertainties in the quantitative conversion between spectroscopic features and density.
6. Finite element analysis of the indentation-induced densification process
In a previous paper [19], we have shown that a constitutive model based on the mechanics of porous materials can be used to predict indentation-induced densifi-cation maps on silica. In this section we test the predictions of the model on the maps shown in the previous sections. For a similar normal glass, the densification under high pressure has been measured recently [22].
Let us just recall the main features of this constitutive model. In compression, the yield criterion is
f (σij) = µ q qc ¶2 + µ p pc ¶2 − 1 (2)
where pc is the (hydrostatic) plastic limit in pure hydrostatic loading and qc the
(shear) plastic limit in pure deviatoric loading. This form of the yield criterion allows us to consider an associative flow rule. The densification-induced hardening is modeled by taking into account an increase of the hydrostatic limit pc with the plastic densification of the material. This plastic densification implies that a part of the free volume disappears under hydrostatic pressure. This hydrostatic hardening is thus directly related to the free volume fraction Φ which decreases from the initial free volume Φ0to zero (saturation). Similarly to the compaction of powders,
the irreversible evolution of free volume is given by
REFERENCES 5 The densification-induced hardening data of Vandembroucq et al [14] have been used for silica whereas the densification-induced hardening data of Ji et al [22] have been chosen for the window (soda-lime) glass. The shear limit qc for
soda-lime glass has been quantified from nanoindentation data, using the methodology presented previously [19]. The set of parameters identified for these two materials are summarized in table 2.
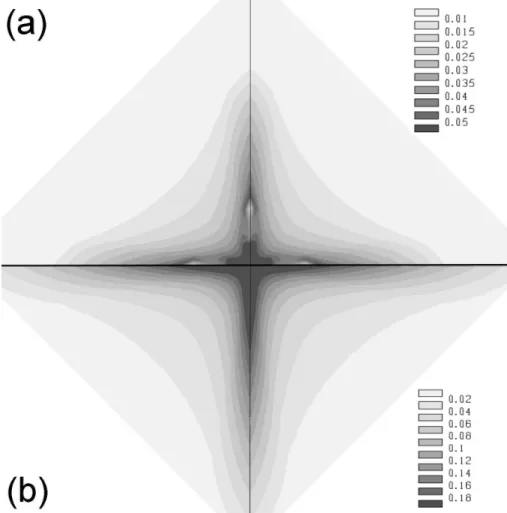
Calculations have been performed with the Finite Element Software Systus [24] using 3D elements and using a large displacement / large strain option (updated La-grangian formulation, logarithmic strain). The boundary and loading conditions are similar to those proposed by Giannakopoulos et al. [25]. The resulting densification maps are plotted in Figure 6. For both silica and soda-lime glass, the densification gradient is well reproduced. Moreover, the curvature of the iso-densification lines of amorphous silica (b) are consistent with the experimental micro-raman results [13]: the density is higher under the edges than under the faces of the Vickers indenter, leading to star-shaped iso-densification lines. However, the iso-densification lines of soda-lime glass are also star-shaped which is in strong contrast with the new experimental results (Fig 5) presented here. It is thus clear that our constitutive model performs better to model the plastic deformation for silica than for normal glasses.
7. Conclusion
We have used the luminescence of Cr3+-doped soda-lime glasses to evaluate the
distribution of the residual indentation-induced densification in normal glasses. Our results are consistent with previous results in the literature [10, 23]. These results stress the potential of Cr3+ as a local marker of density. Using this marker,
we have extended our method to propose a constitutive law for the plastic defor-mation of normal silicate glasses. Moreover, considering the reduced acquisition time necessary to obtain reasonable signal-to-noise ratios, this marker should dras-tically reduce the time necessary to obtain a densification map. For more precise measurements, more extensive data on the correlation between sample density and luminescence spectra would be necessary. They could be obtained with heat-and-pressure densified macroscopic samples of glasses. The effect of the residual elastic shear stress on the spectral patterns should also be explored carefully.
Finally, we have shown that the elastic-plastic constitutive model previously de-veloped for silica is only qualitatively valid for more normal glasses such as soda-lime glasses. The overall density gradient is well accounted for in both cases. How-ever, the calculated iso-densification lines are star-shaped in both cases, whereas the experiments reveal spherical iso-densification lines for soda-lime glasses. Conse-quently a new constitutive model specifically adapted to the densification behaviour of normal glasses has to be developed.
8. Acknowledgments
The authors would like to thank G. Duisit, R. Gy, S. Pelletier and S. Roux for their help, advice and support.
References
[2] J. Mackenzie, J. Am. Ceram. Soc. 46 (1963) p.461.
[3] F. C´elari´e, S. Prades, D. Bonamy, L. Ferrero, E. Bouchaud, C. Guillot and C. Marli`ere, Phys. Rev. Lett. 90 (2003) p.75504.
[4] J.M. Mikkelsen Jr. and F. Galeener, J. Non-Cryst. Solids 37 (1980) p.71.
[5] M. Grimsditch, Phys. Rev. Lett 52 (1984) p.2379.
[6] F. Ernsberger, J. Am. Ceram. Soc. 51 (1968) p.545.
[7] H. Sugiura and T. Yamadaya, J. Non-Cryst. Solids 144 (1992) p.151.
[8] A. Polian and M. Grimsditch, Phys. rev. B 41. (1990) p.6086.
[9] J. Lambropoulos, S. Xu and T. Fang, J. Am. Ceram. Soc. 79 (1996) p.1441.
[10] J. Hagan and S.V.D. Zwaag, J. Non-Cryst. Solids 64 (1984) p.249.
[11] M. Imaoka and I. Yasui, J. Non-Cryst. Solids 22 (1976) p.315.
[12] K. Xin and J. Lambropoulos, Proc. SPIE 4102 (2000) p.112.
[13] A. Perriot, V. Martinez, C. Martinet, B. Champagnon, D. Vandembroucq and E. Barthel, J. Am. Ceram. Soc. 89 (2006) p.596.
[14] D. Vandembroucq, T. Deschamps, C. Coussa, A. Perriot, E. Barthel, B. Champagnon and C. Martinet, J. Phys.: Condens. Matter 20 (2008) p.485221.
[15] H. Sugiura, R. Ikeda, K. Kondo and T. Yamadaya, J. Appl. Phys. 81 (1997) p.1651.
[16] N. Soga, K. Hirao, M. Yoshimoto and H. Yamamoto, J. Appl. Phys. 63 (1988) p.4451.
[17] G. Qu´erel, Cristallochimie des ´el´ements traces dans les phases du manteau terrestre – Applications
de la spectroscopie de luminescence `a haute pression et haute temp´erature, University of Rennes,
France, 1997.
[18] G. Qu´erel and B. Reynard, Chem. Geol. 128 (1996) p.65.
[19] G. Kermouche, E. Barthel, D. Vandembroucq and P. Dubujet, Acta Materialia 56 (2008) p.3222.
[20] M. Yamaga, B. Henderson, K. O’Donell and Y. Gao, Phys. Rev. B 44 (1991) p.4853.
[21] F. Rasheed, K. O’Donell, B. Henderson and D. Hollis, J. Phys. : Condens. Matter 3 (1991) p.1915.
[22] H. Ji, V. Keryvin, T. Rouxel and T. Hammouda, Scripta Materialia 55 (2006) p.1159.
[23] E. Yoffe, Phil. Mag. A 46 (1982) p.617.
[24] Systus/Sysweld, 2009 in User’s manual ESI Group.
REFERENCES 7
sample SiO2 Na2O CaO MgO Al2O3 K2O Fe2O3 Cr2O3 TiO2, SO3
G1 70.5 % 12.3 % 10.4 % 2.0 % 2.3 % 890 ppm 440 ppm 220 ppm traces G2 71.6 % 12.4 % 10.9 % 1.4 % 2.1 % 700 ppm 320 ppm 200 ppm traces
Table 1. Composition of the samples used is this study. Both are commercial grade Cr3+-doped glasses.
E (GPa) ν qc (MPa) Φ0
Silica 70 0.17 7 17 % Soda-lime glass 75 0.22 3.5 5.5 %
Table 2. Set of parameters used for silica and soda-lime glass. These values of initial free volume result in maximum densifications of respectively 20 % and 6 %.
Intensity [A.U.] 14500 14000 13500 13000 12500 Wavenumber [cm -1 ] Far from the indent
Center of the indent
Strong field Weak field
Figure 1. Luminescence spectra of Cr3+-doped soda-lime glass . The plain line spectrum was obtained in
an unmodified area of the sample, while the dotted line corresponds to the center of the indent (which is expected to be the most densified area).
Weak
Field
Strong Field
Figure 2. Tanabe-Sugano diagram for Cr3+ in octahedral symmetry. With increasing influence of the
50 40 30 20 10 0 Position [µm] -40 -20 0 20 40 Position [µm] 0.085 0.08 0.075 0.07 0.065 0.06 0.055 0.055 (c) Position [µm] 50 40 30 20 10 0 Position [µm] -40 -20 0 20 40 0.085 0.08 0.08 0.075 0.075 0.07 0.065 0.06 0.055 0.055 0.055 0.05 0.05 0.05 0.05 0.05 0.05 (d) 50 40 30 20 10 0 Posi t i on [µm] -40 -20 0 20 40 Position [µm] 14558 14556 14556 14552 14548 14558 14544 (b) 14558 50 40 30 20 10 0 Posi t i on [µm] -40 -20 0 20 40 Position [µm] 14558 14556 14556 14552 14548 14558 14544 (b) 14558 50 40 30 20 10 0 Posi t i on [µm] -40 -20 0 20 40 Position [µm] 14558 14556 14556 14552 14548 14558 14544 (b) 14558 50 40 30 20 10 0 Position [µm] -40 -20 0 20 40 Position [µm] 14558 14558 14556 14552 14548 (a) (e)
Figure 3. Maps of the spectroscopic features of the2E → 4A2 transition over densified areas of glasses
G1 (a and c) and G2 (b and d). The densification was obtained by Vickers indentation. The half-view maps (a) and (b) display the peak position and the half-view maps (c) and (d) the peak height normalized to the4T
2 → 4A2band. Numerical values are given in cm−1(a and c) and non-dimensional (b and d).
Iso-indicator contour lines are shown in grey. The limits of the indents are shown as bold dotted lines and the limits of the scanned area as bold black lines, as sketched in (e). The center of the indent is at coordinates (0;0) and the dark crosses are the measurement positions.
REFERENCES 9 50 40 30 20 10 0 Position [µm] -40 -20 0 20 40 Position [µm] 2.5 2 1.5 1 0.5 0.5 (a) 50 40 30 20 10 0 Position [µm] -40 -20 0 20 40 Position [µm] 3.5 3 2.5 2 1.5 1.5 1 1 0.5 0.5 0.5 0.5 0.5 0.5 0.5 0.5 (b)
Figure 4. Densification maps for sample G1 (a) and G2 (b) (see text). The increment between iso-density contours is 0.5 %.
40 20 0 -20 -40 Position [µm] -40 -20 0 20 40 Position [µm] (a) (b)
Figure 5. Densification maps obtained on sample G1 (a) (iso-density contours with 0.5 % increments) and on amorphous silica (b) (iso-density contours with 2.5 % increments, increasing from outside the contact area to inside) . The iso-density contours for the “normal” glass (a) are close to circular while they are star-shaped for silica which is an “anomalous” glass.
REFERENCES 11
Figure 6. Finite element simulations of the densification maps obtained on soda-lime glass (a) and on amorphous silica (b) with the parameters of Table 2.