HAL Id: hal-00295855
https://hal.archives-ouvertes.fr/hal-00295855
Submitted on 2 Mar 2006
HAL is a multi-disciplinary open access
archive for the deposit and dissemination of
sci-entific research documents, whether they are
pub-lished or not. The documents may come from
teaching and research institutions in France or
abroad, or from public or private research centers.
L’archive ouverte pluridisciplinaire HAL, est
destinée au dépôt et à la diffusion de documents
scientifiques de niveau recherche, publiés ou non,
émanant des établissements d’enseignement et de
recherche français ou étrangers, des laboratoires
publics ou privés.
Mediterranean). 2. Determination of single scattering
albedo at two wavelengths for different aerosol types
D. Meloni, A. Di Sarra, G. Pace, F. Monteleone
To cite this version:
D. Meloni, A. Di Sarra, G. Pace, F. Monteleone. Aerosol optical properties at Lampedusa (Central
Mediterranean). 2. Determination of single scattering albedo at two wavelengths for different aerosol
types. Atmospheric Chemistry and Physics, European Geosciences Union, 2006, 6 (3), pp.715-727.
�hal-00295855�
www.atmos-chem-phys.net/6/715/2006/ © Author(s) 2006. This work is licensed under a Creative Commons License.
Chemistry
and Physics
Aerosol optical properties at Lampedusa (Central Mediterranean).
2. Determination of single scattering albedo at two wavelengths for
different aerosol types
D. Meloni1, A. di Sarra1, G. Pace1, and F. Monteleone2
1ENEA, Climate Laboratory, S. Maria di Galeria, Roma, Italy 2ENEA, Climate Laboratory, Palermo, Italy
Received: 5 November 2004 – Published in Atmos. Chem. Phys. Discuss.: 14 July 2005 Revised: 7 November 2005 – Accepted: 17 January 2006 – Published: 2 March 2006
Abstract. Aerosol optical properties were retrieved from
di-rect and diffuse spectral irradiance measurements made by a multi-filter rotating shadowband radiometer (MFRSR) at the island of Lampedusa (35.5◦N, 12.6◦E), in the Central Mediterranean, in the period July 2001–September 2003. In a companion paper (Pace et al., 2006) the aerosol optical depth (AOD) and ˚Angstr¨om exponent were used together with airmass backward trajectories to identify and classify different aerosol types. The MFRSR diffuse-to-direct ra-tio (DDR) at 415.6 nm and 868.7 nm for aerosol classified as “biomass burning-urban/industrial”, originating primar-ily from the European continent, and desert dust, originat-ing from the Sahara, is used in this study to estimate the aerosol single scattering albedo (SSA). A detailed radiative transfer model is initialised with the measured aerosol opti-cal depth; opti-calculations are performed at the two wavelengths varying the SSA values until the modelled DDR matches the MFRSR observations. Sensitivity studies are performed to estimate how uncertainties on AOD, DDR, asymmetry factor (g), and surface albedo influence the retrieved SSA values. The results show that a 3% variation of AOD or DDR produce a change of about 0.02 in the retrieved SSA value at 415.6 and 868.7 nm; a ±0.06 variation of the asym-metry factor g produces a change of the estimated SSA of
<0.04 at 415.6 nm, and <0.06 at 868.7 nm; finally, an in-crease of the assumed surface albedo of 0.05 causes very small changes (0.01–0.02) in the retrieved SSA. The calcu-lations show that the SSA of desert dust (DD) increases with wavelength, from 0.81±0.05 at 415.6 nm to 0.94±0.05 at 868.7 nm; on the contrary, the SSA of urban/industrial (UN) aerosols decreases from 0.96±0.02 at 415.6 nm to 0.87±0.07 at 868.7 nm; the SSA of biomass burning (BB) particles is 0.82±0.04 at 415.6 nm and 0.80±0.05 at 868.7 nm. Episodes of UN aerosols occur usually in June and July; long lasting
Correspondence to: D. Meloni
(daniela.meloni@casaccia.enea.it)
BB aerosol episodes with large AOD are observed mainly in July and August, the driest months of the year, when the de-velopment of fires is frequent.
1 Introduction
The single scattering albedo (SSA) represents a key param-eter in describing the aerosol optical properties: it is defined as
SSA= ks
ks +ka
(1) where ksand kaare the aerosol scattering and absorption
co-efficients, respectively.
The co-albedo, defined as (1-SSA), expresses the fraction of energy absorbed by the aerosols. Knowledge of the SSA is essential for the estimate of the aerosol radiative effects and impact on climate. Direct measurement of particles’ ab-sorption and scattering properties is expensive, and is gener-ally carried out only at the surface. Information on the ver-tical behaviour of SSA are more difficult to obtain. Indirect methods require the determination of the aerosol size distri-bution and of the complex refractive index, which necessi-tates the contemporaneous use of various chemical and opti-cal instruments (e.g. Conant et al., 2003; H¨oller et al., 2003). Due to the difficulty in obtaining such an extended set of ob-served quantities, an increasing effort is made to derive the SSA through alternative methods. Herman et al. (1975) first suggested that aerosol absorption and refractive index could be estimated from the comparison of measured and calcu-lated diffuse-to-direct irradiance ratios. Silva et al. (2002) de-termine the broadband SSA by comparing measured down-welling radiation with fluxes obtained with a radiative trans-fer model initialised with measured AOD and with estimated aerosol phase function. Russell et al. (2002) retrieved the SSA during two experiments in the North Atlantic Region,
the Tropospheric Aerosol Radiative Forcing Observational Experiment (TARFOX) and the Second Aerosol Character-ization Experiment (ACE-2), applying various techniques (the comparison of measured and modelled radiative fluxes; the derivation of SSA from measurements of Sun and sky radiances; the comparison of lidar-derived backscatter pro-file and AOD from sun photometer with model calculations of aerosol optical properties; the comparison of modelled aerosol scattering and absorption with in situ measurements by means of nephelometer and photometer). The best-fit technique between measured and modelled fluxes yielded a relatively wide range of values for SSA, 0.90±0.04 at about 550 nm for polluted aerosol in the boundary layer. This range produces notably different effects in terms of radiative im-pact. The other techniques gave different results, leading to the conclusion that accurate controls have to be performed when dealing with different methods. Bergstrom et al. (2003) calculated the SSA for two days during the Southern African Regional Science Initiative (SAFARI 2000) field experiment, comparing the irradiance measurements with the result of a radiative transfer model in the spectral range 300–1700 nm. Their results show that the decrease of SSA with increasing wavelength is consistent with the absorption by black car-bon particles and that the uncertainty is larger in cases of low AOD.
In the Mediterranean Sea, few studies on the deriva-tion of the aerosol SSA have been conducted. Formenti et al. (2002) estimated the SSA for an aged biomass burn-ing plume from airborne irradiance measurements performed over the Aegean Sea: the value of 0.89 at 550 nm for dry par-ticles was found to be in agreement with estimations from other works. During the Photochemical Activity and So-lar Ultraviolet Radiation modulating factors (PAUR II) cam-paign (Zerefos et al., 2002), optical and chemical characteris-tics of aerosols originating from different sources were mea-sured at a coastal site in Crete (Kouvarakis et al., 2002): the SSA at 532 nm was found to be 0.91 for clean marine aerosol, 0.81 for anthropogenic aerosol, and 0.87 for Saharan dust.
Radiation and aerosol data collected on the island of Lampedusa in the context of the PAUR II project (di Sarra et al., 2002) have shown that very different radiative effects are produced by desert dust and continental/polluted aerosols in the Mediterranean. Meloni et al. (2003) retrieved the SSA at 500 nm for desert dust from measurements of UV irradiance and model simulations: the SSA values at different altitudes within the aerosol layer fall between 0.73 and 0.84. They also estimated that at surface level the radiative forcing in the vis-ible per unit optical depth is largest for aerosols transported from continental Europe. The forcing at the top of the atmo-sphere is negative for desert dust, thus producing a cooling, and close to zero or positive for aerosol originating from Eu-rope. The column-integrated SSA at 532 nm for aerosols of continental origin was calculated by Di Iorio et al. (2003) at Lampedusa from a combination of lidar and particle counter measurements: values varied between 0.79 and 0.84.
The purpose of this paper is to estimate the column-integrated SSA from measurements performed with a multi-filter rotating shadowband radiometer (MFRSR) at Lampe-dusa (35.5◦N, 12.6◦E) from July 2001 to September 2003. Lampedusa is a remote island reached by airmasses of vari-ous origin loaded with different aerosol types. Since 1998 the Italian National Agency for New Technologies, Energy and Environment (ENEA) maintains a Climate Laboratory for the monitoring of solar radiation, aerosol and ozone with various instruments (http://www.palermo.enea.it/Lampedusa).
In the companion paper by Pace et al. (2006) the different aerosol types reaching Lampedusa throughout the year are identified and classified based on the MFRSR measurements. The determination of SSA as a function of wavelength is a useful tool to distinguish among different aerosol types; for example Bergstrom et al. (2002), Dubovik et al. (2002) and H¨oller et al. (2003) found that SSA decreases with increasing wavelength for urban/industrial aerosols, while increases for desert dust.
We will show that the wavelength dependence of the re-trieved SSA is consistent with the aerosol classification based on AOD, ˚Angstr¨om parameter and airmass trajectory analy-sis presented in the companion paper by Pace et al. (2006).
2 Methodology
The MFRSR performs nearly simultaneous measurements of global (direct plus diffuse) and diffuse irradiance at six nar-row bands in the visible and near IR, and in a broadband (300–1100 nm) channel. The narrowband channels are cen-tred at 415.6, 495.7, 614.6, 672.8, 868.7, and 939.6 nm, and have a FWHM bandwidth of approximately 10 nm. The di-rect component is calculated as the difference between the global and the diffuse irradiances. The MFRSR calibration and the AOD retrieval are accurately described in Pace et al. (2006). The absolute calibration is performed with the Langley technique on cloud-free half days characterized by small and stable aerosol amount. The global and the diffuse irradiances are measured with the same sensor and electron-ics by the MFRSR, and the ratio of the diffuse to the direct components (DDR) is reasonably accurate (Halthore et al., 2004); moreover, the DDR is independent of calibration con-stants and in particular of the extraterrestrial solar spectrum. Although the extraterrestrial solar spectrum in the UV – vis-ible – near IR has been accurately measured, some discrep-ancies exist (e.g. Drummond and Thekaekara, 1973; Kurucz, 1992). Thus, the DDR is the most appropriate quantity to be compared with radiative transfer simulations.
Herman et al. (1975) first introduced the DDR method to determine the imaginary part of the refractive index for desert dust, comparing the measured and the calculated DDR. This method is based on the sensitivity of the diffuse radiation to absorption by dust (and on the weak dependence on the real part of the refractive index), and allows a unique solution
once the ground albedo is known. When the albedo is not known, a solution is still possible, but the uncertainties due to potential errors increase. A similar approach has been adopted by Petters et al. (2003) to derive the SSA in the UV wavelengths for cloud-free summer days in the South-Eastern United States; they simulated the DDR measured at the seven operational wavelengths of the ultraviolet MFRSR (UV-MFRSR) by means of a radiative transfer model, vary-ing the SSA values until the model output matched the mea-surements.
In this study we apply the method by Herman et al. (1975) to derive the SSA at the two MFRSR channels centred at 415.6 nm and 868.7 nm using the cloud-free measurements performed at Lampedusa from July 2001 to September 2003. The diffuse and direct irradiances are calculated using the radiative transfer model UVSPEC by Mayer et al. (1997), assuming a plane-parallel atmosphere with standard vertical profiles of temperature, pressure and ozone for mid-latitudes. The radiative transfer equation is solved using the im-proved version of the discrete ordinate method of Stamnes et al. (1988) (DISORT2) with 8 streams, a sufficient num-ber when calculating integrated radiation quantities such as irradiance.
The DDR is a function of the solar zenith angle (SZA), thus a single SZA is chosen for the analysis. The smallest SZA reached daily at Lampedusa during the year varies be-tween 12◦ (in June) and 59◦ (in December), and the DDR
is calculated at 60◦SZA to span the entire year of
measure-ments. The comparison of the measurements with the model calculations are performed for both morning and afternoon SZA.
The temperature-dependent ozone cross sections in the vacuum from the SCIAMACHY spectrometer (Bogumil et al., 2003) were converted into cross sections in air at 0.2 nm steps.
The ground albedo of Lampedusa has not been measured; due to the small surface area of the island, a large contribu-tion to the ground reflectivity derives from the sea. Spectral measurements of the open sea albedo require an airborne in-strument or a tower, and are scarce. The surface albedo de-pends on SZA (Payne, 1972); the surface area that influences the downward flux depends on wavelength, being larger for the radiation at short wavelengths. According to Ruggaber et al. (1998) the UV irradiance at a specific point is influ-enced by the albedo of an area with a radius of 20 km. The albedo at Lampedusa is calculated averaging the values for ocean and land, weighted for the respective areas occupied within a radius of 15 km: the resulting albedos correspond to 0.10 at 415.6 nm and 0.07 at 868.7 nm. The ocean albedo is derived form Jin and Charlock (2001), who derive esti-mates in the range 300–800 nm at 60◦ SZA by means of a coupled atmosphere-ocean radiative transfer model. Values of the albedo of a loam soil (as we have supposed for land at Lampedusa) are taken from Feister and Grewe (1995).
Atmospheric aerosols are described in the model by means of the wavelength-dependent optical depth, the asymmetry factor, and the single scattering albedo at each layer. If, as is the case for most of the analysed period, the aerosol verti-cal distribution is not measured, the aerosol profile by Shet-tle (1989) is assumed. Model simulations using measured and climatological aerosol distributions (Meloni et al., 2004) show that visible irradiance at the surface presents a very small dependence on the aerosol vertical profile. We also assume that the single scattering albedo and the asymmetry factor do not vary with altitude.
The AOD measured at Lampedusa from July 2001 to September 2003 around 60◦ SZA varied between 0.03 and 1.16 at 415.6 nm, and between 0.03 and 1.04 at 868.7 nm. Two main aerosol types have been identified, on the basis of ˚Angstr¨om exponent, α, and AOD at 495.7 nm, in con-formity with the classification by Pace et al. (2006): the biomass burning-urban/industrial aerosol (BU), character-ized by α≥1.5 and AOD≥0.1, and the desert dust (DD), iden-tified by α≤0.5 and AOD≥0.15. Values of the asymmetry factor g at 415.6 nm and 868.7 nm have been calculated ac-cording to the Mie theory assuming the aerosol properties given by d’Almeida et al. (1991). For BU aerosol g is ob-tained from the size distribution of urban/industrial aerosol type, composed of water-soluble, soot and dust-like particles (d’Almeida et al., 1991): its values are 0.65 at 415.6 nm, and 0.60 at 868.7 nm. For DD the background desert aerosol by d’Almeida et al. (1991) has been adopted: g is 0.84 at 415.6 nm and 0.73 at 868.7 nm. The sensitivity of SSA to these assumed values of g will be tested in Sect. 3.
The radiative transfer model is run to compute look-up ta-bles for the two aerosol types, expressing DDR as a function of the AOD and SSA at 415.6 and 868.7 nm: variations of the AOD from 0 to 1.2 at 0.2 steps, and SSA values from 0.7 to 1.0 at 0.06 steps, are used. The DDRs are calculated at the central wavelengths of the MFRSR bands, so that no assumptions have to be made either on the aerosol optical properties in other spectral intervals, nor on the instrumental filtering function. The comparison of the measurements with the model results at 60◦SZA is performed averaging the in-stantaneous MFRSR measurements in cloud-free conditions in a 5◦wide SZA interval centred at 60◦.
The total number of cases (BU and DD) is 168. Since the acquisition rate has changed with time, from 10 min to 1 min, and in order to have a sufficient number of values to average, we have chosen SZA intervals of (60±2.5)◦.
Due to the different acquisition rates and to the uneven distribution of SZA values within the averaging interval, it was necessary to apply a correction factor to the mea-surements performed at SZAs other than 60◦. With the aim of accounting for changes of DDR with SZA, the ra-tio DDR(SZA)/DDR(60◦) was calculated by means of the radiative transfer model. Model simulations show that the correction factor does not significantly depend on the aerosol type, while it is quite sensitive to the AOD; for example, for
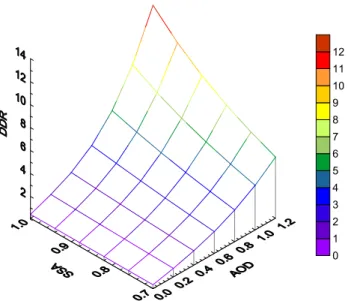
0 1 2 3 4 5 6 7 8 9 10 11 12
Fig. 1. Surface plot of the DDR at 415.6 nm as a function of AOD
and SSA at 60◦SZA. The plot is relative to desert dust.
AOD values of 0.2 the ratio DDR(62◦)/DDR(60◦) is 1.09 at 415.6 nm and 1.06 at 868.7 nm, while for AOD values of 1 the ratio DDR(62◦)/DDR(60◦) is 1.17 at 415.6 nm and 1.13 at 868.7 nm. The ratio calculated at the observation SZA is divided by the observed DDR to derive the DDR at 60◦solar zenith angle. The derived individual values of DDR at 60◦ are then averaged.
A graphical representation of the look-up table for DD at 415.6 nm is shown in Fig. 1. It can be noticed that at low AODs the DDR does not depend on SSA; on the contrary, changes of the SSA produce larger DDR variations at mod-erate and high AOD values. For example, for AOD=0.6 at 415.6 nm a change of SSA from 0.76 to 0.94 determines a 37% increase in DDR. The modelled DDR for each wave-length and aerosol type are fitted with a polynomial surface of the form DDR(AOD,SSA) = 3 X i=0 3 X j =0 aijAODi SSAj. (2)
The coefficients are determined with a least square fit to the modelled data. Once the AOD is fixed to the observed value, the equation reduces to a third order polynomial in SSA, i.e. a monotone function in the interval (0.70, 1.00), for which the number of real zeros in the interval is one or null. The SSA is thus calculated as the solution of the third order polynomial. The sensitivity of the retrieved SSA to the AOD, DDR, g and surface albedo will be discussed at the end of Sect. 3.
The MFRSR is not an ideal Lambertian spectroradiometer, and angular corrections have to be applied to the direct and diffuse signals. The cosine correction is routinely applied to the direct component and not to the diffuse one. The correc-tion of the diffuse component requires the knowledge of the radiance angular distribution, which depends on a number of
parameters that are not directly measured, like the aerosol phase function, vertical distribution, etc.
We performed some tests with the radiative transfer model in order to quantify the impact of the missing correction on the results. We simulated the angular distribution of the dif-fuse radiance at SZA=60◦, and calculated the diffuse irra-diance that would be measured by a sensor with a perfect cosine response, and by a sensor with the cosine response of the MFRSR. The MFRSR cosine response of our instru-ment was measured by the manufacturer; its deviation from the ideal cosine curve is small (i.e. always within ±4% at all wavelengths at 60◦elevation angle). In this study we assume that the MFRSR angular responsivity has not changed since its determination. The possible variation of the instrumental cosine response with time might lead to additional errors not accounted for in the analysis.
In the model simulation we fixed the AOD at 0.6 (a fairly large value) and calculated the DDR at 415.6 and 868.7 nm. Calculation were made for desert dust, due to the fact that for this type of particles the diffuse component is larger than for the other aerosol types considered in our study (i.e. biomass burning or urban/industrial) for the same AOD. Our results show that the DDR for the MFRSR cosine response differ from that of a perfect cosine response instrument by less than 2% at both 415.6 nm and 868.7 nm. The difference increases with AOD. The afternoon DDRs calculated without cosine correction on the diffuse component are lower than the morn-ing DDRs by less than 1% at both wavelengths; this differ-ence is due to the effect of the East-West asymmetry of the cosine response.
Larger differences between observed morning and after-noon values of DDR for the same AOD may be taken as an indication of a degradation of the cosine response. Differ-ences might also be induced by changes in the atmospheric conditions. In order to quantify these differences, morning and afternoon DDR values together were fitted as a func-tion of AOD with a second order polynomial, both at 415.6 and 868.7 nm. The mean (and standard deviation) differ-ences of the observations from the fit are 0.10±0.08 (cor-responding to a percent difference of 6±5) in the morning and 0.10±0.09 (6±5%) in the afternoon at 415.6 nm, and 0.03±0.04 (4±7%) in the morning and 0.03±0.03 (4±4%) in the afternoon at 868.7 nm. Thus, no systematic morning-afternoon differences affect the MFRSR DDR.
The direct component measured by the MFRSR includes the portion of forward scattered radiation that is blocked by the band, which has an umbral angle of 3.27◦. A correction
for the fraction of the diffuse field obscured by the band is implemented in the operational procedure. This correction is done by estimating this contribution as the difference be-tween the global irradiance and the measurement performed when the shadowband blocks a strip of sky 9◦ to the side of the Sun (Harrison et al., 1994). Depending on the prop-erties of the forward scattering peak, this correction may
Table 1. Average and standard deviation of the single scattering
albedo, SSA, at 415.6 nm and 868.7 nm for the two aerosol types: BU refers to biomass burning-urban/industrial aerosol, and DD to desert dust. The averages are calculated over all cases at 60◦SZA in the period July 2001–September 2003. The number of data for each aerosol type is also shown.
Aerosol type N SSA (415.6 nm) SSA (868.7 nm) BU 74 0.87±0.08 0.82±0.07 DD 94 0.81±0.05 0.94±0.05
compensate for a fraction of the forward scattering falling into the band shadow.
Additional analyses were performed to quantify the in-fluence of the forward scattering peak falling into the band shadow on the results. Desert dust is composed of large par-ticles that produce a strong forward scattering peak, and the analysis was carried out for this aerosol type. The angular distribution of the radiance was calculated with the radiative transfer model for AOD equal to 0.40 at 415.6 nm, and equal to 0.36 at 868.7 nm (average conditions for desert dust at Lampedusa). A Mie phase function producing an asymmetry factor of 0.84 at 415.6 nm and 0.73 at 868.7 nm was used in the calculations. The forward peak of the Mie phase function is about one order of magnitude more intense than the one of the Henyey-Greenstein phase function with the same asym-metry factor, confirming that a significant fraction of the for-ward scattering may be obscured by the MFRSR band. We also determined the portion of diffuse irradiance blocked by a shadowing sphere that produces an umbral angle of 3.27◦.
The fraction of diffuse irradiance blocked by the band is 9% at 415.6 nm, and 4.1% at 868.7 nm. The fraction of diffuse ir-radiance blocked by the sphere (i.e. falling within the umbral angle of 3.27◦around the Sun) is 4.4% at 415.6 nm, and 0.4% at 868.7 nm. The corresponding AOD underestimate is 0.02 at 415.6 nm, and 0.002 at 868.7 nm; the DDR underestima-tion is 8.4% at 415.6 nm, and 0.8% at 868.7 nm. The overall effect is an underestimate of the SSA (see the discussion in Sect. 3).
3 Results
Table 1 illustrates the average SSAs retrieved for the two aerosol types over the entire measurement period at the two wavelengths. SSA for desert dust decreases at the short wavelength while, due to the large standard deviations of the results, no significant spectral behaviour is discernable for the biomass burning-urban/industrial aerosol. Situations of Saharan dust outbreaks at Lampedusa are frequent in spring and summer (di Sarra et al., 2001) and characterized by high values of the AOD: among the 94 analysed cases, the average AOD at 415.6 nm is 0.404, with a maximum value of 1.159.
0.1 0.2 0.3 0.4 0.5 0.6 0.7 0.8 AOD 415.6 nm 0.5 1.0 1.5 2.0 2.5 3.0 3.5 4.0 DDR 4 1 5 .6 nm 15-27/06/02 13-15/06/03 29-30/07/02 10-13/07/03 3/06/02 12/06/03 21-22/06/03 20-21/07/03 31/07-04/08/01 17/08/01 26-29/08/01 31/07-03/08/03 5-22/08/03 27/08/03 class a class b
Fig. 2. DDR as a function of AOD measured by the MFRSR
at 415.6 nm at 60◦ SZA, for the episodes of biomass burning-urban/industrial aerosols. Two classes are identified: black, grey, and green symbols are relative to consecutive days belonging to class a; other colours identify consecutive days of class b. Second order polynomial fits (solid curves) for the two classes are shown.
These episodes are clearly detectable also by the backtrajec-tory analysis (Pace et al., 2006). Thus we assume that dust is the prevalent aerosol component carried by the airmasses from the Saharan desert, and determines the optical proper-ties of the aerosol: this reason explains the lower standard deviation of DD SSA in Table 1 with respect to BU aerosol. BU aerosols (74 cases) are almost as common at Lampedusa as Saharan dust, and their average AOD at 415.6 nm is 0.339. Air masses from Europe may carry different aerosol types, for example polluted and continental aerosols with varying fractions, mixed with particles from biomass burning, par-ticularly in summer; thus assuming pure continental aerosol properties could result in a wide range of values of retrieved SSA.
The large uncertainties associated with the SSA for the biomass burning-urban/industrial aerosols suggest that the absorption properties of the aerosol particles for these cases may vary significantly. The DDR at 415.6 nm for the biomass burning-urban/industrial aerosol cases has been examined as a function of the AOD (see Fig. 2). Two classes of data can be clearly identified: at the same value of AOD, DDR for class b is lower than for class a (23% reduction of DDR for AOD of 0.4), indicating that the aerosol particles of class b absorb more radiation than those of class a. It is also relevant that all class a cases occur for AOD<0.4, while class b cases span values of AOD up to 0.8.
In order to explain the differences between the optical properties of class a and b, we examined the airmass tra-jectories ending at Lampedusa in a time period of five con-secutive days, belonging to each class. The Hysplit Disper-sion Model (Draxler and Rolph, 2003), with vertical velocity fields, is used to calculate the airmass backtrajectories. Days with AOD at 415.6 nm lower than 0.25 are disregarded, since
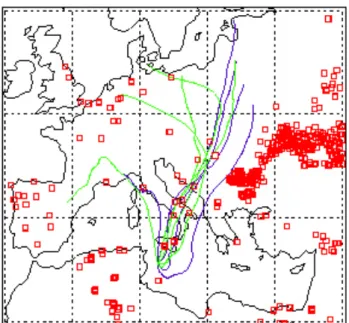
Fig. 3. Backtrajectories ending at Lampedusa at 750 m (blue curves), and at 2000 m (green curves) for periods a1 (24–27 June 2002, left
panel) and a2 (13–16 June 2003, right panel). The location of fires (red open squares) according to the ESA World Fire Atlas for the two periods is shown.
Fig. 4. Backtrajectories ending at 750 m (blue curves) and at 2000 m
(green curves) for period b1 (31 July–4 August 2001). The location of fires (red open squares) according to the ESA World Fire Atlas is shown.
for these cases the two classes are not clearly distinguish-able. The trajectory analysis is carried on in conjunction with the detection of fires from the ESA World Fire Atlas (http://dup.esrin.esa.int/ionia/wfa/index.asp), which locates fires worldwide on the basis of Along Track Scanning Ra-diometer (ATSR-2 until 2002 and AATSR from 2003) obser-vations. The aim of this analysis is to assess the possible role of biomass burning on the observed aerosol SSA at Lampe-dusa.
Two periods representative of class a (period a1, 24–27 June 2002, and period a2, 13–16 June 2003) were identified. Figure 3 displays 5-day trajectories ending at Lampedusa at 750 and 2000 m for the two periods, and the corresponding maps of the active fires detected from ATSR. The fires de-tected during the last 5 days before the arrival of the airmass at Lampedusa on each of the considered days are displayed (i.e. fires occurring between 19 and 26 June 2002 for pe-riod a1, and between 8 and 15 June 2003 for pepe-riod a2). In period a1 the airmasses pass over Sardinia, or originate from the Balkan region and overflow Southern Italy and Sicily on days when fires are not detected. In period a2 trajectories at 750 and 2000 m travel from the Balkan region through Southern Italy and Sicily, where a small number of fires are active. During the days under consideration, and for the en-tire class a, the continental airmasses may have been only slightly affected by biomass burning aerosols, thus we can conclude that their optical characteristics are prevailing of urban/industrial type.
A quite different situation occurred in the selected pe-riod belonging to class b (pepe-riod b1, 31 July–4 August 2001), whose trajectories and corresponding fires are shown in Fig. 4: a large number of active fires in the Balkans, South-ern Italy, Sicily and the coasts of NorthSouth-ern Africa were over-passed by trajectories ending at Lampedusa. The difference with respect to the maps for periods a1 and a2 is evident. During period b1 the airmasses from Eastern Europe pass over Southern Italy and Sicily and are presumably loaded with biomass burning aerosols produced by fires. A sec-ond period correspsec-onding to class b particles, August 2003, is discussed by Pace et al. (2006), and is particularly in-teresting: intense fires developed in Southern Europe, and combustion particles were transported to the Mediterranean
largely influencing the aerosol properties at Lampedusa (see the discussion by Pace et al., 2006). The larger content of ab-sorbing aerosols (black carbon from forest fires) during the days belonging to class b may explain the lower DDR with respect to class a for the same AOD.
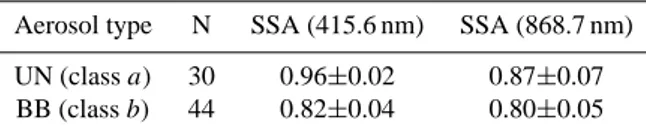
Following this analysis, the SSA has been calculated for class a and b separately, employing the optical properties of urban/industrial (UN) and biomass burning (BB) aerosols, respectively. For biomass burning aerosol the asymmetry factor g is obtained averaging the results (at the wavelengths of 440 and 870 nm) of different studies on the optical proper-ties of smoke aerosols from Amazonia and Africa (Procopio et al., 2003): the resulting values of g are 0.63 at 415.6 nm and 0.53 at 868.7 nm. The results in Table 2 show that the mean SSAs are larger for class a than for class b, and that the uncertainties are reduced compared to those in Table 1, especially for class b.
It is worth noting that the UN and BB cases occur in sum-mer (see Fig. 2), when stable atmospheric conditions and transport of airmasses from Europe to Africa (Duncan and Bey, 2004) led to episodes of polluted aerosols and biomass burning at Lampedusa. As can be seen, the cases belong-ing to class a (black and grey symbols in Fig. 2) occur in June and July. The UN aerosol episode occurring from 15 to 27 June 2002 is remarkable for its duration; the AOD at 415.6 nm spanned values from about 0.15 to 0.4. Episodes of BB aerosols are observed in July and August: however, the largest values of AOD and the longest duration are observed in August, generally the driest month of the year, when the development of fires is favoured. The longest period with BB aerosols at Lampedusa lasted from 5 to 22 August 2003, and is notable for the large values of AOD at 415.6 nm, which ranged from 0.25 to 0.8.
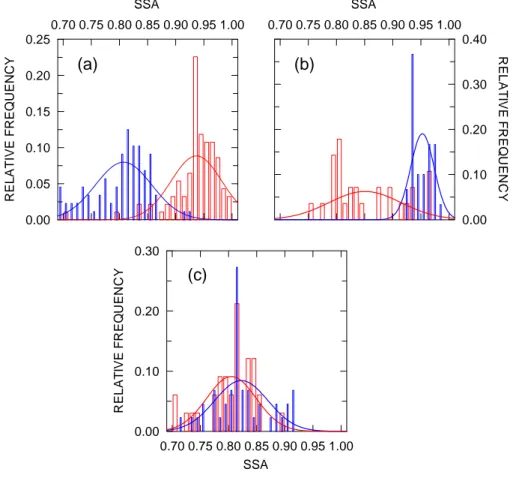
Figure 5 shows the frequency of occurrence of the re-trieved SSA at 415.6 and 868.7 nm for the three aerosol types. The most prominent feature emerging from the graphs is the different wavelength dependence of the SSA for the DD, UN, and BB aerosols, as is also apparent from the aver-age values of Tables 1 and 2. SSA increases with wavelength for DD, and decreases for UN aerosols; no net wavelength-dependence can be detected for BB aerosols.
The SSAs obtained from the analysis have been compared to the values published in the literature. Mie calculations based on the size distribution and refractive index for the desert background aerosol from d’Almeida et al. (1991) give values of SSA of 0.80 at 415.6 nm and 0.98 at 868.7 nm, in agreement with our results. Sokolik and Toon (1996) present the spectral dependence of SSA for various dust models: a wide range of values reflects differences in adopted size dis-tributions and refractive indices. SSA around 400 nm and 900 nm are in the ranges 0.62–0.95 and 0.70–0.95, respec-tively. Moulin et al. (2001) determined the dust absorp-tion in the visible-NIR from SeaWiFS images and estimated SSA for different aerosol size distributions, refractive index and dust vertical distributions; the 18 possible combinations
Table 2. Average and standard deviation of SSA for
ur-ban/industrial UN (class a) and biomass burning BB cases (class
b). The number of data for each aerosol type is also shown.
Aerosol type N SSA (415.6 nm) SSA (868.7 nm) UN (class a) 30 0.96±0.02 0.87±0.07 BB (class b) 44 0.82±0.04 0.80±0.05
gave values in the range 0.82–0.90 in the blue, and in the range 0.92–0.99 around 870 nm. Tanr´e et al. (2001) derived SSA from the AERONET measurements performed at Sal Is-land and the Banizoumbou sites, finding values of 0.94±0.05 and 0.95±0.03 at 441 nm, and 0.96±0.04 and 0.97±0.02 at 870 nm at the two sites. Their results show a lower absorp-tion than that found by Kaufman et al. (2001) in the coast of Senagal from Landsat TM observations; they obtain 0.88 in the blue and 0.98 at wavelengths >670 nm. Dubovik et al. (2002) present optical properties of desert dust obtained from measurements at AERONET sites worldwide: the SSA at 440 nm and 870 nm are 0.92 and 0.96 (±0.03) in the Per-sian Gulf, 0.92 and 0.97 (±0.02) in Saudi Arabia, 0.93 and 0.99 (±0.01) at Cape Verde, and 0.98 and 0.97 (±0.03) at Lanai. Cattrall et al. (2003) show that the absorption by desert dust estimated from remote sensing measurements is smaller than that derived from dust models constructed on the base of laboratory measurements, which range from 0.6 to 0.74 around 400 nm and from 0.92 to 0.98 around 870 nm: at the Dry Tortugas site the SSA at 412 nm and 865 nm is 0.89 and 1.00 (±0.02), respectively. Our results for DD are in agreement, within the estimated uncertainty, with most of the above cited studies at 868.7 nm; the SSA is generally smaller (meaning stronger absorption) at 415.6 nm.
Dubovik et al. (2002) report estimates of SSA for ur-ban/industrial and mixed aerosols at different sites: they ob-tain 0.94 and 0.96 (±0.02) at Greenbelt (MD), 0.94 and 0.92 (±0.03) in Paris, 0.90 and 0.85 (±0.02) at Mexico City, and 0.91 and 0.86 (±0.03) at the Maldives, with the first and sec-ond value at each site derived at 440 and 870 nm, respec-tively. The SSA derived with Mie calculation from the size distribution and the refractive index given by d’Almeida et al. (1991) for the same type of particles, is 0.97 at 415.6 nm and 0.93 at 868.7 nm.
The SSA at two sites, Almer´ıa (Spain) and Vienna (Aus-tria), influenced by continental/polluted aerosols, has been estimated by Horvath et al. (2002); both sites experience dif-ferent aerosol loadings. The SSA at 440 nm varies between 0.86 and 0.92 in Almer´ıa, and between 0.84 and 0.92 in Vi-enna, depending on the aerosol amount and absorption char-acteristics. Horvath et al. (2002) also report that the SSA at 440 nm varies between 0.8 and 0.9 in Central and Southern Europe.
0.00 0.05 0.10 0.15 0.20 0.25 RE L A T IV E F R E Q UE N C Y 0.70 0.75 0.80 0.85 0.90 0.95 1.00 SSA
(a)
0.00 0.10 0.20 0.30 0.40 RE LA T IV E F R E Q UE NCY 0.70 0.75 0.80 0.85 0.90 0.95 1.00 SSA(b)
0.70 0.75 0.80 0.85 0.90 0.95 1.00 SSA 0.00 0.10 0.20 0.30 RE L A T IV E F R E Q UE NCY(c)
Fig. 5. Relative frequency of occurrence of the retrieved SSA at 415.6 nm (blue bars) and 868.7 nm (red bars) for (a) desert dust, (b)
urban/industrial, and (c) biomass burning aerosols. Gaussian fits for the two wavelengths are shown with solid lines.
During the Indian Ocean Experiment (INDOEX) the columnar SSA at 440 nm was derived at a coastal site of In-dia by means of active and passive remote sensing instru-ments ground-based, airborne and spaceborne (L´eon et al., 2002): values for polluted aerosols were found in the range 0.88–0.93, with an uncertainty of 0.04.
The SSA for biomass burning has been derived by Eck et al. (2003a) in various sites in Southern Africa during SA-FARI 2000: they found values between 0.86 and 0.90 at 440 nm, and between 0.80 and 0.85 at 870 nm. The SSA regional variability is attributed to the aging of the aerosol cloud, which leads to modification and contamination of the plume by different aerosol sources. Eck et al. (2003b) dis-cuss SSA estimates at 4 locations where biomass burning episodes were observed, which were characterized by large AODs (from 2.2 to 2.5 at 440 nm): the SSA ranges from 0.85 to 1.0 at 440 nm, and from 0.78 to 1.0 at 870 nm. Dubovik et al. (1998) determined the SSA from AERONET mea-surements of radiance and irradiance at Cuiab´a (Brazil) in the period 1993–1995, and obtained cases of spectral SSA which increase or decrease with wavelength. Biomass burn-ing aerosol SSAs reported by Dubovik et al. (2002) are 0.94
at 440 nm, and 0.91 (±0.02) at 870 nm in the Amazonian Forest of Brazil and Bolivia, 0.91 and 0.87 (±0.03) in the Brazilian cerrado, 0.88 and 0.80 (±0.015) in the African sa-vanna of Zambia, and 0.94 and 0.92 (±0.02) in the Boreal forest of United States and Canada. The average SSA val-ues retrieved by Procopio et al. (2003) at two AERONET sites in Amazonia are 0.93±0.01 at 440 nm and 0.87±0.02 at 870 nm. Bergstrom et al. (2003) found large uncertainties as-sociated with the retrieved SSA. The uncertainties are largest for small AODs. At 450 nm, they found values between 0.79 and 0.92 for low AOD, and between 0.86 and 0.89 for high AOD. At 850 nm, the SSA was in the range 0.36–0.85 for low AOD, and in the range 0.80–0.88 for high AOD.
The previous studies reveal a wide range of variability for the SSA of urban/industrial and biomass burning aerosol; our results are within these ranges at both wavelengths.
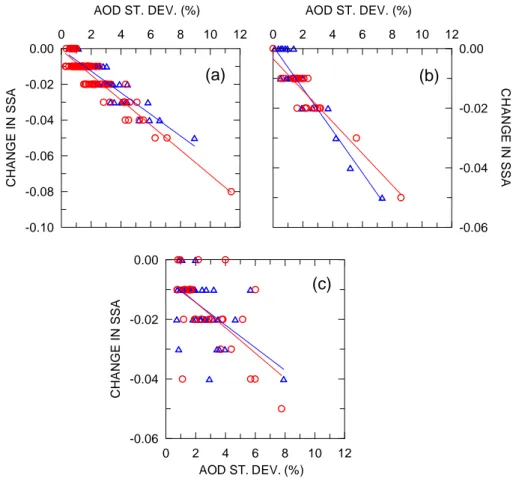
In order to assign an uncertainty on the retrieved SSA, a sensitivity analysis is necessary. The sensitivity to AOD has been tested for the three aerosol types by adding to the aver-age AOD its standard deviation, without changing the DDR. The results are summarized in Table 3, where relatively small variations of the average SSAs appear. If we express the
-0.10 -0.08 -0.06 -0.04 -0.02 0.00 C H A N G E IN S S A 0 2 4 6 8 10 12 AOD ST. DEV. (%)
(a)
-0.06 -0.04 -0.02 0.00 CHA NG E I N S S A 0 2 4 6 8 10 12 AOD ST. DEV. (%)(b)
0 2 4 6 8 10 12 AOD ST. DEV. (%) -0.06 -0.04 -0.02 0.00 C H ANGE I N SSA(c)
Fig. 6. Change in SSA due to a percent increase of AOD for (a) desert dust, (b) urban/industrial, and (c) biomass burning aerosol. Open
triangles refer to 415.6 nm, open circles to 868.7 nm; linear regression lines are shown in corresponding colours.
change in SSA as a function of the percent AOD standard deviation (see Fig. 6), more interesting aspects can be high-lighted. The SSA change seems to follow a linear relation-ship with AOD for all aerosol types, with a change of about
−0.02 at 415.6 and 868.7 nm for a 3% variation in the AOD, and of −0.03/−0.04 for a 5% variation.
We tested the sensitivity of SSA to the DDR using the same approach: the change in SSA due to a one standard deviation increase of the average DDR was calculated keep-ing the AOD fixed at its mean value. As shown in Table 4, the average SSAs do not change remarkably. Figure 7 il-lustrates how the SSA retrieval depends on DDR variation percentages: a 3% increase of DDR induces a change of SSA by about 0.02 for DD and UN aerosols at 415.6 nm and 868.7 nm, while a 5% increase of DDR produces a change by about 0.03–0.04. Data for BB aerosol are more scat-tered, but their average behaviour does not sensibly differ from the other aerosol types. An additional 0.01–0.02 uncer-tainty on the SSA retrieved for medium to high AOD (desert dust cases) is due to the missing cosine correction on the dif-fuse irradiance. The underestimate of SSA due to the difdif-fuse radiation blocked by the shading band is 0.03 at 415.6 nm
and zero at 868.7 nm for the desert dust average AOD (0.40 at 415.6 nm and 0.36 at 868.7 nm).
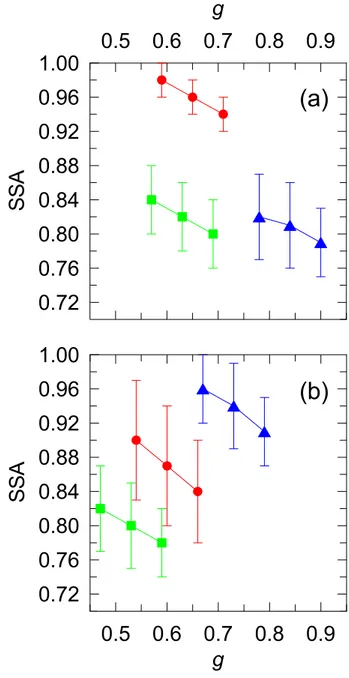
As previously discussed, the asymmetry factor is taken from the literature. We choose a variation of ±0.06 in the value of g to test the change in SSA; differences of ±0.06, in fact, are similar to the change of g corresponding to a change of aerosol type, and can be reasonably considered as the un-certainty on the values of g for a particular aerosol type. The average SSAs at both wavelengths do not vary sensibly for values of g within the ±0.06 interval (see Fig. 8): at 415.6 nm SSA varies by 0.03 for DD (g between 0.78 and 0.90), and by 0.04 for UN (g between 0.59 and 0.71) and BB aerosols (from 0.57 to 0.69), while at 868.7 nm the variations of SSA are 0.05 for DD (g between 0.67 and 0.79), 0.06 for UN (g between 0.54 and 0.66), and 0.04 for BB aerosols (from 0.47 to 0.59).
Finally, the sensitivity of the derived SSA to the assumed surface albedo has been studied increasing by 0.05 the val-ues of 0.10 at 415.6 nm and 0.07 at 868.7 nm. This change corresponds to a 50% and 71% increase of albedo at the two wavelengths, respectively. Table 5 shows that the SSA at 415.6 changes by 0.01 for DD, and by 0.02 for UN and BB
0.00 0.02 0.04 0.06 CHA NG E I N S S A 0 2 4 6 8 10 DDR ST. DEV. (%)
(a)
0.00 0.02 0.04 0.06 CHA NG E I N S S A 0 2 4 6 8 10 DDR ST. DEV. (%)(b)
0 2 4 6 8 10 DDR ST. DEV. (%) 0.00 0.02 0.04 0.06 CHA N G E I N S S A(c)
Fig. 7. Change in SSA due to a percent increase of DDR for (a) desert dust, (b) urban/industrial, and (c) biomass burning aerosol. Open
triangles refer to 415.6 nm, open circles to the 868.7 nm; regression lines are shown in corresponding colours.
Table 3. Average and standard deviation of SSA at 415.6 nm and
868.7 nm, assuming an increase of AOD equal to its standard devi-ation.
Aerosol type SSA (415.6 nm) SSA (868.7 nm) UN 0.95±0.03 0.85±0.08 BB 0.81±0.04 0.79±0.04 DD 0.80±0.04 0.92±0.05
aerosols, while at 868.7 nm the SSA variation is 0.01 for all the aerosol types. Thus, it may be concluded that the uncer-tainty on the albedo does not produce a large variation in the SSA values.
4 Conclusions
In the Central Mediterranean two main aerosol types, in addi-tion to marine and continental/mixed aerosols, have been ob-served to occur: biomass burning-urban/industrial aerosols
Table 4. Average and standard deviation of SSA at 415.6 nm and
868.7 nm, assuming an increase of DDR equal to its standard devi-ation.
Aerosol type SSA (415.6 nm) SSA (868.7 nm) UN 0.97±0.02 0.88±0.06 BB 0.84±0.05 0.83±0.07 DD 0.82±0.05 0.95±0.05
Table 5. Average and standard deviation of SSA at 415.6 nm and
868.7 nm, assuming an increase of surface albedo of 0.05. Aerosol type SSA (415.6 nm) SSA (868.7 nm)
UN 0.94±0.02 0.86±0.07 BB 0.84±0.05 0.79±0.05 DD 0.80±0.04 0.93±0.04
from the European continent, and desert dust from the Sa-haran region. The aerosol classification is based on aerosol optical depth (AOD), ˚Angstr¨om parameter and airmass tra-jectory analysis presented in the companion paper by Pace et al. (2006).
The single scattering albedo (SSA) for these major aerosol types has been estimated using the measurements of direct and diffuse irradiances performed at 60◦ solar zenith angle by a multi-filter rotating shadowband radiometer (MFRSR) at 415.6 nm and 868.7 nm from July 2001 to September 2003. A detailed radiative transfer model has been applied to re-produce the MFRSR diffuse-to-direct ratio (DDR), using the measured AOD as model input. The DDR is the most appro-priate quantity to be compared with radiative transfer simula-tions because it is independent of both calibration constants as well as the extraterrestrial solar spectrum (which has to be assumed in the model). The SSA has been retrieved as the value giving the best match between measurements and model results.
The main results of this study can be summarized in the following points:
1. The average SSA of the desert dust (DD) increases with wavelength from 0.81±0.05 at 415.6 nm to 0.94±0.05 at 868.7 nm; on the contrary, the SSA of the biomass burning-urban/industrial aerosol (BU) presents a large standard deviation and a weak wavelength-dependence. 2. The cases of BU aerosols reveal two distinct absorption capacities for a fixed AOD: the analysis performed by means of airmass backtrajectories ending at Lampedusa permits us to discriminate the cases with prevailing opti-cal characteristics of urban/industrial (UN) type (higher SSA at both wavelengths) and cases of biomass burning (BB) (lower SSA).
3. The average SSA of urban/industrial aerosols repro-duces the spectral behaviour reported in the literature, decreasing from 0.96±0.02 at 415.6 nm to 0.87±0.07 at 868.7 nm; the SSA of biomass burning particles has a weak wavelength-dependence, being 0.82±0.04 at 415.6 nm and 0.80±0.05 at 868.7 nm.
4. The aerosols originating from Europe, UN and BB, are mainly detected at Lampedusa during the cloud-free days of summer, when stable atmospheric conditions and transport of airmasses from Europe to Africa oc-cur. The episodes of UN aerosols are found in June and July, while those of BB with the largest AOD and dura-tion are observed in August, generally the driest month of the year, when the development of fires is favoured. 5. Sensitivity studies have been performed in order to
check how the uncertainties of the measured AOD and DDR, and of the assumed asymmetry factor g and sur-face albedo influence the retrieved SSA. The results show that a 3% variation in the AOD or DDR produces
0.72
0.76
0.80
0.84
0.88
0.92
0.96
1.00
SSA
0.5 0.6 0.7 0.8 0.9
g
0.5 0.6 0.7 0.8 0.9
g
0.72
0.76
0.80
0.84
0.88
0.92
0.96
1.00
SSA
(a)
(b)
Fig. 8. Average SSA obtained for the assumed asymmetry factor g,
and for g±0.06 for (a) 415.6 nm and (b) 868.7 nm. Error bars indi-cate the standard deviation on SSA. Blue triangles represent desert dust, red circles urban/industrial, and green squares biomass burn-ing aerosol.
a change in SSA of about 0.02 at 415.6 and 868.7 nm. The average SSAs at both wavelengths do not sensi-bly vary for values of g within the interval g±0.06: the variations are 0.03–0.04 at 415.6 nm, and 0.04–0.06 at 868.7 nm. The influence of the surface albedo has been tested, increasing the assumed values by 0.05: the re-sulting changes in SSA are between 0.01 and 0.02.
Acknowledgements. This study was supported by the Italian
Ministry for the Environment. We gratefully acknowledge the NOAA Air Resources Laboratory (ARL) for the provision of the HYSPLIT transport and dispersion model, and of the READY website (http://www.arl.noaa.gov/ready.html), whose results are used in this publication. Appreciation is expressed to the ATSR World Fire Atlas provided by the European Space Agency – ESA/ESRIN (Frascati). Thanks are due to N. Reitzug for final editing of the manuscript.
Edited by: W. Conant
References
Bergstrom, R. W., Russell, P. B., and Hignett, P.: Wavelength de-pendence of the absorption of black carbon particles: predictions and results from the TARFOX experiment and implications for the single scattering albedo, J. Atmos. Sci., 59, 567–577, 2002. Bergstrom, R. W., Pilewskie, P., Schmid, B., and Russell, P. B.:
Estimates of the spectral aerosol single scattering albedo and aerosol radiative effects during SAFARI 2000, J. Geophys. Res., 108(D13), 8474, doi:10.1029/2002JD002435, 2003.
Bogumil, K., Orphal, J., Homann, T., Voigt, S., Spiet, P., Fleis-chmann, O. C., Vogel, A., Hartmann, M., Kromminga, H., Bovensmann, H., Frerick, J., and Burrows, J. B.: Measure-ments of molecular absorption spectra with the SCIAMACHY pre-flight model: instrument characterization and reference data for atmospheric remote-sensing in the 230–2380 nm region, J. Photochem. Photobiol. A, 157(2–3), 167–184, 2003.
Cattrall, C., Carder, K. L., and Gordon, H. R.: Columnar aerosol single-scattering albedo and phase function retrieved from sky radiance over the ocean: measurements of Saharan dust, J. Geo-phys. Res., 108(D9), 4287, doi:10.1029/2002JD002497, 2003. Conant, W. C., Seinfeld, J. H., Wang, J., Carmichael, G. R., Tang,
Y., Uno, I., Flatau, P. J., Markowicz, K. M., and Quinn, P. K.: A model for the radiative forcing during ACE-Asia derived from CIRPAS Twin Otter and R/V Ronal H. Brown data and com-parison with observations, J. Geophys. Res., 108(D23), 8661, doi:10.1029/2002JD003260, 2003.
d’Almeida, G. A., Koepke, P., and Shettle, E. P.: Atmospheric Aerosols Global Climatology and Radiative Characteristics, A. Deepak, Hampton, Virginia, 1991.
Di Iorio, T., di Sarra, A., Junkermann, W., Cacciani, M., Fiocco, G., and Fu`a, D.: Tropospheric aerosols in the Mediterranean: 1. Mi-crophysical and optical properties, J. Geophys. Res., 108(D10), 4316, doi:10.1029/2002JD002815, 2003.
di Sarra, A., Di Iorio, T., Cacciani, M., Fiocco, G., and Fu`a, D.: Sa-haran dust profiles measured by lidar at Lampedusa, J. Geophys. Res., 106, 10 335–10 348, 2001.
di Sarra, A., Cacciani, M., Chamard, P., Cornwall, C., DeLuisi, J. J., Di Iorio, T., Disterhoft, P., Fiocco, G., Fu`a, D., and Monteleone, F.: Effects of desert dust and ozone on the ultraviolet irradiance at the Mediterranean island of Lampedusa during PAUR II, J. Geo-phys. Res., 107(D18), 8135, doi:10.1029/2000JD000139, 2002. Draxler, R. R., and Rolph, G. D.: HYSPLIT (HYbrid
Single-Particle Lagrangian Integrated Trajectory) model, http://www. arl.noaa.gov/ready/hysplit4.html, NOAA Air Resour. Lab., Sil-ver Spring, MD, 2003.
Drummond, A. J. and Thekaekara, M. P.: The Extraterrestrial So-lar Spectrum, Eds. Institute of Environmental Sciences, Mount Prospect Illinois, 1973.
Dubovik, O., Holben, B. N., Kaufman, Y. J., Yamasoe, M., Smirnov, A., Tanr´e, D., and Slutsker, I.: Single-scattering albedo of smoke retrieved from the sky radiance and solar transmittance measured from ground, J. Geophys. Res., 103(D24), 31 903–31 923, 1998. Dubovik, O., Holben, B. N., Eck, T. F., Smirnov, A., Kaufman, Y. J., King, M. D., Tanr´e, D., and Slutsker, I.: Variability of ab-sorption and optical properties of key aerosol types observed in worldwide locations, J. Atmos. Sci., 59, 590–608, 2002. Duncan, B. N. and Bey, I.: A modelling study of the export
pathways of pollution from Europe: Seasonal and interan-nual variation (1987–1997), J. Geophys. Res., 109, D08301, doi:10.1029/2003JD004079, 2004.
Eck, T. F., Holben, B. N., Ward, D. E., et al.: Variability of biomass burning aerosol optical characteristics in southern Africa during the SAFARI 2000 dry season campaign and a comparison of sin-gle scattering albedo estimates from radiometric measurements, J. Geophys. Res., 108(D13), 8477, doi:10.1029/2002JD002321, 2003a.
Eck, T. F., Holben, B. N., Reid, J. S., O’Neill, N. T., Shafer, J. S., Dubovik, O., Smirnov, A., Yamasoe, M. A., and Artaxo, P.: High aerosol optical depth biomass burning events: A compar-ison of optical properties for different source regions, Geophys. Res. Lett., 30(20), 2035, doi:10.1029/2003GL017861, 2003b. Feister U. and Grewe, R.: Spectral albedo measurements in the UV
and visible region over different types of surfaces, Photochem. Photobiol., 62, 736–744, 1995.
Formenti, P., Boucher O., Reiner, T., et al.: STAAARTE-MED 1998 summer airborne measurements over the Aegean Sea. 2. Aerosol scattering and absorption, and radiative calculations, J. Geophys. Res., 107(D21), 4451, doi:10.1029/2001JD001536, 2002. Halthore, R. N., Miller, M. A., Ogren, J. A., Sheridan, P. J.,
Slater, D. W., and Stoffel, T.: Further developments in clo-sure experiments for surface diffuse irradiance under cloud-free skies at a continental site, Geophys. Res. Lett., 31, L07111, doi:10.1029/2003GL019102, 2004.
Herman, B. M., Browning, R. S., and DeLuisi, J. J.: Determination of the effective imaginary term of the complex refractive index of atmospheric dust by remote sensing: the diffuse-to-direct ra-diation method, J. Atmos. Sci., 32, 918–925, 1975.
H¨oller, R., Ito, K., Tohno, S., and Kasahara, M.: Wavelength-dependent aerosol single-scattering albedo: Measurements and model calculations for a coastal site near the Sea of Japan during ACE-Asia, J. Geophys. Res., 108(D23), 8648, doi:10.1029/2002JD003250, 2003.
Horvath, H., Arboledas, L. A., Olmo, F. J., Jovanovic, O., Gangl, M., Kaller, W., Sanchez, C., Sauerzopf, H., and Seidl, S.: Op-tical characteristics of the aerosol in Spain and Austria and its effect on radiative forcing, J. Geophys. Res., 107(D19), 4386, doi:10.1029/2001JD001472, 2002.
Jin, Z. and Charlock, T.: Radiative transfer modeling of ocean sur-face albedo for CERES SARB, Co-Investigator Report at 23rd CERES Science Team Meeting, Williamsburg, Virginia, 23–25 January 2001.
Kaufman, Y. J., Tanr´e, D., Dubovik, O., Karnieli, A., and Remer, L. A.: Absorption of sunlight by dust as inferred from satellite and ground-based remote sensing, Geophys. Res. Lett., 28, 1479–
1482, 2001.
Kouvarakis, G., Doukelis, Y., Mihalopoulos, N., Rapsomanikis, S., Sciare, J., and Blumthaler, M.: Chemical, physical, and optical characterization of aerosols during PAUR II experiment, J. Geo-phys. Res., 107(D18), 8141, doi:10.1029/2000JD000291, 2002. Kurucz, R. L.: Synthetic infrared spectra, in: Infrared Solar Physics,
IAU Symposium 154, edited by: Rabin, D. M. and Jefferies, J. T., Kluwer, Dordrecht, 523–531, 1992.
L´eon, J.-F., Chazette, P., Pelon, J., Dulac, F., and Randriami-arisoa, H.: Aerosol direct radiative impact over the INDOEX area based on passive and active remote sensing, J. Geophys. Res., 107(D19), 8006, doi:10.1029/2000JD000116, 2002. Mayer, B., Seckmayer, G., and Kylling, A.: Systematic long-term
comparison of spectral UV measurements and UVSPEC mod-elling results, J. Geophys. Res., 102, 8755–8767, 1997. Meloni, D., di Sarra, A., DeLuisi, J. J., Di Iorio, T., Fiocco,
G., Junkermann, W., and Pace, G.: Tropospheric aerosols in the Mediterranean: 2. Radiative effects through model simu-lations and measurements, J. Geophys. Res., 108(D10), 4317, doi:10.1029/2002JD002807, 2003.
Meloni, D., di Sarra, A., Di Iorio, T., and Fiocco, G.: Influence of the vertical profile of Saharan dust on the visible direct radiative forcing, J. Quant. Spectros. Radiat. Transfer, 93, 397–413, 2005. Moulin, C., Gordon, H. R., Banzon, V. F., and Evans, R. H.: As-sessment of Saharan dust absorption in the visible from SeaWiFS imagery, J. Geophys. Res., 106(D16), 18 239–18 249, 2001. Pace, G., di Sarra, A., Meloni, D., Piacentino, S., Chamard,
P.: Aerosol optical properties at Lampedusa (Central Mediter-ranean). 1. Influence of transport and identification of different aerosol types, Atmos. Chem. Phys., 6, 697–713, 2006.
Payne, R. E.: Albedo of the sea surface, J. Atmos. Sci., 29, 959– 970, 1972.
Petters, J. L., Saxena, V. K., Slusser, J. R., Wenny, B. N., and Madronich, S.: Aerosol single scattering albedo re-trieved from measurements of surface UV irradiance and a radiative transfer model, J. Geophys. Res., 108(D9), 4288, doi:10.1029/2002JD002360, 2003.
Procopio, A. S., Remer, L. A., Artaxo, P., Kaufman, Y. J., and Holben, B. N.: Modeled spectral optical properties for smoke aerosols in Amazonia, Geophys. Res. Lett., 30, 2265, doi:10.1029/2003GL018063, 2003.
Ruggaber, A., Reuder, J., Schwander, H., and Koepke, P.: Spec-tral ground albedo in the UV-range, paper presented at European Conference on Atmospheric UV Radiation (ECUV), Helsinki, Finland, 1998.
Russell, P. B., Redemann, J., Schmid, B., et al.: Comparison of aerosol single scattering albedo derived by diverse techniques in two North Atlantic experiments, J. Atmos. Sci., 59, 609–619, 2002.
Shettle, E. P.: Models of aerosols, clouds and precipitation for at-mospheric propagation studies, in Atat-mospheric propagation in the UV, visible, IR and MM-region and related system aspects, AGARD Conference Proceedings, 15-1–15-13, 1989.
Silva, A. M., Bugalho, M. L., Costa, M. J., von Hoyningen-Huene, W., Schmidt, T., Heintzenberg, J., and Henning, S.: Aerosol op-tical properties from columnar data during the second Aerosol Characterization Experiment on the south coast of Portugal, J. Geophys. Res., 107(D22), 4642, doi:10.1029/2002JD002196, 2002.
Sokolik, I. N. and Toon, O. B.: Direct radiative forcing by anthro-pogenic airborne mineral aerosols, Nature, 381, 681–683, 1996. Stamnes, K., Tsay, S.-C., Wiscombe, W., and Jayaweera, K.: Nu-merically stable algorithm for discrete-ordinate-method radiative transfer in multiple scattering and emitting layered media, Appl. Opt., 27, 2502–2509, 1988.
Tanr´e, D., Kaufman, Y. J., Holben, B. N., Chatenet, B., Karnieli, A., Lavenu, F., Blarel, L., Dubovik, O., Remer, L. A., and Smirnov, A.: Climatology of dust aerosol size distribution and optical properties derived from remotely sensed date in the solar spec-trum, J. Geophys. Res., 106(D16), 18 205–18 217, 2001. Zerefos, C. S., Kourtidis, K. A., Melas D., et al.: Photochemical
Ac-tivity and Solar Ultraviolet Radiation (PAUR) Modulation Fac-tors: An overview of the project, J. Geophys. Res., 107(D18), 8134, doi:10.1029/2000JD000134, 2002.