HAL Id: hal-00852263
https://hal.archives-ouvertes.fr/hal-00852263
Submitted on 23 Aug 2013
HAL is a multi-disciplinary open access
archive for the deposit and dissemination of
sci-entific research documents, whether they are
pub-lished or not. The documents may come from
teaching and research institutions in France or
abroad, or from public or private research centers.
L’archive ouverte pluridisciplinaire HAL, est
destinée au dépôt et à la diffusion de documents
scientifiques de niveau recherche, publiés ou non,
émanant des établissements d’enseignement et de
recherche français ou étrangers, des laboratoires
publics ou privés.
Availability Modelling of a Virtual Black Box for
Automotive Systems
Ossama Hamouda, Mohamed Kaâniche, Karama Kanoun
To cite this version:
Ossama Hamouda, Mohamed Kaâniche, Karama Kanoun. Availability Modelling of a Virtual Black
Box for Automotive Systems. The 2nd International Workshop on Software Engineering for Resilient
Systems (SERENE’10), Apr 2010, Londres, United Kingdom. pp.52-60, �10.1145/2401736.2401742�.
�hal-00852263�
Availability Modelling of a Virtual Black Box for
Automotive Systems
Ossama Hamouda
1,2, Mohamed Kaâniche
1,2, and Karama Kanoun
1,21
CNRS; LAAS; 7, avenue du Colonel Roche, F-31077 Toulouse, France
2
Université de Toulouse; UPS, INSA, INP, ISAE; LAAS-CNRS : Toulouse, France
Email: {ossama.hamouda, mohamed.kaaniche, karama.kanoun}@laas.fr
ABSTRACT
Recent developments in automotive systems recommend storing historical information in a black box, in a manner that is similar to the avionics domain. The idea is to record relevant information about the vehicle that can be retrieved in case of a problem. However, instead of using a classical hardware based black-box that could induce a high cost, a more cost effective solution would be to use a software based mechanism that consists in storing the recorded data on a dedicated server at the fixed infrastructure. To protect the data against potential losses before an access to the fixed infrastructure is available, the data can be replicated and temporarily stored on neighbouring encountered vehicles using wireless communication technologies, before being permanently saved on the server. The aim of this paper is to analyse and evaluate the availability of the historical data recorded in the virtual black-box, (VBB) taking into account possible data replication strategies, and various mobility scenarios, using Stochastic Activity Networks (SAN).
Categories and Subject Descriptors
C.4 [Performance of Systems]: –Modeling techniques –
Reliability, availability, and serviceability –Fault tolerance; I.6.0
[Simulation and Modeling]: General; C.2.1
[Computer-Communication Networks]: Network Architecture and Design –
Wireless communication;
General Terms
Design, Security, Performance.
Keywords
Modelling, Evaluation, SAN, Mobile-based Systems, C2C Communication
1. INTRODUCTION
Wireless and mobile communication technologies have opened new opportunities for the development of innovative services in
vehicular applications. Such services that can be accessed through a combination of ad-hoc and infrastructure based communication networks, cover a large variety of domains including information and entertainment (voice and video streaming, online gaming, contextual information delivery, etc.), as well as safety and dependability critical services (hazard warning, safety and traffic management, etc.). This fast growing area provides great opportunities but also poses significant challenges from the dependability point of view. For example, automated highways or platooning applications could constitute an efficient solution to the increasing traffic congestion in urban areas [15, 18]. On the other side, such solutions may induce safety problems (due for example to the loss of communications for vehicles coordination or to malicious threats) that should be dealt with as early as possible in the design phase. Recording important historical information about the state of the vehicles to be retrieved should provide valuable support that could be used to improve the whole system, or even by the insurance companies, in case of problems.
According to [16, 17], in spite of slightly decreasing number of accidents, there is still a yearly total of 1.3 million traffic accidents with personal injuries in the EU with 45000 people killed and more than 1.6 million people injured. For this purpose, in this paper, we concentrate on important information related to a vehicle and its environment, in a manner that is similar to the black box of an aircraft. However, instead of a robust and expensive hardware black box, the data storage is based on a more cost effective software solution, that is reliable too. Periodically, historical data items about the vehicle’s state (speed and movements of the Vehicle, actuation of brakes, direction indicator, light, and throttle position(s), etc.) are recorded and can be replayed in the event of an accident [14]. Typically, the data recorded just before the accident is critical and is very valuable for accident investigation. Information collected on a relatively long period of time may be useful to trace back possible progressive degradation within the vehicle and provide feedback to the driver. Other information may support the vehicle constructor to improve the vehicle design. In this paper we put emphasis on the first category of data. i.e., data related to accident investigation.
Due to the limited storage facilities within the vehicle, and to the fact that in case of an accident the data stored on the vehicle can be lost, the virtual black box is resident on the fixed infrastructure (that is usually available for other purposes such as coordination of the traffic or for the communications between the vehicles [15]).
To increase the availability of the virtual black box (VBB), the data related to the concerned vehicle, referred to as the Vehicle, is
Permission to make digital or hard copies of all or part of this work for personal or classroom use is granted without fee provided that copies are not made or distributed for profit or commercial advantage and that copies bear this notice and the full citation on the first page. To copy otherwise, to republish, to post on servers or to redistribute to lists, requires prior specific permission and/or a fee.
SERENE '10, 13-16 April 2010, London, United Kingdom
replicated temporarily on vehicles encountered by the Vehicle, referred to as participant vehicles (or participants). Various data replication algorithms can be used to protect the data against accidental and malicious threats, before they are permanently stored on the fixed infrastructure. The efficiency of such solutions depends on the data replication strategy itself and on various environmental factors, such as the rates at which connections occur with the fixed infrastructure and between the vehicles in the
ad-hoc domain, and the reliability of the communications.
This paper presents a dependability model based on Stochastic Activity Networks to compare different replication strategies and to understand how different mobility scenarios can affect the data availability in the context of the virtual black box application. The effect of mobility is studied by considering different distribution laws to describe the vehicle-to-vehicle encountering process.
The paper is structured into 5 sections. Section 2 presents background information about: i) the VBB application and the data replication strategies analysed in this study, and ii) the mobility models characterizing the encounter processes. Section 3 presents the dependability model and the quantitative measures assessed. Section 4 discusses the main results and Section 5 summarizes the main conclusions.
2. BACKGROUND
In this section, we summarize the main characteristics of the VBB application and the mobility scenarios, considered in our study.
2.1 THE VIRTUAL BLACK BOX
APPLICATION
The Vehicle periodically and almost continuously collects data items in the form of records. A record gathers information related to the Vehicle speed and movements, actuation of brakes, direction indicator, light, throttle position(s), etc. Typically, the size of one record is about 5 kilo bytes.
From a practical point of view, the last successive data records generated during the last 15 to 30 seconds before the accident form a full set of data allowing tracing back the accident. Let z be the number of records during this period of time. As the data is updated very frequently, the loss of a small number of data records, among this full set of data, may not affect significantly the accuracy of the collected information. Particularly, when we need to understand what had happened just before the occurrence of an accident, it could be sufficient to analyse only r records among the last z records generated before the accident.
Primarily, the records are stored in the Vehicle itself, before being delivered to the fixed infrastructure as soon as a service access point is encountered to complement and update the VBB. Between two updates, the most recent information that is critical in case of an accident is only in the Vehicle itself, and there is a high probability that it will be lost due to the accident. The idea is to take advantage of surrounding vehicles encountered to replicate safely the data before being transmitted to the fixed infrastructure. The temporary data can be transmitted to the fixed infrastructure either by the Vehicle or by the participant vehicles.
Replication of the data records may be handled either by creating full copies of the records (we refer to this as replication
by duplication) or by more sophisticated mechanisms using a replication by fragmentation strategy to protect the data records
against accidental as well as malicious threats, in the same way as in [2].
The replication by fragmentation strategy is based on the erasure coding techniques that are well suited to ensure data availability and confidentiality in the presence of permanent failures [8, 9]. Let us consider a data record collected by the Vehicle at a given time that must be saved at the fixed infrastructure via some participant vehicles. An erasure coding algorithm with parameters n and k (n ! k), produces n fragments of the original record that are scattered among surrounding vehicles. An optimal erasure code allows (n–k) failures (or erasures) to be tolerated (beside that of the primary replica), i.e., k fragments are necessary and sufficient to recover the original data record [10].
Wherever a participant vehicle gains access to the fixed infrastructure, it transfers all the data fragments that are replicated on its storage facilities. In particular, in case of an accident, it is expected that all the fragments on the participant vehicles will eventually be delivered to the fixed infrastructure to be used for the analysis.
We consider that every encounter between vehicles offers a storage opportunity. Specially, every vehicle encountered is considered to be a participant vehicle that unconditionally accepts storage requests from the Vehicle. The Vehicle unconditionally sends one data fragment to each vehicle encountered. Note that scenarios in which not all encounters offer storage opportunities (e.g., with vehicles refusing to cooperate) can be simply modeled by introducing a participant/encounter ratio as an additional parameter.
Replication by duplication of the data corresponds to the case
n=k=1.
To sum up, the VBB information that is on the fixed infrastructure is composed of the records related to the state of the Vehicle. The last z successive records are analysed in case of an accident (or at least r records among this full set). A record is produced by the Vehicle. It is either delivered directly to the fixed infrastructure by the Vehicle itself, or it is divided into n fragments that are scattered among surrounding vehicles, to be delivered to the fixed infrastructure. A record can be reconstituted based on at least k fragments in the fixed infrastructure. If less than k fragments reach the fixed infrastructure, the record is considered as lost.
The objective of the dependability model presented in this paper is to quantify the availability of the VBB application and to analyse the impact of the parameters z and r, and the parameters n,
k of the erasure coding algorithm, under different mobility
scenarios presented in the next section.
2.2 MOBILITY MODELS
The data availability of the VBB application clearly depends on the mobility of the vehicles and their connectivity dynamics, in particular, the rate at which the vehicles meet and the rate at which they meet an access point of the fixed infrastructure. These characteristics depend on the type of the environment (a highway, an urban area, a geographic area with a low density of cars, etc.).
Several studies have been carried out to analyse the connectivity characteristics of mobile nodes using simulation,
real-traces or analytical proofs. As an example, the results reported in [4-8] - based on realistic mobility simulations and analytical proofs – were carried out considering different mobility scenarios. Each of these papers discusses a distribution law for a specific type of traffic model. For example, [4] and [5] discuss and focus on the analysis of some connectivity characteristics in dynamic vehicular communication scenarios, in particular for a two highway lanes opposite in direction [4] and same in direction [5]. Using analytical proofs and simulation experiments, it is shown that under some key assumptions on the movements and the placement of the vehicles, the process that models the encounter of a vehicle with another can be approximated as a stationary or a non-homogeneous Poisson process [4].
The studies reported in [6, 7] apply an analytical methodology to derive closed form equations for popular mobility models for encounter-based protocol and urban mesh networks. Nevertheless, as mentioned in [6, 7], it seems that there are still different opinions about which of the two distributions (Pareto or
exponential) applies for describing the encountering process, and
the debate regarding this point is ongoing. Thus, in this paper we consider both distributions and we analyse their impact in the context of the virtual black-box application.
With respect to the process that models the connection of a vehicle to the fixed infrastructure; [5] shows that this process can be modeled by a Poisson distribution too, in urban networks. A similar conclusion is derived in [4] in the case of a highway mobility scenario.
3. AVAILABILITY MODELING
In this section, we present i) the measure that will be evaluated to analyse the availability of the VBB application, and ii) an availability model based on Stochastic Activity Networks (SAN) [1] allowing the evaluation of this measure, considering the scenario described in Section 2.
We analyse the unavailability of the VBB application via the evaluation of the probability of data loss, i.e., the asymptotic probability, noted UA, of reaching a state where more than r data records among z records generated during a certain time interval are lost before being delivered to the fixed infrastructure.
Stochastic Activity Networks (SAN) are well suited to evaluate the data availability of the VBB application taking into account the considerations mentioned above. This formalism and the associated Möbius tool [11] provide compositional operators that are useful to master the complexity of the models, both at model construction and model processing phase. In particular, the system model can be built by the composition of atomic models using Join and Replicate operators.
In the remaining of this section, we first present an overview of the system model, then we give more details on the various sub-models.
3.1 SYSTEM MODEL OVERVIEW
Figure 1 shows the overall structure of the model describing the VBB application. The model includes z replicas of the One_record sub model that are composed with two other sub models: Records_generation and Severity.
The One_recordsub model describes the behavior of a record as resulting from its data loss modes and the associated data
replication strategy presented in Section 2. The Severity sub model describes the impact of multiple data losses of data records in the system. The sub model Record_generation is used to model and manage the records generated by the Vehicle in the absence of data loss, to initialize the other sub models and to synchronize their evolution according to the whole system evolution.
Figure 1. Model structure.
3.2 THE SUB MODELS DESCRIPTION
Considering the discussion in Section 2, our study is based on the following assumptions:• Failures affecting the vehicles leading to the loss of a data record (at the Vehicle or at the participant vehicles) follow an exponential distribution with rate !.
• Vehicle-to-Vehicle encounters are described by: i) an
exponential distribution with rate !, or
ii) a Pareto distribution with shape parameter p and scale s.
• Vehicle-to-Infrastructure encounters follow an exponential distribution with rate ".
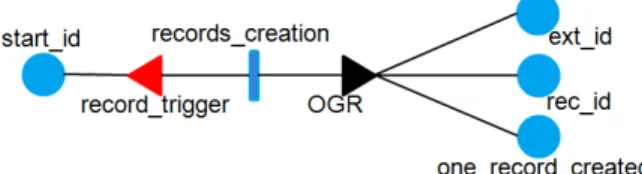
Figure 2. One_record SAN model.
One_record: The SAN sub model shown in Figure 2 describes the replication and scattering process for an (n,k) erasure code for one record created by the Vehicle. The model focuses on the vehicular ad-hoc part of the VBB application, purposefully ignoring issues related to the implementation of the fixed infrastructure functionalities. Thus, one fragment of one disseminated record is considered “safe” (i.e.,
it cannot be lost) whenever either its creator “the Vehicle” or a participant vehicle storing it is able to access the fixed infrastructure. In other words, the server of the fixed infrastructure of the VBB application is assumed to be very reliable (i.e., it has enough redundancy and fault tolerance mechanisms to ensure a very low failure rate that can be neglected). Finally, we assume that when a participant vehicle fails before reaching the fixed infrastructure, all the fragments it holds are lost.
Thus, with (n,k) erasure coding, one record is definitely lost if
and only if the record on the Vehicle is lost and less than k
fragments of the data record are available on the participants and at the fixed infrastructure.
The One_record sub model consists of three main processes represented by timed activities:
A: the vehicle-to-vehicle encounter process; depending on the considered mobility scenario, A is either modelled by an
exponential distribution with a constant rate ! or by a Pareto distribution with parameters p and s.
B: the vehicle-to-infrastructure encounter process, represented by (Bv, Bp) with rates ". Bv is for the Vehicle and Bp is for the participants.
C: the data loss process, at the Vehicle (Dv) and the participants side (Dp); both have exponential distributions with constant rate #.
The sub model in Figure 2 is divided into two interacting subnets.
The subnet on the left describes the evolution of a data record at the Vehicle side: either it is lost (with rate ! “activity Dv”), or it reaches the fixed infrastructure (with rate " “activity Bv”). Places one_record_created and OD denote situations where the data record on the Vehicle is “available” or “is lost”, respectively. When a record is created, the place one_record_created will be marked with one token (see Records_generation submodel).
The subnet on the right describes: (i) the data encoding process with an erasure code (n,k) leading to the creation of “fragments” (place MF) on participant vehicles as they are encountered (activity ‘A’), and (ii) the process leading to the storage of the fragments (place SF) at the fixed infrastructure (rate " “activity Bp”), or its loss caused by the failure of the participant vehicle (rate ! “activity Dp”). At the top of the right-hand side subnet is place FC whose initial marking denotes the number of fragments to create (n). The transition rates associated with the loss of a fragment or its storage on the fixed infrastructure are weighted by the marking of place MF, i.e., the number of fragments that can enable the corresponding transitions. The timed activity ‘A’ will be fired when the place one_record_created is marked and still there are fragments to distribute to participants (i.e., place FC marked). This is managed by the predicates in the input and output gates, IA and OA, respectively. The firing of activity ‘A’ decrements the marking of place FC by one, increments the marking of place MF by one, and without affecting the marking of place one_record_created again.
Two places with associated immediate activities (T_DS, T_DL) are used in the sub model to identify when the data record is safely stored in the fixed infrastructure (place DS), or is definitely lost (place DL), respectively. The “data safe” state is reached (i.e., DS is marked) when the original data record from the Vehicle or at least k fragments from the participants reach the fixed infrastructure. The “data loss” state is reached (i.e., DL is
marked) when the original data record from the Vehicle is lost, and less than k fragments are available on the participants and at the fixed infrastructure side. This condition is represented by a predicate associated with the input gate (T1). Finally, the predicates and the functions associated with the output gates (OBv, ODp, OBp) and the input gates (DBv, DBp, T2) manage the sub model by applying “liveliness predicate”, true if and only if m(DS) = m(DL) = 0: as soon as either DS or DL contains a token, no activity can be fired in this submodel.
Place Rec_id saves the ID of each data record generated in the system. Place Start_id is used for the initialization of the sub model (i.e., a new One_record is generated). When the place DL is marked for an One_record submodel and still the system generating the records is available, another record will be generated by adding one token to the place Start_id.
Figure 3. Severity SAN model.
Severity: This sub model presented in Figure 3 describes how
the combination of individual record losses could bring the system to total loss situations as described in Section 2.1.
The system_available place is initially marked by one token. The predicates and functions associated with the input gate IG in this sub model describe the impact on the global availability of multiple losses affecting several records. When the instantaneous activity to_KO is fired, the system_unavailable becomes marked indicating that the VBB application has reached an unavailable state and has less than r safe records.
Records_generation: This submodel, presented in Figure 4, is
used to define the initial configuration of the records and to initialize the One_record submodels associated with each participant vehicle. For the Vehicle, up to z records are generated during a certain time interval. Thus the system model is composed of z replicas of the One_record submodel.
Figure 4. Records_generation SAN model.
The Record_generation submodel contains four places; all of them have initially zero token except Start_id that has one token. Places (Start_id, Rec_id, and one_record_created) are shared with the corresponding One_record submodel replicas included in the configuration of the VBB. The place ext_id is a global place shared by all sub models, to act as a counter. Initially z replicas are created. Each time the timed activity records_creation is fired; a new record is generated and assigned a rec_id. Also place one_record_created is marked to initialize the One_record submodel associated with this record. The ID assigned to the record is stored in the place rec_id. When a new record is created, rec_id gets the value stored in ext_id, which in
turn is incremented by one. Moreover, the predicates in the input gate record_trigger are used for managing the z records generation, and for stopping all generation when the system arrives to the unavailable state (i.e., system_unavailable is marked in Severity submodel).
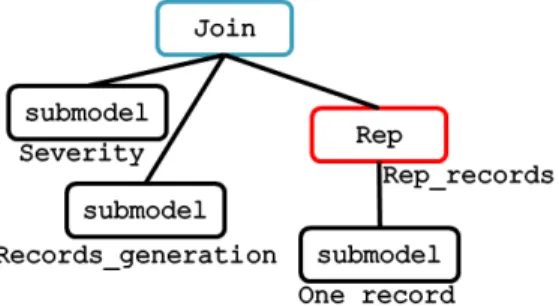
3.3 THE SAN COMPOSED MODEL
The SAN model resulting from the composition of the SAN submodels presented in figures 2, 3 and 4, using joining “Join” and replication “Rep” composition operators, is illustrated in Figure 5.
Figure 5. SAN composed model.
4. RESULTS AND SENSITIVITY
ANALYSIS
In this section, we illustrate the type of results obtained from the processing of the SAN model of Figure 5, and show the sensitivity analyses with respect to various parameters affecting the VBB data availability.
Table 1. Parameters
! The vehicle-to-vehicle encounter rate
" The connection rate to the fixed-infrastructure
c
The connectivity ratio = !/" (the rates at which vehicles meet relative to the rate at which connection to the fixed-infrastructure is possible) # Data loss rate for the Vehicle and the participants
n, k Parameters of the erasure code
r, z The accuracy required of the historical information to analyse what happened when an accident occurs
The quantitative measure UA defined in Section 3 corresponds to the probability of having a token in the place system_unavailable of Figure 3. The analyses focus on the impact on UA of the parameters defined in Table 1.
The results presented in the following subsections, when
Pareto distribution is used, have been obtained, using the
simulator provided by the Möbius tool. Each point of the graphs has been computed as a mean of at least 10000 simulation batches, converging within 98% probability in a 0.01 relative interval. Actually, the total number of simulation batches mainly depends on the value of the failure rate considered.
As regards the rate at which vehicles can connect to the fixed infrastructure, we consider an average nominal value "=10/h that
corresponds to situations where an access point is available each 6 minutes. This is the case for example of a vehicle moving at an average speed of 100 km/h on a highway with an access point each 10 km. The consideration of other scenarios with a higher or a lower density of access points is taken into account through the analysis of different values of the connectivity ratio.
A question is raised concerning the number of records r needed among the z last generated records to reconstitute an accident. For example, if there is an accident, we will be interested to know the state of the Vehicle for the last 15 seconds. If a vehicle is moving with an average speed of 80 to 130 km/h and the Vehicle is generating a record each 2 to 5 seconds; we can look forward to at least 3 or 4 records among 5 generated records during the last 15 seconds before the accident. In other words, we can tolerate the loss of two records, in the worst case, during the last 15 seconds before the accident. Different values of r and z will be analysed to highlight the impact of these parameters on the VBB data availability.
In the remaining of this section, we will first concentrate on the unavailability of one data record. Then, we will address the unavailability of the VBB application.
4.1 UNAVAILABILITY OF ONE DATA
RECORD
The unavailability of one data record generated by the Vehicle corresponds to the probability of having a token in place DL of Figure 2.
We first consider the case of replication by duplication and then we compare the two replication strategies (by duplication and by fragmentation).
4.1.1 Replication by duplication
Figure 6 and 7 show the unavailability of a single data record as a function of the failure rate #, in the case of the replication by duplication strategy (n=k=1) when the vehicle encounters are described by either an exponential or a Pareto distribution. Also, these figures present the results corresponding to the case when replication in the ad-hoc domain is not used n=k=0; (i.e., the data record is stored on the Vehicle until it is delivered to the fixed infrastructure when an access point is reached). This will highlight the potential benefit of using encounters in the ad-hoc domain to improve the data availability.
The results are shown for three different values of the ad-hoc-to-fixed infrastructure connectivity ratio c (1, 10, 100) corresponding to different environments and mobility scenarios. The parameters assigned to the Pareto distribution (p and s) are such that the mean time between encounters is equal to 1/!, (the mean time between encounters of the exponential distribution to which it is compared).
Figures 6 and 7 have a log-Log scale. The linear increase of the data record unavailability for increasing values of # induces a power law relationship between these two quantities. Also, it can be observed that the data record unavailability is impacted by the the value of the ad-hoc-to-fixed infrastructureconnectivity ratio c characterizing the corresponding mobility scenario. The relative variation of the unavailability when increasing c is different for
exponentially distributed encounters (Figure 6), for #=10-3/h, the unavailability corresponding to c=10 is 9 times higher compared to c=100, whereas the variation is about 5.5 times only when increasing c from 1 to 10. ! 10-3 10-4 10-5 10-7 10-6 10-8 10-2 10-4 10-3 10-2 10-1 UA
Figure 6. Data record unavailability for
exponential encounters. ! 10-3 10-4 10-5 10-7 10-6 10-2 10-4 10-3 10-2 10-1 UA
Figure 7. Data record unavailability for
Pareto encounters.
The situation is slightly different for Pareto distributed encounters. Indeed, the relative variation of the data unavailability as a function of c remains low:
• about 1.2, when comparing mobility scenarios corresponding to c =1 and c=10, and
• about 3.9 when comparing mobility scenarios corresponding to c=10 and c=100.
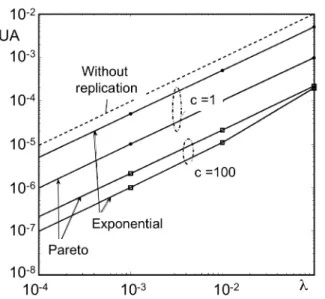
The comparative analysis of the impact of the exponential and the Pareto distributions on the data unavailability is more visible in Figure 8 which plots together the results corresponding to these cases, for c=1 and c=100.
Figure 8. Data record unavailability:
Pareto and exponential encounters.
Another interesting observation that can be derived from Figures 6, 7 and 8 concerns the analysis of the potential gain brought by the use of replication compared to scenarios where replication is not used. It can be seen that the gain mainly depends on the characteristics of the considered environment, especially, the connectivity ratio c: the higher is this ratio, the better is the availability gain obtained. Also, we can observe that the maximum gain, for the parameters considered in our study, is obtained in mobility scenarios with Pareto distributed encounters for c=1, and in scenarios with exponential distribution encounters for c=100.
4.1.2 Impact of the replication strategy
Figure 9 and 10 highlight the impact of the replication strategy on the unavailability UA when considering a single record and
exponential and Pareto encounters, respectively.
Each figure compares the unavailability associated to the replication by duplication strategy (denoted as UA(1,1)) to the unavailability associated to the replication by fragmentation strategy using an erasure code (n ,k) (denoted as UA(n,k)). The comparison is made through the ratio UA(1,1)/UA(n,k).
Similar results are obtained for the exponential and Pareto encounter scenarios. It can be noticed that, in both cases, the unavailability decreases as n and k increase. Also, in both cases, it appears that the potential gain yielded by the use of an erasure code compared to replication by duplication is rather modest (less than 2 times if we consider the most favorable case). Nevertheless, it should be mentioned that a noticeable advantage of erasure codes over the replication by duplication is the fact that they are generally used to ensure security related properties too, in particular confidentiality. The higher is k the better is the confidentiality. However, the assessment of these properties is not the focus of this paper.
Figure 9. Impact of the replication strategy: one record, exponential encounters.
Figure 10. Impact of the replication strategy: One record, Pareto encounters.
4.2 VBB UNAVAILABILITY
In this section, we evaluate the unavailability of the VBB application considering the case of multiple records such that r among the last z generated records are needed to analyse what happened if an accident has occurred. We consider the case of replication by duplication, and mobility scenarios characterized by
exponential encounters. Similar trends have been observed for the
case of Pareto distributed encounters.
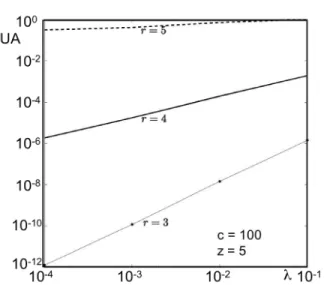
Figure 11. VBB unavailability: replication by duplication,
exponential encounters.
Figure 12. VBB unavailability: replication by duplication,
Pareto encounters.
Figure 11 shows the VBB unavailability considering the case z=5 with different values for r. It shows that when z is fixed the unavailability varies linearly with and is highly sensitive to r. In addition, the proportionality factor decreases as # increases. As an example, the increase of r from 3 to 4 yields a five orders of magnitude decrease of the unavailability for # = 10-3/h and four orders of magnitude for # = 10-2/h.
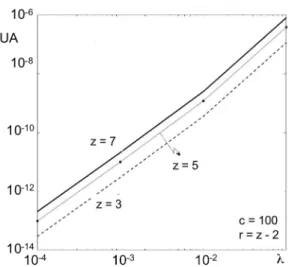
The impact of the variation of z on the VBB unavailability is illustrated in Figure 13. The results concern three different pairs (z, r). It can be noticed that the higher is z the better is the unavailability and the difference is significant (e.g., the unavailability corresponding to (z=7, r=5) is 7 times higher than the unavailability with (z=5, r=3) when # = 10-3/h).
Figure 13. Impact of z on VBB unavailability: simple replication, exponential encounters.
Figure 14. Replication by duplication vs. no replication: c=100.
The last result highlighted in Figure 14 concerns the comparison of the scenario where replication is not used with the replication by duplication strategy, through the ratio of the unavailabilities corresponding to these cases denoted as
UA(0,0)/UA(1,1). For the sake of comparison, we present together
the results corresponding to exponential and Pareto encounters for two connectivity ratios: c=10 and c=100. It is noteworthy that the results are almost similar for the different values (z=7, r=5), (z=5,
r=3), and (z=3, r=1), considered in Figure 13.
It can be seen that the potential gain due to replication is significant especially in the environments where the failure rate # is low (e.g., 10-4/h). The maximum gain (about 104) is obtained in the case of exponential encounters for c=100. The comparative analysis of the exponential and Pareto results shows that the distribution of encounters can have a significant impact in this case.
5. CONCLUSION AND FUTURE WORK
This paper, addressed the dependability modelling and evaluation of an innovative application in automotive systems that is aimed at providing a virtual black-box for storing historical information about the state of the vehicles on a dedicated server at the fixed infrastructure. To protect the data records against potential losses before they are delivered to the server, they are replicated and disseminated to encountered vehicles with which they can communicate using wireless technologies. Each of these vehicles delivers its data to the server when they can connect to the fixed infrastructure.This paper focused on the availability evaluation of the historical data recorded in the black-box using stochastic activity networks (SANs), considering mainly the data recorded just before an accident. The proposed model allowed us to compare different data replication strategies under various mobility scenarios and environmental factors.
This paper includes significant extensions of our previous work related to the dependability evaluation of a cooperative backup service reported in [3]. The latter, based on generalized stochastic Petri nets, assumed an exponential distribution for the vehicle encounter process, and addressed the case of a single data record only. Here, we extended the original model to analyse the availability of the virtual black-box application taking into account multiple data records and considering more general mobility scenarios. For example, we included in the analysis situations where encounters are described by a Pareto distribution as observed e.g., in [6, 7], to assess the impact of the distribution of encounters on the behavior of the application under different replication strategies. For this purpose, we used stochastic activity networks.
The results obtained in this study show that the VBB application may exhibit different levels of availability when comparing mobility scenarios with Pareto encounters and scenarios with exponentially distributed encounters, depending on the value of the ad-hoc-to-fixed infrastructure connectivity ratio in the corresponding environment. Another noteworthy result concerns the availability gain yielded by the data replication in the
ad-hoc domain compared to the case where such a replication is
not used. The unavailability can be decreased thanks to replication by a factor up to the connectivity ratio (100 in our study) when considering a single data record. This result confirms the conclusion derived in [3] and shows that it is also valid in mobility environments where encounters are described by a
Pareto distribution. Moreover, when considering the availability
at the VBB application, our study shows that the gain brought by replication can be significantly higher (e.g., 104 for exponential encounters and c=100).
The analyses presented in this paper can be refined by considering safety-related measures, taking into account the distribution and the rate of occurrence of accidents. Also, the model can be extended to analyse the dependability of the historical information recorded by the VBB application, over a long period of time and not only considering the data recorded just before an accident.
6. ACKNOWLEDGMENTS
This work was partially supported by the HIDENETS project (Highly DEpendable ip-based NETworks and Services), EU-IST-26979, http://www.hidenets.aau.dk/.
7. REFERENCES
[1] W. H. Sanders and J. F. Meyer, "Stochastic activity networks: Formal definitions and concepts," In Lectures on Formal Methods and Performance Analysis, pp. 315-343. Springer Verlag, 2001.
[2] L. Courtès, M.-O. Killijian, and D. Powell, "Storage Tradeoffs in a Collaborative Backup Service for Mobile Devices," Proc. of the 6th European Dependable Computing Conf., IEEE CS Press, pp. 129-38, 2006.
[3] L. Courtès, O. Hamouda, M. Kaâniche, M.-O. Killijian, and D. Powell, "Dependability Evaluation of Cooperative Backup Strategies for Mobile Devices," Proc. of the IEEE Int. Symp. on Pacific Rim Dependable Computing, pp. 139-146, 2007. [4] O. Hamouda, M. Kaâniche, E. Matthiesen Moller, J. Gulddahl
Rasmussen, and H.-P. Schwefel, "Connectivity dynamics in vehicular freeway scenarios," The 2nd IEEE int. Workshop on ITS for an Ubiquitous ROADS co-located with IEEE Global Information Infrastructure Symposium, Hammamet, Tunisia,, pp. 8-14, 2009.
[5] A. Rényi, "On Two Mathematical Models of The Traffic on a Divided Highway," Journal of Applied Probability, vol. 1, pp. 311-320, 1964.
[6] T. Spyropoulos, A. Jindal, and K. Psounis, "An Analytical Study of Fundamental Mobility Properties for Encounter-based Protocols," International Journal of Autonomous and Adaptive Communications Systems, vol. 1, N°. 1, pp. 4-40, 2008.
[7] T. Karagiannis, J.-Y. Le Boudec, and M. Vojnovic, "Power Law and Exponential Decay of Inter Contact Times between Mobile Devices," Proc. of the 13th annual ACM international conf. on Mobile computing and networking, 2007.
[8] H. Weatherspoon and J. Kubiatowicz, "Erasure-Coding vs. Replication: A Quantitative Comparison," Revised Papers from the 1st International Workshop on P2P Systems, pp. 328-338, Springer-Verlag, 2002.
[9] W. K. Lin, D. M. Chiu, and Y. B. Lee, "Erasure Code Replication Revisited," Proc. of the 4th P2P, pp. 90-97, 2004. [10] L. Xu, V. Bohossian, J. Bruck, and D. G. Wagner, "Low
Density MDS Codes and Factors of Complete Graphs," IEEE Transactions on Information Theory, vol. 45, N°. 1, pp. 1817-1826, 1999.
[11] D. Daly, D. D. Deavours, J. M. Doyle, P. G. Webster, and W. H. Sanders, "Möbius: An extensible tool for performance and dependability modeling," In 11th International Conference, TOOLS 2000, vol. Lecture Notes in Computer Science, pp. 332-336, 2000.
[12] P. Michardi and R. Molva, "CORE: A Collaborative Reputation Mechanism to Enforce Node Cooperation in Mobile Ad Hoc Networks," proc. of the 6th IFIP TC6/TC11
Joint Conf. on Communications and Multimedia Security, pp. 107-121, Kluwer Academic Publishers, 2002.
[13] L. Buttyán and J.-P. Hubaux, "Enforcing Service Availability in Mobile Ad-HocWANs," Proc. of the 1st ACM Int. Symp. on Mobile Ad Hoc Networking& Computing, pp. 87-96, IEEE CS Press, 2000.
[14] M. O. Killijian, M. Roy, G. Severac, and C. Zanon, "Data backup for mobile nodes: a cooperative middleware and experimentation platform," Workshop on Architecting Dependable Systems (WADS), supplemental volume of DSN-09, Lisbon (Portugal), pp. 6, 2009.
[15] S. Hallé and R. J. Chaib-draa, "Collaborative Driving System Using Teamwork for Platoon Formations," In Applications of Agent Technology in Traffic and Transportation, Whitestein Series in Software Agent Technologies, Birkhäuser Verlag, 2005.
[16] B.-M. Yang and J. Kim, "Road Traffic Accidents and Policy Interventions in Korea," Injury Control and Safety Promotion, Swets & Zeitlinger, vol. 10 (1-2), pp. 89-94, 2003.
[17] UDS_White_Paper, "Accident Data Recorder - A Contribution to Road Safety," National Highway Traffic Safety Administration - www.nhtsa.dot.gov, 2007.
[18] O. Hamouda, M. Kaâniche, and K. Kanoun, "Safety Modeling and Evaluation of Automated Highway Systems," The 39th Annual IEEE/IFIP international conference on Dependable Systems and Networks (DSN-09), Lisbon, Portugal, pp. 73-82, 2009.