Publisher’s version / Version de l'éditeur:
Textures and Microstructures, 19, 3, pp. 175-188, 1992-01-01
READ THESE TERMS AND CONDITIONS CAREFULLY BEFORE USING THIS WEBSITE. https://nrc-publications.canada.ca/eng/copyright
Vous avez des questions? Nous pouvons vous aider. Pour communiquer directement avec un auteur, consultez la
première page de la revue dans laquelle son article a été publié afin de trouver ses coordonnées. Si vous n’arrivez pas à les repérer, communiquez avec nous à PublicationsArchive-ArchivesPublications@nrc-cnrc.gc.ca.
Questions? Contact the NRC Publications Archive team at
PublicationsArchive-ArchivesPublications@nrc-cnrc.gc.ca. If you wish to email the authors directly, please see the first page of the publication for their contact information.
NRC Publications Archive
Archives des publications du CNRC
This publication could be one of several versions: author’s original, accepted manuscript or the publisher’s version. / La version de cette publication peut être l’une des suivantes : la version prépublication de l’auteur, la version acceptée du manuscrit ou la version de l’éditeur.
For the publisher’s version, please access the DOI link below./ Pour consulter la version de l’éditeur, utilisez le lien DOI ci-dessous.
https://doi.org/10.1155/TSM.19.175
Access and use of this website and the material on it are subject to the Terms and Conditions set forth at
The elastic strain ratio, the Lüders strain ratio and the evolution of
r-value during tensile deformation
Daniel, Dominique; Jonas, J. J.; Bussière, J.
https://publications-cnrc.canada.ca/fra/droits
L’accès à ce site Web et l’utilisation de son contenu sont assujettis aux conditions présentées dans le site LISEZ CES CONDITIONS ATTENTIVEMENT AVANT D’UTILISER CE SITE WEB.
NRC Publications Record / Notice d'Archives des publications de CNRC: https://nrc-publications.canada.ca/eng/view/object/?id=cab2f5c6-d1b1-4d9e-b4ef-48fad52f38f7 https://publications-cnrc.canada.ca/fra/voir/objet/?id=cab2f5c6-d1b1-4d9e-b4ef-48fad52f38f7
Photocopyingpermittedbylicenseonly
THE
ELASTIC STRAIN
RATIO,
THE
LODERS
STRAIN RATIO AND
THE EVOLUTION OF
r-VALUE
DURING TENSILE DEFORMATION
DOMINIQUE DANIEL and J. J. JONAS
Department
of
Metallurgical Engineering, McGill University, 3450 University St, Montreal, Quebec, H3A2,47, CanadaJ.
BUSSIIRE
NationalResearch CouncilCanada, IndustrialMaterialsResearch Institute, Boucherville, Quebec, J4B6Y4, Canada
(Received September17, 1991)
The elasticcounterpartof theplasticstrain ratio is derivedfrom ultrasonic data measured ontwenty
commercialdeepdrawingsteels.Itis shownthat theobservedvariations inplasticrarerelatedtothe
evolution of texture, and are not affected either by the elastic range of deformation or by the propagation of Liiders bands. Further quantitative analysis suggests that the elastic strain ratio,
determined non-destructively, can be used to predict plastic r-values by means of an empirical relationship.
KEYWORDS Texture, ODF coefficients, plastic anisotropy, elastic anisotropy, r-value, Liiders
deformation, cold rolled steel sheet.
1.
INTRODUCTION
The plastic strain ratio or Lankford parameter
(Lankford
et al.,1950)
is well understood physically as a measure of the capacity to resist thinning. It isgenerally
referredto as the r-value:e22
In
Wo/Wf
(1)
es3In
to/tf
whereE22and e33arethetruestrainsin thewidthandthicknessdirectionsdefined by the initial and final widths and thicknesses w0, wf,
to
andtf.
Because oftheorthorhombic symmetry of rolled sheet, it need only be measured between the
rolling
(0
deg)
and transverse(90
deg)
directions. In practice, the average isusedtocharacterize amaterial:
1/4(to
+ 2r4s +
r9o)
(2)
Whiteley et al.
(1961)
showed that the higher the i, the deeper the draw. The parameterAr
isusedin turn to quantifythe planar anisotropy:Ar
1/2(ro-
2r45 +
r9o)
(3)
which isrelatedto the tendencytoform four-fold ears.
One of the problems involved in r-value measurement is that it is frequently
observed to vary with strain
(Arthey
and Hutchinson, 1981; Welch et al.,. 1983;Liu, 1983, Liu and Johnson 1985;
Hu,
1983; Lake et al.,1988).
The rate ofchange ofr-value isparticularly rapid in theearly stagesof deformation
(Daniel,
1990; Danieland
Jonas, 1990),
leadingto thepossibility that elasticphenomena, including the elasto-plastic transition, are involved. The present work wasundertaken with the aim of determining the extent to which elastic r-values,
whichgenerallydifferfrom the plastic ones, playa role in thisvariationofr.
2.
ELASTIC
STRAIN RATIOThe elastic r, rel, canbe calculatedfromtherelationbetweenthe stateofstress 0
and the resultingstate ofstrain
(Hooke’s
law),
asexpressed by:(4)
where Sijktare the components of the fourth order elasticcompliance tensors.
In
uniaxial tension alongthe 1 direction
(2
isthe widthdirection),
the elastic strain ratio is thereforegiven by:E S1122
re,
(5)
et ’1133
These matrices can be transformed from the rolling frame to the tensile reference frame
(inclined
at an angle 0to the rollingdirection)
usingthe tensortransformation rule:
$Okl airnainakoalpSmnop
(6)
where the prime indicates thevalueoftheconstant in thetensile system, the are the direction cosines relatingthe rolling and tensile coordinateaxes, and the
products are summed over all the mnop indices of the tensor.
For
a given 0,r,(O)
isdefinedby:s122
cos20sinE0(Sllll
+
s22224s22)
+
(cos
40+
sin40)s22
(7)
s133 COS 20 $1133+
sin2
0s23It
shouldbe noted thatPoisson’s ratioo12(=--e22/e)
isthe elasticcountea
of the plastic contraction ratio q.
ese
are the quantities measured in practicesince the thicknessstrain e33 cannotbe accuratelydeterminedonthinsheets.
e
relationsbetween re, and o12 and
rp,
and qcan be writtenas:and
rp=
(8)
r,
1 o12 1 q
where
rp,
is the plastic strain ratio. Since ViE in steels falls in the range0.2
<
ViE<
0.7, r, can be expected tova
from about 0.25 to 2.e
latter istherefore smaller than
rp, (except
whenrp,
takes valuesbetween 0 and 1.5, asit isshown
later).
As aresult, rgenerallyincrees asthe materialpasses
through the elastic-to-plastictransition.3.
PROBLEMS ASSOCIATED WITH
THE EXPERIMENTAL
DETERMINATION
OFTHE
ELASTIC AND PLASTIC STRAINRATIOS
a. Derivation
of r
from
ultrasonicmeasurementsThe deformations associated with the elastic straining of a sample are so small that theycannot readilybe measured directly.
However,
the elastic constants of the sheet can be derivednondestructively
from measurements of the ultrasonic velocities(Sayers,
1982).
The anisotropies of the longitudinal and shear sound velocities propagating in the rolling plane lead to a partial description of thepolycrystal
stiffness tensorCk (Thompson
et al., 1987, 1989; Hirao etal., 1988,1989).
More
precisely, theseultrasonicdataleadtoonlythreeindependentelastic parameters,expressed
linearly in terms of Cl, C2222, Cl122 and c1212(Sakata
et al., 1990; Daniel, 1990; Daniel etal.,1991). A
polycrystal elasticitymodel, such as the 2nd order Hill approximation(Bunge,
1974)
is then needed in order todetermine the entire stiffness tensor ct, from which the compliance tensor sgt
can be obtainedbymatrix inversion. Theseoperationsleadto
r
accordingtoEq.
(7).
b. Directmeasurement
of
rp
According to
ASTM
standard E517-81 pertaining to the plastic strain ratio, thewidth and length changes are measured after elongations of 15 to 20%. The thickness strain is then calculated by assuming volume constancy. This requires
thatthe errors in thelength andwidth measurementsbefore and afterstretching notexceed about
10/m
for thewidth and 25to50/m
for the length, depending on thegage
length.As
a result of these stringent requirements, the quality of r-value measurementsdepends
sensitively on theaccuracy
of the measuring techniqueand on theskillof theinvestigator.The physical significance of the conventional definition
(i.e.
the accumulated strain ratioe/e
at 15% elongation) has, however, been questioned because of the evolution of the plastic anisotropy during straining. It has been pointed out that,both in mathematicalmodelingaswellasfor thecharacterizationofmaterial drawability, r should be defined in terms of the instantaneous ratiode/det
atzero strain
(Welch
et al.,1983).
This was suggested earlier by Hill(1948),
butneglected
because of the practicalproblems
associated with carrying out experiments at such small strains.Measurement
of the desirable instantaneousstrain ratio requires complex equipment andinvolves acontinuous recordof the
length
and width changes during straining for later back extrapolation to zero strain. The need for accurate studies of plastic anisotropy has led to intensiveresearch on the evolution of the strain state in tension
(Liu,
1983; Liu andJohnson, 1985; Lakeetal.,
1988).
Thistypeof investigationhas shownthat, for awide
range
ofmaterials,the relation between the width and lengthstrainscan be considered aslinear to afirstapproximation.From
straindata, such as those obtainedin thisstudy,
two different definitions of r-value can be used. Thefirst isthe conventionalone, consistingof theratioof the accumulated width to thickness strain at a specified elongation, usually 15%(e
0.14).
Thesecond,called the regressionrin thepresent work,usesthesloper15 regression conventional pl regression
rpl
81
81
ie 1 Schematic illustration ofthe definitionsand strain dependencesof the conventionaland
regression r-values(caseofapositiveintercepta).
strains measured during the course of (relatively) uniform elongation. These
definitions areexpressed, respectively, bythefollowing equations:
conventional Ew rpl
(9)
E""
E b rregression(10)
pl 1 b andThe major distinction between these two parameters is their different
depend-ences on the strain. The conventional r varies with elongation, at a rate that
dependsonthe value ofa.
By
contrast, theregression r is constantby definition,which makes it attractive for characterizing the drawability. Figure 1 illustrates the differences between these twodefinitions.
The angular
dependence
of rpl on 0(inclination
to the rollingdirection)
can also be predicted from texture data(ODF
coefficients). It
was shown in earlierpublications
(Daniel,
1990; Daniel andJonas,
1990; Daniel et al.,1991),
thatcalculations using the
RCa
relaxed constraintmodel are ingood
agreement with experimentalmeasurements when appropriate values are selected forthe critical resolved shearstress ratiosfor each steel.3.
EXPERIMENTAL WORK
a. Materials
Twenty
samplesof low carbon steelsheetswerecollectedfrom variousproducers
in Canada, United
States
andJapan.
These were divided into fivetypes:
(1)
batch-annealed Al-killed drawing quality
(AKDQ)
steels,(2)
commercial-grade rimmed steels(denoted
asRIM
in the presentwork),
high-strength low-alloy(HSLA)
steels, and(4)
and(5)
twotypesof interstitial-free(IF)
extra-low-carbonsteel. The latter distinction was made because ofthe different texturesobserved
which induced different plastic anisotropies. In the first type of interstitial-free
steel
(IF1),
the P-values fell in the range from 1.5 to 1.9, and the Ar’sof0.2 to0.4werebelowthose of the AKDQ steelsinthesamePrange. Inthesecondtype
(IF2),
the f-valueswere above 2.0, and the Ar’s were still smaller, rangingfrom -0.2to0.2.b.
X-ray
and acoustoelastictextureanalysesThetextureofeachsteelwas analyzed bymeansofthe
X-ray
reflectiontechnique on a Siemens’ goniometer system, consistingof a Digital Equipment PDP-11/73controlled vertical diffractometer
(D-500),
attached to the theta(i.e.
theBragg
angle
0)
circle of the Huber Eulerian cradle. Standard numerical methods(Bunge,
1982)
provided the ODF coefficients from the incomplete pole figure datauptolmax
22.The present elastic measurements were carried out using electro-magnetic
acoustic transducers, referred to as EMAT’s. Two types of guided plate wave
modes were employed: the lowest order symmetrical Lamb
(So)
and the shearhorizontal
(SH0)
modes. The Lamb waves consist of a pair of transverse waves superimposedon apairoflongitudinalwaves. Theirdirection ofpropagation lies in theplaneparallel
to the surface of theplate. For agiven plate thickness, thewavevelocityisa strongfunctionof
frequency,
sothat measurements areusuallymade in a frequency rangewhere this dependence isweak. For the fundamental
So
mode, thisrangecorresponds
tofrequenciesfar below the cutofffrequenciesofthe higher modes and the associated vibrations occur approximately parallel to
thepropagationdirection.Nevertheless,there is asmall lateral motionduetothe
planestress boundarycondition because thewavelength islong but notinfinitely
so
(zero
frequency).
The
So
andSI10
mode velocities were measured along three directions ofpropagation
(0
,
45 and 90 fromRD)
using Magnasonics EMAT’sat a nominalfrequency
of 500kHz. TheSo
mode velocities were extrapolated to zerofrequency
tocorrect forthedispersion effectassociated withfiniteplatethickness(Daniel,
1990).
This correction affects the measured values by 0.5%, which ismore significant than in the case of the resonant frequencies measured by the Modul-r tester. This is because the correction term is inversely proportional to
the
square
of thewavelength,which isaround 20cm inthe Modul-rcaseand 1cmin the
EMAT
method.Due
tothe sheet symmetry,theSHo
mode velocities at0 and 90 are equal. The 4th and 6th order texture coefficients were derived fromthe ultrasonic databythe method of Sakataetal.
(1990),
andusedfor calculation ofthe elasticand plasticr-values.c. Tensile testing
To
avoid the technicalproblems
associated with the double extensometertechnique, a time consuming but easier method than the interrupted test
procedure
was devised. Tensile tests were carded out on specimens cut from sheetsat several orientations withrespect tothe rollingdirection, i.e.every
15,
22.5 or 45.
For
each orientation,two standard, parallel-sided, 200mmx
20 mmstrip specimens
(type B
ofASTM517-81)
were firstprepared.However,
in orderthespecimensweretaperedfrom20to 19.3mm withinthegage length, following
thesuggestionof Liu
(1983).
In
thepresent work, agridof4mmby4 mmsquareswasscribed,using alaser beam technique,which led to a line width of about 50#m.One
of each pair ofspecimenswas first stretchedto5% elongationandthento10% atastrain rateof 2
x
10-3s-l;
the secondsample was stretched to 20% in a single test. The
elongationsin thefirstsample rangedfrom5to 12% alongthecenterofthegage
length
after the secondtest. The strains inducedby
thetaperranged
from 15 to 25% along the second sample. Grid measurement was carried out at sevenlocations along the
gage
length by means of a toolmaker’s microscope, which ensuredan absoluteaccuracy
of2.5#min thereadings.Due
tothe linethickness,the widths and lengths were determined with an accuracy of 20#m
(---0.2%
error).
The grid deformation was measured on 3x
3 or 3x
2 unit rectangleslocatedalong thecenter linesofthe specimens.
4.
RESULTS
ANDDISCUSSION
a. Evolution
of
rplduringtensile testingFor
eachsample
direction, an approximately linear relation betweenew
and elwasobserved in therangeofuniformdeformation, asreported byLiu
(1983)
and Liu and Johnson(1985)
for low carbon steels. Typical results for an IF1, anAKDQ and a
RIM
steel are presented in Figure 2.An
interesting difference between theIF
and other steelslies inthehomogeneous yieldingbehaviourof the formergrade,whichaffects theevolutionof r-valueduring straining,asdescribedby
Artheyand Hutchinson(1981)
and Lake etal.(1988).
As
outlinedbyLakeetal.
(1988),
the absolute value of theintercepta of the linear regressionis higherfor steelswhich undergo inhomogeneous yielding (Figure2b and
2c) (lal -0.009)
than forthe
IF
steels(Figure2a) (la[
0.0015).
Also,awasfoundtobe generally positive,although
sometimesit wasnegative.Although this value is subject to experimental error
(Liu
and Johnson, 1985;Lake etal.,
1988),
the large number ofmeasurements carded outin the present work indicate that the a-value is close to zero for steels which yield homogene-ously and non-zero for the others.In
the latter case, highvalues oflal(>0.005)
were found in the
RIM
andHSLA
samples displaying high yield point elongations(---4-5%).
Thedata for thesespecimens showlargerdeviations from linearity(see
Figure2c),
which add some uncertaintyto the a-values.Moreover
these steels display earlier plastic instability than the AKDQ and
IF
grades.These two factors reduce the range of uniform deformation used for the
regressionandinduce localinhomogeneities, which canalso affect the
determina-tion of the convendetermina-tionalASTM r-value.
To
avoid the difficulties associated with the transition to homogeneousdeformation, the regression proposed by Liu
(1983)
seems to be an appropriate technique for calculating the average strain ratio during deformation afterpropagation of the band. Furthermore, the number of points obtained at increasingstrains improvesthereliabilityoftheestimated value. Thesestatistical regressiontechniquesleadto a95% confidence intervalfor b, which corresponds to an error in r of +0.04 to +0.08
(for
steels displaying high yield point15 10 a)IF1 15 15 10 10 5 5 0 0
"
25 0 25 0 25 E E 15 10 b)AKDQ
0 10 0-45O/
0 25 0 25 E 10 0:90 E 25 15 10 c)RIM
-/" 15 15 10 5 0-45 0 -i 0 10 5 0 90 Y 0 25 0 25 0 25 E E EHgare2 Examplesofexperimental el, ewdata(in%) obtained on(a)anIF1 steel, (b)anAKDQ steel and(c)aRIMsteel.
elongations and a narrow range of uniform plastic
deformation)
for 12 datapoints,
compared
to a common error of +0.15 in the r’s determined in theconventional manner.
It
is of interest that, for the cases where a non-zero a intercept was obtained, the conventional and regression r values differed by as much as0.10to 0.25.b. Elasto-plastictransition
of
r-valueFigure 3 shows the evolution of the conventional plastic r-value measured at
various tensile strains
(from
0.07to0.25)
in three typical steels. Ther(et)
curvewas derived in that range of deformation from the observed quasi-linear relationshipbetween eland
ew.
It
isobvious(from Eq.
(9))
that thea parameter, which was found to be generally positive in the case ofinhomogeneous yielding andclosetozeroin mostcasesofhomogeneous
yielding,depends
ontheshape
of ther(el)
curve. The elastic r-value is also displayed, but it is clear that theelasto-plastic transitiondoes not account for thevariation in
r(el)
observed.As
expected from
Eqs (9)
and(10),
the conventional r approaches the regression r asymptoticallyat highstrains.The non-zero value of a obtained even in the case of homogeneous yielding suggests that the -e, vs el plots are curved between 0 and 15% longitudinal strain
(as
showninFigure 1, theyhavetopass throughtheorigin). Thistransition behaviour can be relatedtotherapid changesin grainorientation that takeplace asthe ),-type fibertexture ispartially destroyedand thetexture evolvestowardsastable configuration. Most of the measurements show positive a-value, which correspondsto adownwardcurvature of thefirstpart of the
--eq
VS elandisalsoassociatedwith adecrease in r.
In
most cases of inhomogeneous yielding, the conventional r-value decreases asymptotically with strain(a >0)
(Arthey
et al., 1981;Hu,
1983; Lake et al.,1988).
Thequestiontherefore arises about the effectof Liidersbandpropagation on the evolution of r-value during straining. The initial stages of plastic deformation, corresponding to Liiders band propagation, are in plane strain. After passage ofthe band, further deformation takes place by uniaxial tension.The first strain path involves lateral constraint and does not result from pure
uniaxial loading; accordingly, two different r-valuesare displayed by thesample
in the course of deformation. Liiders propagation leads to lengthening
perpen-dicular to the front, which is generally inclined at 50 to the tensile direction. Consequently
e
ande
(positive) are nearly equal and rLiider is ---0.5. Following propagation of the band, the rate ofchange ofr ismostrapid during the firstfewpercent
of deformation(see
theexamplesofthe HSLA and AKDQ steels inFigure3).
Thecase ofinhomogeneous yieldingisshownschematicallyin Figure 4. Thus, as in homogeneous deformation, positive a is seen to be associated with back extrapolation from a linear fit to data obtained at larger strainswhenrisdecreasing.No clear quantitative relation can be derived between rel and
r(e)
because ofthe complex phenomena involved in yielding and in the propagation of Liiders
bands. Qualitatively, all the samples studied are represented by the three cases
displayedinFigure 3. It appearsthatwhenrpl tendstoavaluelargerthan 1.5, r! issystematicallyless thanrpl (Figure
3c).
Figure 3a illustrates thecase whererp
isconventional
TextureI
:.
rpl
effect regressionrpl
1
rLiiders
lr,gure4 Schematic illustrationof theevolutionofrin caseof inhomogeneous yielding.
less than 1 and the corresponding r.,isgenerallygreater than
rp,.
The elastic andplastic r’s are approximately equal when
rp,
tends to a value between 1 and 1.5(Figure
3b).
These differences were not found todepend
on the type of yielding behaviour.c. Planarvariation
of
r.,andr,
In
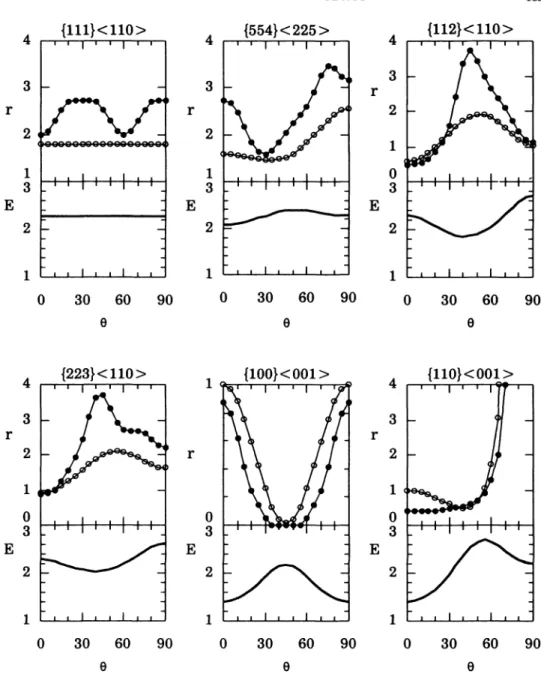
Figure 5, the angular variation of the elastic and plastic strain ratios arepresentedwhichpertaintothemain idealorientationsobservedexperimentallyin
steel sheets. These textures were simulated using a gaussian type of orientation distribution so as to account for the normally occurring misorientation of
individual grains with respect to an ideal orientation.
A
15 gaussian spreadwasemployed. The
rp,(0)
results were calculated using a relaxed constraint(RC3)
model, with bcc deformation taking place by mixed
{110}
{112}
(111)
glidewith
CRSS’s
onthetwo setsofsystems suchthat Z’(1120.95Z’(11o
(Daniel,
1990;Daniel and
Jonas,
1990). Young’s
modulus data are also included since this quantity was used by Stickels and Mould(1970)
to establish their empiricalcorrelation with r-value.
As expected,
E(O)
andre,(O)
display oppositedepend-ences on 0.
It
is of interest that there,(0)
curves follow the general tendenciesdisplayed by the
rp,(0)
curves, eventhoughit wasshown above thatrp,
andre,arenot proportional alonga given 0 direction. Figure 5 also shows that re, isalways significantlyless thanrpi, exceptforcomponents Or specificdirectionsalongwhich
rp
is less than 1. This can be related to the observations made aboveregarding Figure3.{111}<110>
0 30 60 90 E 3 0 3 E 1 1{112}<110>
I
t
0 30 60 90 0 30 60 90o
0 0 3 0 3E
{223}<110>
{100}<
001>{110}<
001> 4 3 r 2 1 2 1 0 30 60 90 0 30 60 90 0 30 60 90 0 0 0$ Predictionsofrp,(0)bytheRC model(0)and ofre,(O bythe Hill approximation(O)for common texture components composed of a gaussian spread of 15 around the respective ideal orientation.ThedependenceE(O)isalsoindicatedfor comparisonpurposes.
Figure6
compares
r,(0)
andrp,(O)
for four of the steels studied.In
thecase of the low drawability steels(i.e. RIM
andHSLA),
the elastic and plastic strainratios are inrelatively
good
agreement.However,
for theIF
and AKDQ grades,the
r(O)
andrpl(0)
curves display similar tendencies, but without quantitative0 30 60 90 0
AKDQ
0 3O 60 90 0HSLA
0 30 0 60 90 0 30 60 90 0Hillapproximation(---)withthe experimental data x).
Comparisonofrp,(0)calculatedfrom theRC model()andre,(O determinedfromthe
d. Empiricalcorrelations
between/el
andrp,
The results described above suggested that it would be of interest to derive empirical correlationsbetween theanisotropiesofthe elastic andplasticr-values. Such analyseswere carried out in the past using
Young’s
modulus(Stickels
andMould,
1970)
or the ultrasonic velocities(Bussi6.re
et al.,1987). However,
itappears
thatre, isphysically more relevant sinceit characterizesthe resistance to thinningin the elasticrange
of deformation much as r# typifies it for the plastic range.The empirical correlationsbetween the values of elastic andplastic
,
Ar
and6r(=r(90)- r(0))
are illustrated inFigure7.(6r
representsthe tendencytoform two-foldears.)
No
detailedregression analysiswas carried outdue tothe limited number ofsamples. Qualitatively, it can be concluded that the dispersion of the datais withintheexperimentalerror(+0.1
inrp,),
indicatingthat theelastic strain ratio, readily measured ultrasonically(i.e.
non-destructively), can be used toestimate the plastic one with the same accuracy as in the Stickels and Mould
1.8 elastic 1.4 1.2 .5 1.5 2 2.5 plastic .5 elastic -.5 -.5 0 .5
Ar
plastic .5 .4 elastic 0 0 .2 .4 .6 .8r
plasticFigure 7 Correlation between the elastic and plastic i, Ar and 6r. The plastic quantities are
experimental data and theelasticones were calculated fromultrasonicdata.
5.
CONCLUSIONS
Analysis of the evolution of
rp=
during conventional tensile deformation shows that the changes in rpt are not related to the elastic-to-plastic transition.Nor
isLiidersbandpropagation responsiblefor the increaseordecreasein
rp
observed.It appears
instead that thevariations inrp=
are due totexture evolution, which is in turn responsible for non-zero values of a in the case of homogeneousdeformation.
As a result of the rapid initial evolution of
rp,
theback-extrapolated
conventionalvalue whena
>
0(and
rp
isdecreasing), andlower whena<
0(and
rp
isincreasing).For
plastic r’s greaterthan 1.5,re
issystematicallyless thanrp;
this difference decreases when theplasticrisless than 1.5,and becomes negative when
rp <
1.This study shows that the elastic strain ratio can be readily determined from
ultrasonic measurements. The
re(O)
andrp(0)
curves displaysimilar tendencies.So,
the elasticr, determinednondestructively, can be usedto estimate itsplastic counterpart with the aid of empirical relationships. Such correlations are physically better based than the ones relating r-value toYoung’s
modulus orultrasonic velocity.
ACKNOWLEDGEMENTS
The authors are indebted to Prof.
J. Szpunar
of McGill University for assisting with the texture measurements. They are grateful to the Kawasaki SteelCorporation, Stelco Steel
Inc.,
DofascoInc.
and the Algoma Steel Corporationforsupplyingsteel sheets. They acknowledgewith gratitude thefinancial support received from the Canadian Steel Industry Research Association, the Natural Sciences and Engineering Research Council of Canada, and the Ministry of Education ofQuebec
(FCAR
program).
References
Arthey,R. P. and Hutchinson,W. B.(1981).Metall. Trans., 12A, p. 1817.
Bunge,H.J. (1974).Kristall Tech., 9, p.413.
Bunge,H. J.(1982).TextureAnalysisin MaterialsScience, Butterworths, London.
Bussi6re,J.F.,Jen, C.K.,Makarow,I.,Bacroix,B., Lequeu,Ph. andJonas,J.J.(1987).Proc.2rid
Int. Syrup. onNondestructive CharacterizationofMaterials, Montreal,July 21-23, 1986,Ed.by J.
F.Bussi6reetal., PlenumPress,NewYork,p. 523.
Daniel,D.(1990).PhD Thesis,McGillUniversity, Montreal,Canada.
Daniel,D.andJonas,J. J. (1990).Metall. Trans.,21A,p.331. Daniel,D.,Sakata,K.andJonas,J. J. (1991). Trans. ISIJ,31,p.696.
Hill,R. (1948).Proc.Roy. Soc. London, Ser.A, 193, p.281.
Hirao,M., Hara,N. and Fukuoka,H.(1988).J. Acoust.Soc. Am.,Ikl,p.667.
Hirao,M.,Fukuoka,H.,Fujisawa, K.andMurayama, R. (1989).Metall. Trans.,?,0A,p.2385.
Hu, H. (1983).Metall. Trans., 14A, p. 1521.
Lake,J. S.H.,Willis, D. J.and Fleming,H. G. (1988).Metall. Trans., 19A,p.2805. Lankford,W. T.,Snyder, S. C. andBauscher, J.A. (1950). Trans. ASM, 42, p. 1197. Liu,Y.C.(1983).Metall. Trans., 14A, p.1199.
Liu,Y. C.andJohnson,L. K.(1985). Metall. Trans., 16A,p. 1531.
Sakata, K.,Daniel,D.,Jonas,J. J.andBussi6re, J.F. (1990).Metall. Trans., 21A, p.697.
Sayers,C. M.(1982).J. Phys., D15,p.2157.
Stickels,C.A. andMould,P. R.(1970).Metall. Trans., 1A, p. 1303.
Thompson, R. B., Lee, S. S. and Smith, J.F. (1987). Ultrasonics, 25,p.133.
Thompson, R.B.,Smith, J.F.,Lee, S. S.andJohnson,G. C.(1989). Metall. Trans., 20A, p.2431. Welch,P. I.,Ratke,L.andBunge,H. J. (1983).Z. Metallkde, 74, p. 233.