BUSINESS MODELING AS A DECISION SUPPORT TOOL IN
THE JET ENGINE AFTERMARKET BUSINESS
by
Robert P. Bliss
B.S. Mechanical Engineering, Stanford University, 1989
M.S. Mechanical Engineering, Stanford University, 1993
Submitted to the Department of Mechanical Engineering and
the Sloan School of Management in partial fulfillment of the
requirements for the degrees of
Master of Science in Mechanical Engineering
and
Master of Science in Management
In conjunction with the Leaders for Manufacturing program at the
Massachusetts Institute of Technology
May 1999
@ Massachusetts Institute of Technology, 1999. All rights reserved
Signature of Author
Sloan School of Management Department of Mechanical Engineering May 14, 1999
Certified by
Dani E . Whitney
Senior Research cientist, CT
ec
, Dept of ME.
- (
a
Thesis Supervisor
Certified by
Nelson Repenning
Assistant Professor, Sloan Sch ol of Management
Thesis Supervisor
Accepted by
Chairman, Department Com
Departmen oMechanic l Engineering
Accepted by
Lawrence S. Abeln
Director of Masters Program
BUSINESS MODELING AS A DECISION SUPPORT TOOL IN
THE JET ENGINE AFTERMARKET BUSINESS
by
Robert P. Bliss
Submitted to the Department of Mechanical Engineering and
the Sloan School of Management in partial fulfillment of the
requirements for the degrees of
Master of Science in Mechanical Engineering
and
Master of Science in Management
ABSTRACT
A major transformation is occurring in the business model of the jet engine business. The industry focus is
changing from a strict product orientation where spare part sales is the focus to one in which service is an increasingly important factor. Pratt & Whitney, who had the smallest percentage of the aftermarket business when this transformation started, has aggressively moved into this arena.
Pratt owns a large number of different aftermarket businesses. Each is run as a stand-alone entity with profit and loss responsibility. Since there are so many interactions between these businesses, there is a belief in Pratt management that this profit and loss structure leads to local optimization at the expense of the greater Pratt. The motivation for this thesis is to take the first step in building a simulation model of Pratt's aftermarket businesses to determine what structural changes would be required to achieve a global optimum. This thesis focuses only on one business within the aftermarket, overhaul.
The business model transformation is only now starting to affect the structure of the overhaul business and how it is operated, so the business I examined is in the midst of significant change. The model and results that will be presented, therefore, reflect the business, as it has been managed over the last several years, not how it is being managed going forward. My primary goal with this thesis is to provide insights on the old business structure that can be used by the new management teams as a guide for implementing their improvement plans during this growth phase. My secondary goal is to show how system dynamics can be applied in a business environment like Pratt's aftermarket businesses.
Because the business is going through a growth phase, I concentrated my efforts on understanding what aspects of the present business structure could impede that growth. The first topic analyzed is the productivity improvement methodology used by upper Pratt management, which involves reducing resource levels to motivate improvement. The modeling effort points out the potential impacts of a productivity shortfall and highlights the need to manage the productivity gap that is created. The second topic analyzed is the staffing policy used by the business. The modeling effort points out the impact of a significant learning curve and hiring delay that exist and are not properly being accounted for now. The third topic presented is a comparative analysis of the present manufacturing system design and the one proposed by upper management. The modeling effort points out the benefits of moving to the proposed design.
Thesis Advisors:
Nelson Repenning, Assistant Professor, Sloan School of Management Daniel E. Whitney, Senior Research Scientist, CTPID, Lecturer, Dept of ME.
ACKNOWLEDGEMENTS
The author gratefully wishes to acknowledge the support and resources made available to him through the Leaders for Manufacturing Program, a partnership between MIT and major US manufacturing companies.
I first would like to thank Hewlett Packard for sponsoring my experience in the LFM program. I have learned
an enormous amount during my five years at HP. I have a great deal of respect for the people and culture of the company. After my LFM experience, I am even more committed to the values embodied in the HIP way. I only hope that my contributions to the company will reflect the investment they have made in me.
I would like to thank the LFM sponsor company, UTC/Pratt and Whitney, that supported this research project.
There were many people who made the internship an educational and enjoyable experience. I specifically want to recognize two people, my manager Mike Hawman and Daniel Budnik of United Technology Research Center. With each meeting that I had with Mike, I walked away having a greater insight into my efforts and renewed motivation. His support and encouragement were critical to the success of this project. With Dan I cannot say enough positive things. Dan acted as almost a daily sounding board for this effort. These insights are as much his as mine because a great deal of the understanding came out of our long discussions. His enthusiasm and intelligence made the effort enjoyable.
At MIT, I would like to thank my thesis advisors, Nelson Repenning and Dan Whitney. Nelson's knowledge of system dynamics and emphasis on process helped me stay on track, or return to it, with my model
throughout this project. I have learned a great deal about the methodology studying under his tutelage. Dan's analytical mind always found the shortcomings in my ideas and helped me to work through them. He was generally the first to find a problem and project its ramifications. Working with Dan has improved my problem analysis skills.
I would also like to thank my classmates in the LFM program. I have developed many wonderful friendships
during these two years, which I will keep for a lifetime. The learning was often greater outside of the classroom than in it because of this group. The strength of this program resides in the quality of the people that it recruits. I am proud to have been a part of my class.
Lastly, and most importantly, I want to thank my family and my girlfriend, Maria. They have been a constant source of support and love during the entire two years. Maria, especially, has been my source of inspiration. It is for her patience and care that I dedicate this thesis.
TABLE OF CONTENTS
1 IN TR O D U C TIO N ...---.. --... 13
1.1 PRATT UNDER THE OLD M ODEL ... 14
1.1.1 "Razor blade" m odel.... ... 14
1.1.2 Afterm arket service strictly to support sales... ... 14
1.1.3 Afterm arket fundam entals... .... 15
1.2 PRATT UNDER THE NEW M ODEL... 15
1.2.1 Financial driver ... 15
1.2.2 Competitiveness driver ... 15
1.3 PROJECT OBJECTIVE ... 16
1.3.1 Optim ize across businesses... 16
1. 3.2 Project scope ... 16
1.4 O UTLINE OF THE THESIS ... 17
2 O V ER H A U L BU SIN ESS O VER VIEW ... 19
2.1 A UTO REPAIR SHOP ANALOGY ... 19
2.2 O VERHAUL CUSTOM ER METRICS ... 19
2 .2 .1 T im e ... 1 9 2 .2 .2 C o s t... 2 0 2.2.3 Q uality ... 20
2.2.4 Flexibility... 20
2.3 SOURCES OF VARIABILITY ... 21
2.3.1 D aily dem and variability ... 21
2.3.2 Seasonal dem and variability... 21
2.3.3 W ork content... 22
2.4 O VERHAUL LIFE CYCLE ... 22
2.5 SHOP STRUCTURE ... 24
2.5.1 M anufacturing system design ... 24
2.5.2 H um an resources... 25
2.6 IM PORTANT ISSUES ABOUT THE FACILITY... 25
2.6. 1 Productivity improvement m ethodology ... 25
2.6.2 M anpower planning... 26
2.6.3 M anufacturing system design ... 26
3 M ETH O D O LO G Y ... 27
3.1 A TTRIBUTES OF THE M ETHODOLOGY... 27
3.1.1 Causal loops -Identifying complex system structure... 27
3.1.2 Sim ulation m odeling... 28
3.2 A PPLICABILITY TO PW EC ... 28
4 PRODUCTIVITY IMPROVEMENT METHODOLOGY ... 31
4.1 PW ES M ETRICS AND BUSINESS UNIT RESPONSE ... 31
4.1.1 P W ES m etrics ... 31
4.1.2 P WEC response to m etrics ... 32
4.2 A NNUAL PLANNING AND IM PROVEMENT TASKING... 34
4.2.1 Planning process ... 34
4.2.2 Philosophy behind tasking... 35
4.3 IM PACT OF IMPROVEM ENT SHORTFALLS...:... 35
4.3.1 Labor productivity shortfall... 35
4.3.2 Rotable pool productivity shortfall... 36
4.4 SYSTEM FEEDBACK EFFECTS... 38
4.4.1 W orkaround costs... 38
4.4.2 Result of workarounds ... 39
4.5 CONCLUSIONS ON TASKING ... 39
4.5.1 Tasking should be m oderated during growth phase ... 39
4.5.2 P W EC infrastructure makes improvement difficult ... 40
4.5.3 G oing
forward
... 415 M AN PO W ER PLA N N IN G ... 43
5.1 SOURCE OF LEARNING CURVE... 43
5.1.1 Standard work... 43
5.1.2 M aterial presentation system ... 44
5.1.3 Inform ation system ... 44
5.1.4 M ethod used to convey process specific knowledge ... 45
5.1.5 H istorical evidence of learning curve... 46
5.2 LEARNING CURVE PERCEPTION GAP... 46
5.2.1 P W ES perception... 46
5.2.2 P WEC vs. OEM m anufacturing ... 47
5.3 M ETHOD FOR STAFFING REVISITED... 47
5.3.1 Annual m anpower planning process... 47
5.3.2 H iring process ... 48
5.4 SIM ULATION M ODEL STRUCTURE... 48
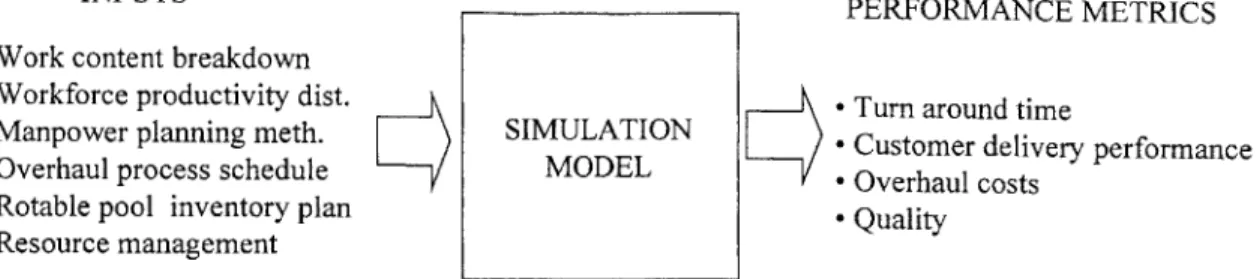
5.4.1 Inputs and outputs explained... 49
5.4.2 Process structure of m odel ... 50
5.4.3 Sim ulation m odel setup and caveats ... 52
5.4.4 O utput used in analyzing learning curve ... 52
5.5 SIM ULATION M ODEL RESULTS ... 53
5.5.1 Sensitivity analysis... 54
5.6 CONCLUSIONS ON MANPOW ER PLANNING... 59
5.6.1 Learning in a growth phase... 59
5.6.2 Staffing policy recom mendations... 59
5.6.3 G oing
forward
... 606 M A N U FA CTUR IN G SY STEM D ESIG N ... 61
6.1 FLEXIBILITY OF PRESENT MANUFACTURING SYSTEM ... 61
6.1.1 D em and variability ... 61
6.1.2 Flow interruptions ... 62
6.1.3 Emphasis on single engine... 62
6.2 BAY CONCEPT SHORTCOM INGS... 62
6.2.1 W orkforce utilization over process stability ... 62
6.2.2 Process efficiency and secondary constraints ... 63
6.2.3 Fire
fighting
... 636.3 ANALYSIS OF COM PETING SYSTEM DESIGNS ... 64
6.3.1 PWEC concern with flow-line design and demand variability ... 64
6.3.2 Sim ulation m odel m odification... 65
6.3.3 M anufacturing system comparison results ... 66
6.4 M ANUFACTURING SYSTEM DESIGN CONCLUSIONS... 67
6.4.1 Process stability... 67
6.4.2 Process focus ... 68
6.4.3 G oing
forward
... 697 LESSONS ON APPLYING METHODOLOGY... 71
7.1 PROBLEM DEFINITION ... 71
7. 1.1 Structure versus process ... 71
7.1.2 P W EC problem definition... 72
7.2 O RGANIZATIONAL BUY-IN ... 73
7.2.1 Project importance to business... 73
7.2.2 Systems thinking... 73
7.2.3 P WEC project buy-in... 73
7.3 EASE OF EXTENSION: CAN'T BE ALL THINGS TO ALL PEOPLE ... 74
7.4 A PPROPRIATE LEVEL OF BUSINESS FOR SYSTEM DYNAMICS... 74
7.4.1 Level of aggregation... 74
7.4.2 Recom mended direction in P WES ... 75
8 CO N CLU SIO N S... 77
8.1 OVERHAUL BUSINESS MODELING INSIGHTS ... 77
8.1.1 Tasking insights ... 77
8.1.2 M anpower planning insights ... 78
8.1.3 M anufacturing system design insights ... 78
8.2 SYSTEM DYNAMICS M ODELING INSIGHTS... 79
8.2.1 Problem D efinition ... 80
8.2.2 Organizational involvement... 80
8.2.3 Future m odeling ideas for P WES ... 80
9 BIBLIO G R A PH Y ... 81
10 APPENDIX - SIMULATION MODEL STRUCTURE ... 83
10.1 EXPLANATION OF M AJOR SUBSECTIONS... 10.1.1 M anpower distribution ... 10.1.2 Engine & M odule operations...
10.1.3 Rotable pool m anagem ent ... 10.1.4 Resource allocation... 10.2 M ODEL VARIABLE DEFINITIONS...
10.2.1 Initialization variables - P WEC line _A specific num bers ... 10.2.2 M odel equations... 83 83 85 86 88 89 89 95
LIST OF FIGURES
FIGURE 1-1: MRO BUSINESS INTERACTIONS - EBIT OPTIMIZATION GOAL... 16
FIGURE 2-1: PROCESS SCHEDULE BREAKDOWN... 23
FIGURE 4-1: RESPONSE TO REVENUE EXPECTATION ... 33
FIGURE 4-2: RESPONSE TO EBIT EXPECTATION ... 33
FIGURE 4-3: PROJECTED RESULTS OF PRODUCTIVITY TASKING ... 34
FIGURE 4-4: IMPACT OF PRODUCTIVITY SHORTFALL (MODIFIED FIGURE 4-3)... 37
FIGURE 4-5: WORKAROUNDS DRAIN RESOURCES (MODIFIED FIGURE 4-3) ... 39
FIGURE 5-1: SIM ULATION M ODEL OVERVIEW ... 49
FIGURE 5-2: DISASSEMBLY TASK APPROXIMATION FOR SIMULATION MODEL ... 51
FIGURE 5-3: ASSEMBLY TASK APPROXIMATION FOR SIMULATION MODEL... 51
FIGURE 5-4: SIMULATION MODEL DEMAND PROFILE ... 52
FIGURE 5-5: TAT PERFORMANCE AS A FUNCTION OF TIME, XX% DEMAND INCREASE ... 53
FIGURE 5-6: IMPACT OF HIRING DELAY ON TAT, SAME DEMAND PROFILE ... 55
FIGURE 5-7: IMPACT OF LEARNING CURVE ON TAT, SAME DEMAND PROFILE... 56
FIGURE 5-8: IMPACT OF OJT ON TAT, SAME DEMAND PROFILE... 57
FIGURE 5-9: D EM AND PROFILE RAM PS... 58
FIGURE 5-10: IMPACT OF DEMAND PROFILE ON TAT ... 58
FIGURE 6-1: FIRE-FIGHTING LOOP AS A RESULT OF DELAYS, MODIFIED FIGURE 4-5... 64
FIGURE 6-2: TAT PERFORMANCE: COMPETING MANUFACTURING SYSTEM DESIGNS... 66
FIGURE 6-3: CUMMULATIVE DAYS LATE: COMPETING MANUFACTURING SYSTEM DESIGNS ... 67
FIGURE 7-1: CLASSIC SYSTEM DYNAMIC REFERENCE MODES... 72
FIGURE 10-1: W ORKFORCE DISTRIBUTION: MECHANICS ... 84
FIGURE 10-2: OPERATIONS STRUCTURE: ENGINE DISASSEMBLY AND INSPECTION...85
FIGURE 10-3: ROTABLE POOL: ENGINE PARTS ... 87
1 Introduction
A major transformation in the business model of the jet engine business has been occurring over the last
five to ten years. The industry focus is changing from a strict product orientation to one in which service is an increasingly important factor. There are two major drivers of this change. The first driver is the airlines' emphasis on core competencies and alignment of expense outflows with the revenue stream. The focus on core competencies is leading to significant outsourcing by the airlines of non-core activities such as engine maintenance. The focus on expense and revenue alignment by the airline is giving rise to engine flight hour based service and lease contracts on engines. These long-term service contracts are breaking down the historical "razor blade" business model, sell the engine at a loss to lock in the revenue stream of highly marked up spares, because the engine service provider is now carrying the spare replacement costs.
The second driver is increased engine reliability. Engines are staying in service longer and requiring fewer part replacements' over their life. This is driving down the number of spare engine and spare part sales, which has historically been the life-blood of the engine OEM. The result of this transformation is that Maintenance, Repair and Overhaul (MRO), which is the service portion of the business, has become the major source of growth in the engine business.
The OEMs are responding to these changes by expanding their emphasis from spare parts sales to a broader service based focus. With new engine sales, the emphasis is on bundling maintenance contracts over the life of the engine to guarantee the MRO revenue streams from the life of those engines. With the existing engine base, efforts are underway to build market share through both the acquisition (and partnering) of smaller shops (or airline overhaul facilities that are being spun-off) and more aggressive pricing to increase share.
This market opportunity in service is greatest for Pratt and Whitney because it has the largest installed base of any of the three major OEM's, greater than 50% of the engines in service are P&W, and the smallest market share in MRO2. Pratt realized this opportunity around 1993 and began aggressively growing its aftermarket business, Pratt and Whitney Engine Services (PWES). Today PWES has a major role in Pratt achieving its financial objectives.
The service opportunities in the aftermarket are extensive and PWES is aggressively participating in all of them. As mentioned, spare parts are very expensive so inventory management is a very valuable service in this market. Pratt participates in this market for both new and used spare parts. Pratt also has engine overhaul shops and a wide variety of part overhaul and repair facilities. Finally, Pratt has an organization
Statistics indicate that older engines consume themselves 3 times in parts during life while the modern engines are only projected to consume themselves once (M. Mecham article ).
focused on fleet management, the leasing of engines to airlines. All of these businesses are run as stand alone entities with P&L responsibility. There is a significant amount of interaction between them. In PWES management there is the belief that the opportunity exists to define a structure between these businesses that produces a global profit optimum for PWES which is greater than the sum of the local profit optima for the individual businesses.
The impetus for this thesis is a desire to develop a simulation model of the businesses to enable the search for a business structure that yields this global optimum. Because of the magnitude of the undertaking, this thesis takes only the first step in construction of this model. The focus of this thesis is the overhaul business because it is at the heart of the aftermarket. More specifically, the focus is the impact of the revenue and profit growth requirements on one particular overhaul line, line_A, in a facility which will be called Pratt and Whitney Engine Center (PWEC) in this thesis.
1.1
Pratt under the old model
1.1.1
"Razor blade" model
I think it's important to step back and explain the structure of the 'razor blade' business model that has
dominated the industry until recently. The engine OEMs' dependence on spare parts sales is a result of the ruthless price competition that exists in new engine sales. The airlines want airframes to be qualified with at least two different engine options, which enables them to gain price leverage over the engine OEMs. There is a strong incentive on the part of the OEM to get engines into the market and an airline's fleet because of the combination of long engine life, 15-20 years, and airline learning curve with an engine. By making a sale the OEM guarantees a future spare part revenue stream and increases the likelihood the airlines will chose its engines in the future for ease of fleet support. The result of this business model is that engines have been sold at a loss for sometime. Until the model began changing, the OEMs would respond to this front-end competition by increasing the markup on spare parts. At the beginning of each year, finance would adjust the markup percentage based on the projected spare part sales and required profit margin for the corporation.
1.1.2 Aftermarket service strictly to support sales
The magnitude of the impact of the business model transformation on Pratt cannot be understated. Prior to the shift in the early '90s, the focus of the organization was primarily on new product development, original manufacturing and spare parts sales. The company was engineering driven with a strong history of
bringing the latest technology to the market. Within this business model, the aftermarket businesses existed as a customer service function. They were there to provide services as required by the airlines to support the existing engine base.
Since service was perceived as a requirement to do business, but not a core competency, it received little management attention and investment during this period. This attitude can be seen in the manufacturing systems that exist in the MRO businesses today versus OEM. In the 1980's while Pratt invested enormous amounts of time and money into transforming original equipment manufacturing into a lean manufacturing showplace, the MRO businesses were basically untouched. The manufacturing systems in MRO are only now starting to catch up to where OEM was almost a decade ago.
1.1.3 Aftermarket fundamentals
Though Pratt was almost solely focused on the spare part sales portion of the aftermarket, parts only account for approximately 50% of the revenue available in the aftermarket. According to industry analysts, the engine MRO business was worth $6-9B annually in 95 with approximately 50-75% of this business being captive within the airlines3. MRO involves the overhaul and repair of the engine and parts and the sale of used material. The margins on these businesses are not as high as on spares, however, they are still attractive.
1.2
Pratt under the new model
1.2.1 Financial driver
Once Pratt acknowledged the transformation that was taking place in the industry, the push began inside to grow Pratt's share of the aftermarket. Since 1993 the growth has been impressive. Through a combination of acquisition and expansion, Pratt has grown revenues from $300M in '93 to $ lB in '98 while increasing margins from 7% to 18%. The goal is to double revenue again to $2B by 2003 while pushing the margins up to 20%4. PWES is now a major revenue and profit source within the corporation, and the corporation is dependent on PWES achieving its growth projections to meet Wall street expectations. This new emphasis on the aftermarket has translated into significant sales and profit growth goals for PWES' existing
aftermarket businesses.
1.2.2 Competitiveness driver
With the business model transformation that has taken place, achieving world class capability in the aftermarket service businesses is now a major goal of the organization. With this change has come a significant increase in the level of investment, management attention, and capability of the management team. PWES is now the hottest area in Pratt for managers to work. These new managers are working aggressively to improve the productivity of the businesses to make the world class goal a reality and enable the revenue and profitability growth that are now required of these businesses.
3 J.V. Pincavage, "Greenwich Air Services, Inc.," Analyst Report: Dillon Reed Equity Research, December
1.3
Project Objective
1.3.1
Optimize across businesses
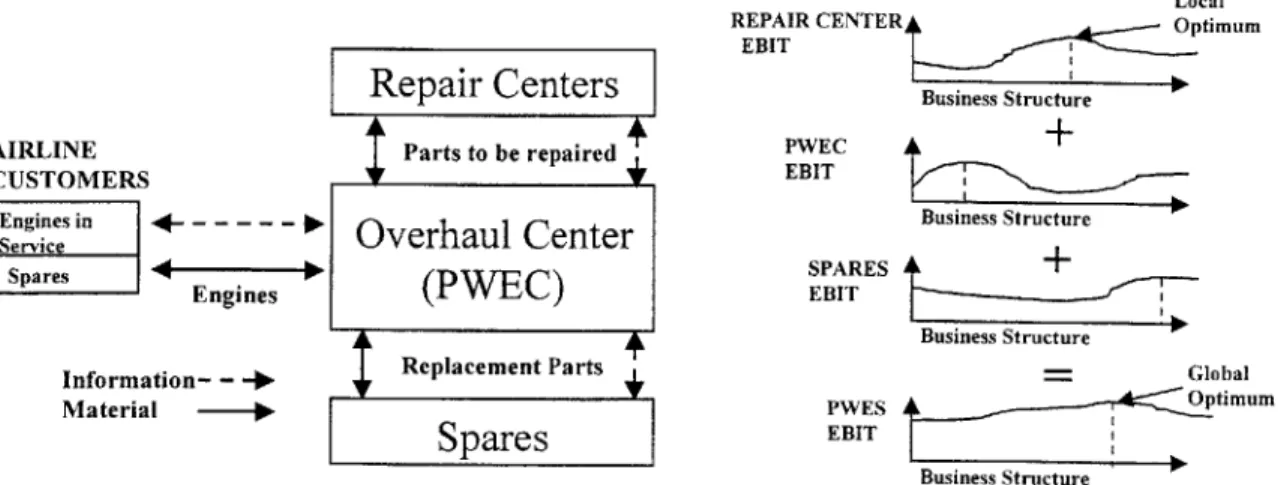
One of the first actions taken by PWES to increase performance was the institution of profit and loss responsibility in all of its aftermarket businesses. The goal of this effort was to push decision-making and ownership as far down into the organization as possible to create the impetus to improve. One of the results of this decision has been the local optimization of the different businesses. Managers in each business now make decisions based on the perceived benefit to their individual organization's financial performance. Because there is a lot of interaction between these businesses, there is a belief within PWES management that the opportunity exists to modify this structure to improve PWES' overall profitability. Figure 1-1 below shows the nature of the interaction with the overhaul business feeding parts to the repair businesses and purchasing parts from new and used spares. The EBIT, earnings before income taxes, charts on the right show that a potential global EBIT optimum exists which does not align with locally optimized business structures.
Repair Centers
AIRLINE Parts to be repaired CUSTOMERS
Engines in ---
Overhaul Center
Spares Engines
(PWEC)
Information- -
-Material -* 1
Replacement Parts
Spares
Local
REPAIR CENTER Optimum
EBIT Business Structure PwEC + EBIT Business Structure SPARES + EBIT Business Structure - Global PWES 74_ Optimum EBIT Business Structure
Figure 1-1: MRO business interactions - EBIT optimization goal
The motivation, and long-term goal, for this thesis is the construction of a framework or model of this structure that can be analyzed to understand what other configuration opportunities exist.
1.3.2
Project scope
The construction of a model of all of Pratt's aftermarket businesses is beyond the scope of a six-month internship. To bound the project to a reasonable level for this thesis, the decision was made to concentrate on the engine overhaul business. Though engine overhaul has the lowest gross margins in the aftermarket, it is a critical business to control. The facility that handles the engine MRO for a customer has a significant amount of influence over where the part repair and replacement business is directed. Thus, overhaul
resides at the very center of PWES' aftermarket businesses, which makes it an ideal place to start the modeling effort.
This thesis reflects the results of that effort to build a structural model of the overhaul business. It is important to point out again that Pratt's aftermarket businesses are still in the midst of this transformation. There are many programs that the new management teams have developed to improve the performance of these businesses, which are still early in the implementation and adoption stages. PWEC lineA is in this group. The results, which I will show, thus, reflect more the philosophy and structure of the business as it had been operated under the old model rather than how it will be operated going forward under the new model. To provide a focus to the analysis, I concentrate on identifying those aspects of the old business structure that could prevent PWEC lineA from achieving its growth objectives. My goal with these insights is to identify important elements in the business, which the new managers should consider as they go forward.
1.4 Outline of the thesis
Chapter two provides an overview of Pratt's engine overhaul business in PWEC and its demand environment. Chapter three explains the methodology that is used in the analysis on PWEC and the rationale for why it has been chosen. Chapter four discusses a passive improvement methodology followed
by PWES and the importance of properly managing it during a growth phase. Chapter five focuses on the
staffing policies that are used by PWEC and the impact of those policies not properly reflecting the learning curve or hiring delay that exists within the facility. Chapter six discusses the shortcomings of the present manufacturing system design and compares the performance of the existing job shop design to a flow-line design being promoted by PWES. Chapter seven contains lessons learned on applying the modeling methodology to problems of this nature and recommends how future-modeling efforts should be structured. Finally, the thesis concludes with a wrap-up of the insights.
2
Overhaul business overview
The intent of this section is to provide an overview of the jet engine overhaul business. This will first be done through an analogy to an auto repair shop, an operation most people should have an understanding of. With this analogous reference frame in hand, the important customer metrics will be explained. Next, the high variability demand environment in which the shop operates will be described. Once these points have
been made, an overview will be given of an overhaul's life cycle, which will be followed by an explanation of how the human resources are organized in the shop. Finally, the relevant challenges facing the overhaul facility studied will be detailed.
2.1
Auto repair shop analogy
In the author's initial visit to PWES during the spring, the engine overhaul business was referred to as a
very expensive auto repair business in its basic work content, shop floor scheduling and management.
Though there are areas where the analogy breaks down, by and large the metaphor is an apt one. The work done in an overhaul is similar to an auto repair facility:
* engine arrives
e diagnosis is performed on the engine and a workscope generated * cost estimate is generated
* workscope and cost estimate are negotiated with the customer * upon agreement the engine is disassembled to be repaired
* parts are either racked as OK, shipped out for repair or scrapped (and replacements ordered) * when parts return, the engine is reassembled
* engine is tested and shipped back to the customer
The analogy also holds with regard to shop organization, which will be discussed later. The major
shortcoming in the analogy is that auto repair shops seldom actually repair parts because the labor cost is so high relative to the component costs. In the jet engine business repair is the default choice for parts, if feasible, because of the significant costs of replacement.
2.2
Overhaul customer metrics
To understand the overhaul business one must begin by understanding what is important to the customer. For airline customers there are three basic categories of metrics: time, cost and quality by which an overhaul shop is judged.
2.2.1
Time
Time is a critical issue for the airlines because they must carry an inventory of spare engines to support the fleet while engines are in the overhaul process. The amount of time an engine takes to be overhauled and
incurred by the airline. The time metric used in the overhaul business is Turn Around Time (TAT), which is the calendar time from when the shop receives an engine until it leaves the facility to be shipped back to the customer. Delivery reliability is the variability metric used to track on-time performance. PWEC defines it as percent on-time deliveries. From the data at PWEC, and conjectural information on the industry, this is an area where none of the major players excel, with 80% being considered outstanding.
2.2.2 Cost
Overhaul cost is the second major metric category on which a shop is measured. The typical price of an overhaul for the engine line analyzed by the author is on the order of a couple million dollars. The overhaul business is often referred to as a time and materials business because the two major components of the costs are the labor time required to disassemble and assemble the engine and the material costs of repairing or replacing worn parts. Between these two cost components, materials account for
approximately 80% of the costs. To a certain extent airlines can trade-off costs versus TAT through the use of rotable inventory. Rotable inventory is the name given to the customer owned parts inventory carried by the overhaul shop. It is called rotable because the parts 'rotate' from an engine, through the repair cycle, to inventory and finally back to a different engine. Rotable inventory enables an airline to shrink TAT by eliminating the need to wait for a part to return from repair. Parts are pulled from rotable to rebuild the engine, which speeds its processing. The airline is, thus, trading off time for cost because it pays additional fees to setup the inventory and use it.
2.2.3
Quality
The final critical metric category to the airlines is quality. There are two quality measures of importance to the airlines: performance and reliability. The performance metric used is Exhaust Gas Temperature (EGT) margin. EGT margin is the delta between the max exhaust gas temperature at take-off and the FAA allowed operational limit. The EGT margin reflects the magnitude of tip clearances within the turbine sections, which correlate to both fuel efficiency and operational time allowed before the next required overhaul. Because of the thermal cycling in the engine, EGT degrades over time. Reliability relates to the quality of the overhaul process in the shop: was the engine properly diagnosed, repaired and reassembled. The metrics used are number of in-flight shutdowns (IFSDs) and number of unexpected engine repairs
(UERs) for a shop in a given time period.
2.2.4 Flexibility
PWEC competes not only on these metrics but also on flexibility. Management advertises PWEC as a
one-stop shop for engine overhaul and repair, and they are willing to take on almost any job. At one level this translates into a willingness to write contracts of quite differing TAT commitments forthe same engine line based on different customers willingness to pay for TAT performance through increased rotable inventory costs. There are customers on the line I studied where the difference in TAT commitment is a
factor of two because of one's greater willingness to use rotable inventory. On another level, it translates into a willingness to place customization requests from a customer above the process stability of the shop.
A good example of this is PWEC's willingness to allow airlines to individualize their fit prioritization,
which increases the information processing challenge of the inspectors.
2.3
Sources of variability
An overhaul facility faces many of the same challenges in effectively managing its workload, workforce and inventory as an auto shop. If the facility has significant visibility with regard to engine arrival timing
and work content, it can plan inventories and level load the shop. Level loading provides benefits to both the overhaul facility and the airline. The overhaul facility is able to maximize utilization of its resources,
and the airline is guaranteed prompt service. Though the engines are much more expensive and the airlines more savvy customers than your normal car owner, the visibility provided to the overhaul facility, as of now, is low so these benefits are not being realized.
2.3.1
Daily demand variability
The result of this communication shortfall is that the overhaul shop is subject to significant demand variability. I mapped the interarrival time (time between engine arriving to the shop to be overhauled) for the last three years for PWEC lineA and found that the standard deviation of the interarrival time was equal to the mean. This is a significant amount of variability. To put it in perspective, for a shop that was
designed for an annual demand of -100 engines, roughly two engines per week, the weekly engine arrival rate would vary from 0 to 4 engines. Given the large variability, queues inevitably form. This is an issue for the shop because it is being measured on its TAT, which for contract customers starts when the engine arrives at the facility. If PWEC lineA is unable to deliver the engine on time, it pays a penalty for every day that the engine is late to the customer.
2.3.2 Seasonal demand variability
The interarrival variability that PWEC is subjected to is exacerbated by the annual cyclicality of the industry. The major travel seasons are summer and the holiday season around New Year, so the heavy overhaul periods are late winter and the start of fall. The demand volume during the high seasons for engine overhauls can be >50% higher than during the low periods. This exacerbates the challenges in managing the shop because there are no exceptions made in the contracts for shop workload.
To handle the cyclicality, the shop is intentionally understaffed relative to its projected annual volume by a fixed percentage. Labor hours have no shelf life (can't be stored), so by understaffmg, the shop is able to reduce its exposure to this cost during the low demand periods. The result of this approach, however, is that during the heavy periods, overtime levels for the workforce saturate for a significant length of time.
2.3.3
Work content
In addition to the engine demand variability, the shop is also subject to work content variation. There are two levels to this variation: within an engine model and across engine models.
Within a model the variation is due to job type. Similar to an auto, there are FAA defined schedule triggers for when an engine needs to be serviced and what needs to be overhauled. The major preventative
maintenance driver is rotating component fatigue5
. The components in the hot section of the engine, combustor and turbines, are subjected to much greater heat, stress and fatigue, so the frequency of overhaul is greater for that portion of the engine than the cooler compressor. Complete engine overhauls and hot section only overhauls made up the majority of the engine shop visits for PWEC lineA, but they were not the only work. In addition to overhauls, the shop also performed modification upgrades, repairs (such as compressor blade failures) and engine investigations. Often the shop would both repair and overhaul an engine if it was brought in for the repair near the required PM time. The work content on these jobs varies both by the type of job being performed and the extent of damage to an engine.
Across engine models, the variation is due to product design differences and the associated problems required in supporting a family of slightly different products. These differences can be significant depending on the magnitude increase in thrust power from one model to the next within a family. On line_A, the largest engine in the family was quite different than the smallest with additional stages in the major rotating modules of the engine.
2.4
Overhaul life cycle
The life cycle of an overhaul is broken down into three distinct phases: induction, the repair window and assembly. This is a serial process for individual parts and subassemblies, but there is overlapping of the phases. Figure 2-lindicates what the TAT breakdown and overlap would be between the major process steps if the overhaul took 100 days6. The overlapping exists because of the stacked nature of the assembly. The four major rotating modules (from front to back they are Low Pressure Compressor (LPC), High Pressure Compressor (HPC), High Pressure Turbine (HPT) and Low Pressure Turbine (LPT)) in the engine are assembled onto a pair of concentric shafts. The disassembly process starts from the outside of this stacked assembly and works in, which is why the LPC and LPT are the first two modules shown
completing induction in the figure. The reverse is true for the assembly process. The engines are treated as
5There are two types of fatigue triggers. The first is time and cycle fatigue which translates into limits for
operational hours and take-off /landing cycles on the rotating parts. The second is temperature limit fatigue. There is an allowable limit on the exhaust gas temperature (EGT) of the engine during take-off. There are a complex set of FAA rules regarding these EGT excursions and how long the engine can be flown following them before requiring an overhaul
6 Throughout this thesis a 100-day TAT has been used for examples, and does not reflect actual TAT of PWEC lineA.
individual projects in the shop, and the progress of each is tracked relative to its own schedule. The schedules are generic for a given engine model.
LPC
LPT Process breakdown for a
HPC generic 100 day TAT
Induction -27 days (diag, disassy, inspect)
Repair window -60 days (track parts, procure replacements)
Assembly - 36 days (assembly, test, prep for ship) HPC/
HPT LPT/
LPC
0 10 20 30 40 50 60 75 90 90 100
TAT (in days)
Figure 2-1: Process schedule breakdown
The induction process consists of the engine diagnosis, disassembly and part inspection. Diagnosing an engine is a convoluted process, which can involve the airline and PWVEC's customer service and engineering groups. Once a workscope has been agreed upon with the customer, the engine is started through the process. For a complete overhaul this entails removing all external components and 'chunking' the engine down into subassemblies and modules to be sent to their respective areas. For partial overhauls the disassembly process will vary depending on what portion of the engine is the focus of the overhaul.
As the parts are removed, they are segregated by section7 onto shelves for the inspectors to review. The parts are reviewed and dispositioned into one of three categories: OK for assembly, repair or scrap. The majority of the information that the inspector uses for inec32ng and documenting parts is in paper form which is why information retrieval and processing require a significant amount of effort in the inspection process. The issues with this paper inspection process are explained in greater detail in Chapter 5.
Once the inspection process is complete, parts enter the repair window. From PWVEC's perspective this is the most challenging portion of the process because it is the one over which they have the least control. External Pratt business units or suppliers handle the majority of the repairs. The goal is to have the right
parts available in time for assembly to begin on schedule. The PWEC material handling group tracks the progress of only those components in the repair cycle that they feel have the greatest potential to impact the assembly schedule for that engine. Parts are procured from the rotable pool to replace components that are expected to arrive late. This process is called buying-to-expedite (BTE). If a part does not arrive on schedule, the shop scrambles to find a replacement that will allow assembly to begin. If the part is in rotable inventory a BTE will be done. If not, the shop will 'swap' an OK part from an engine from the same customer that is further upstream in the process. Delivery reliability from the repair vendor base is a significant problem, so the organization is regularly scrambling to find parts.
The assembly process, as I define it, consists of the re-assembly of the engine and final test. As mentioned above, the progress of the engine through the shop is monitored against its schedule. The detailed schedule indicates when each of the 32 sections should be released to its required place for assembly. Following the assembly of each section, the section is inspected and any necessary assembly measurements are taken. When assembly is completed, the engine is run through a series of performance tests to validate the quality of the overhaul. After test, a final inspection is made and the engine is packaged up and sent back to the airline. The TAT clock stops on the overhaul when it leaves the facility.
2.5 Shop structure
2.5.1 Manufacturing system design
Historically, PWEC lineA's manufacturing system perfectly fit the auto repair shop analogy. Similar to a large auto shop, the facility was configured as a job shop with a collection of bays where engines could be brought in and worked on. This had been the default design because of the perceived flexibility in
accommodating the demand variability. As long as there were resources available (manpower, tooling and the appropriate parts) an engine could be worked on. The bay design allowed engines to be parallel processed as demand dictated.
This design has changed over the last few years under the new management team. These changes have been made to improve the TAT. First, the modules have been split out to dedicated areas, or work cells, by module type. Second, a focused induction area has been created through which most engines are funneled for disassembly and inspection. The only area in which the bay design remains untouched is engine assembly.
Though the manufacturing system is not a pure job shop at this point, I mention the historical design because the culture has not caught up with the physical process changes. The floor is managed based on engine schedule priority. Resources are allocated to an engine based on where it is relative to its schedule goal. When there is a resource constraint, which is a common occurrence, resources are allocated to those
engines closest to the end of the process. Under this operational philosophy, the focus is always on the near-term goal of getting engines out the door. The result of this policy is that engines earlier in the process are starved for resources until they move up in the prioritization queue. As in a classic job shop, priority is given to the individual job over maintaining flow throughout the overhaul process.
2.5.2
Human resources
There are three categories of workers that are involved in the overhaul process: mechanics, inspectors and material handlers (marshalling). These groups have distinct responsibilities throughout the process. There
is almost no resource reallocation between the groups because of the union and FAA requirements8
. The inspectors and mechanics are the two core resource groups that are directly engaged in the overhaul process and there is approximately an equal number of each. The mechanics are responsible for disassembling and re-assembling the engine. The inspectors are responsible for the inspection and disposition of parts in the
induction process (called BX), the inspection of incoming parts from the repair cycle and the rotable pool (called CX) and the inspection of completed assemblies in the assembly process (called LX). The material handlers support the movement of material through the in-house processes and manage the material while it
is in the repair cycle. There is only a quarter the number of expeditors as the other two groups. The analysis in this thesis focuses solely on the inspectors and mechanics because they are the core resource groups in the process. It is important to note that PWEC has put in place plans to collapse the inspector and mechanic categories to achieve more efficiency and flexibility in the workforce.
As mentioned above, The shop floor has been split into two major areas: modules and engines. All the induction and assembly processes for a given component take place within the allocated area, so all the work on the High Pressure Compressor (HPC), for example, will take place in the HPC module area. Inspectors and mechanics tend to stay within their area, i.e. modules, but work across the processes (induction and assembly) performed there.
2.6
Important issues about the facility
As mentioned in the introduction, PWES is now the major source of revenue and profitability growth for all of Pratt. These expectations have been passed on to PWEC. The issues that will be analyzed in this thesis all relate at some level to the challenges in achieving these growth goals.
2.6.1
Productivity improvement methodology
The first issue that will be discussed is the passive methodology (called tasking) that is used by PWES to drive productivity improvement into PWEC. Tasking occurs during the annual planning cycle. PWEC submits its bottom's up estimate of the resource levels required for the upcoming year to PWES, which is
then 'tasked' down a fixed percentage. Stressing the organization to encourage improvement is a common methodology used in Pratt. My analysis shows that the use of this methodology needs to be properly moderated during a growth phase because of the implications of a productivity shortfall.
2.6.2 Manpower planning
The second issue that will be discussed in this thesis is the manpower planning methodology that is in use at PWEC. As will be explained in more detail later, there exists a significant learning curve in the overhaul process for the mechanics and inspectors because of the manufacturing system design, some infrastructure shortcomings and the general complexity of the product and its FAA and technical documentation. The present process used for planning headcount for a given year fails to capture the distribution of the workforce on this learning curve. This is an issue in a growth period because the method overestimates the productive capacity of the shop, which causes it to understaff in the short term relative to the required workload. A model of PWEC lineA's overhaul process has been built to show the impact of this manpower planning methodology.
2.6.3 Manufacturing system design
PWES has decided that PWEC lineA needs to migrate its manufacturing system design from this modified bay concept to a flow line design9, similar to what is used in original manufacturing, to further reduce its TAT and improve productivity. The flow-line design is radically different from a bay concept because It constrains all the engines to flow through a defined series of stations, which make up the line. No longer would the facility be able to start an engine into the process simply because floor space and manpower is available. There is significant concern within the facility as to whether a flow-line can accommodate the demand variability that the shop experiences. The final section of the thesis focuses on this question of what the manufacturing system design should be for the overhaul business. The sensitivity of the competing designs to demand variability is analyzed and from this conclusions are drawn on the negative effect of the existing operational policy.
9 Flow-line: lean manufacturing system where process is broken down into a series of balanced stations with defined process steps in each station.
3
Methodology
The choice of a modeling methodology for this project was driven by the long-term goal to develop a business simulation model of the entire aftermarket. The aftermarket contains a diverse set of inter-related
businesses, so the modeling technique needs to be capable of representing and modeling a complex system. System dynamics was chosen because it has been used successfully to achieve this goal in a wide variety of similarly complex applications. As will be explained in this section, there are two stages to developing a dynamic model of a system. The first stage involves identifying the structural elements and relationships that exist between the elements, which create the dynamics being seen. The second involves translating that structural understanding into an analytical model, which can be used for simulating system behavior and testing improvement scenarios. System dynamics excels in both these stages.
3.1
Attributes of the methodology
3.1.1
Causal loops
-
Identifying complex system structure
The first stage of a modeling project involves identifying the structure that generates the behavior of interest. In complex systems this is a challenge for two reasons. First, there is a time component to the
system's response to a given input, which is often misinterpreted by individuals within the system. The time response of the system varies for different inputs, so it is difficult for an individual to discern which
decision caused a given response, especially if there is a large time lag involved0. Second, there is seldom a single individual whose detailed knowledge and influence spans the entire system. The knowledge of individuals within the system is usually limited to their span of control, be that organizational or physical. Because there is no comprehensive understanding of the larger system, each component is managed as though it was stand-alone. Over time these individuals develop simple 'mental models' of how the system operates based on the inputs and outputs they have visibility to. These mental models seldom correlate across the system.
Causal loop mapping is a tool for graphically representing the important variables of a system and their interrelationships. These maps are developed through interviews and /or group brainstorming sessions with the individual decision-makers within the system. Through the collection of these various simple mental models, an understanding of the larger system structure is developed and a causal loop diagram built. The value of causal loop mapping is that the diagrams bring everyone within the system to a common and more complete understanding of the relevant structure of that system. The loop diagrams also convey, at a conceptual level, the structure within the system that is creating the behavior of interest. In many systems,
1 The inertia of the system will dictate the magnitude of the phase lag that exists between a given input and its response. If a large time lag exists, individuals often will miss the correlation that exists between the
the mapping alone provides sufficient insight into the structure to devise policies to modify the behavior of interest.
Causal loop diagrams are so described because the system is always drawn as a collection of feedback loops. Only those variables that impact system feedback are considered because the goal is to understand the dynamic response of the system. Causal loop diagrams consist of two types of loops: balancing loops and reinforcing loops. In balancing loops the behavior of the system drives the variable of interest to an externally set reference level. Balancing loops are inherently stabilizing. Reinforcing loops, on the other hand, are not. In reinforcing loops the behavior of the system drives the variable of interest in a given direction unbounded. In a system that has a combination of balancing and reinforcing loops, the system will remain stable as long as the balancing loops dominate. Once the reinforcing loops gain momentum, the system goes unstable. Causal loop modeling is valuable for identifying the structure but it is not a tool that can quantitatively answer whether a system will remain stable or when a reinforcing loop will start to dominate. It is a static representation of system structure.
3.1.2 Simulation modeling
It is in this next stage, simulation modeling, where a quantitative model of the system is built to determine the impact of the interactions of the different loops. These two stages are complementary both in their construction and insights. The simulation model is built to reflect the structure identified in the causal loop modeling. The benefit of the simulation model is conceptual validation of the causal loops and scenario testing. It is impossible for individuals to intuit the dynamics of a complex system with more than a few feedback loops. For a given system input, the simulation's output can be analyzed to determine the efficacy of the model and the causal structure that supported it. This analysis can involve comparing the output either to reality or to the decision-makers perception of how the system would perform depending on which is most feasible and relevant. Once there is acceptance of the model's validity, it can be used for scenario and sensitivity testing. System structural changes can be devised and tested quickly in the simulation model to determine their effectiveness before being deployed on the real system. The final value of the simulation model is as a sales tool to management and the organization. Simulation results can be used to quantify the value of a change to management. If everyone in the organization has bought into the assumptions on which the model is based, there should be agreement on the output.
3.2
Applicability to PWEC
System dynamics is a powerful tool for analyzing PWEC because the business consists of a collection of interdependent groups and processes with significant time varying components that affect system performance. There are time lags within the system that are not well understood. There are also
managers within the larger system that control PWEC who do not fully understand the dynamic structure of the overhaul business. The modeling effort provides benefits on both these fronts. It quantifies some of the
system time lags as well as their impact. It also provides an educational tool, which can be used to explain the dynamic structure of the overhaul business as it is presently configured.
Both stages of the modeling technique were used in this analysis and can provide valuable insights for managers within the system. The causal loop analysis provides insight into the potential impact of PWES' methodology for driving productivity improvement into PWEC. The simulation model provides insights
into the impact of the present staffing policy given the learning curve that presently exists in the organization. It also quantifies the value of changing the manufacturing system design and operating policy. The following three sections will explain these insights from the modeling effort in detail.
4
Productivity improvement methodology
Pratt & Whitney is a firm believer in the value of pushing profit and loss (P&L) responsibility as far down into the organization as possible to drive accountability and motivate local management teams. PWES corporate management approach is consistent with this. In PWEC there are two levels of P&L
responsibility, plant level and engine line level. The plant general manager (GM) is responsible for the total performance of the shop". A line GM is responsible for the performance of his individual business unit: sales, marketing, operations & finance. Because the businesses are run as P&L's, PWES manages them through a collection of metrics, which are reviewed on a monthly basis. In alignment with the P&L philosophy, a GM's financial compensation package is heavily incentivized to his unit's performance on
the metrics. Everything is, thus, setup to insure that the GM is motivated to keep his line focused on what PWES perceives is important. In addition to the business performance metrics, PWES sets a productivity improvement level, which is defined as the tasking percentage, that a business is forced to achieve. This section will focus on that improvement methodology and the potential ramifications of not properly managing it during a growth phase.
4.1
PWES metrics and business unit response
4.1.1
PWES metrics
The metrics PWES uses to track an engine line's performance can be split into four basic categories: financial, customer service, quality, and safety. The performance of a business unit is tracked relative to the expectations set forth for each metric by PWES at the beginning of the year. The metrics are as
follows:
Financial:
" EBIT: earnings before interest and taxes. (operating profit) * Total revenue: total revenue from sales:
Customer service:
* TAT: turn around time (average by engine model) e Meeting customer commitment: % on time deliveries Quality:
e Customer complaints: these are call backs for problems which are field fixable
" Customer returns: engines that have been pulled off wing and returned because of a mistake in the overhaul process.
* Customer scorecards. Safety:
e Injuries on the job, days lost to injury, etc..
From discussions with the GM of line__A, I found that the financials dominate in importance, followed by the customer service metrics. Together these four metrics account for 90% of PWES' attention. Total revenue and EBIT are given equivalent importance in the monthly reviews because the failure of meeting either will impact Pratt's bottom line. Until the financials are at or above expectation level, the GM stated that he has little control over his business because he can't freely allocate money. The quality metrics are given less priority in PWES reviews because quality failures are infrequent and dealt with on a case by case basis. It is the behavioral impact of the dominant time and cost metrics that is analyzed in this thesis.
4.1.2
PWEC response to metrics
In this period of high growth expectations for PWES, growing the business is a requirement to meet the revenue goal. According to the lineA GM, 65% of his time is spent on sales and marketing related
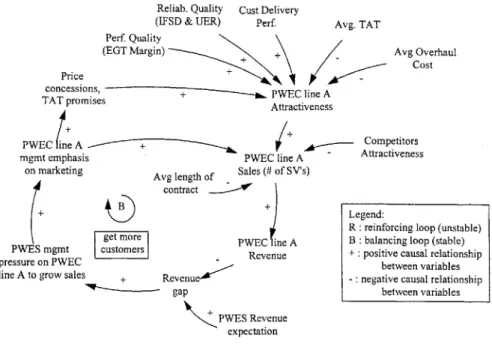
activities. There are two basic mechanisms that the GM uses to build sales: awareness building and what I define as 'promises'. From my six months PWEC it is obvious that a significant amount of the GM's time is spent visiting, touring and communicating with customers on the capability that his line either presently has or is working to build. In some cases this is a technical capability that is being developed. In others it is the benefit of a proposed process change, as in the case of the manufacturing system redesign from a job shop structure to flow-lines. The number of overhaul service providers is relatively small, and the airlines have a basic awareness of the relative strengths and costs of these different providers; so in many cases PWEC lineA is growing through customer acquisition from competitors. To entice these airlines to switch, the GM sells the projected productivity improvement, in the form of reduced TAT or overhaul cost, of the process change. Through these actions the GM builds his sales to meet the revenue expectation. This dynamic is expressed graphically as the "get more customers" balancing loop in the causal diagram shown in Figure 4-1. The marketing actions taken by the GM in the business unit are proportional and in response to the gap that exists between the unit's revenue and PWES' expectation.
page#32
" This redundant layer of general management has since been eliminated. All the line GMs have been rescoped to operations managers. The plant GM is now the sole individual with P&L.