HAL Id: hal-03028546
https://hal.archives-ouvertes.fr/hal-03028546
Submitted on 27 Nov 2020HAL is a multi-disciplinary open access
archive for the deposit and dissemination of sci-entific research documents, whether they are pub-lished or not. The documents may come from teaching and research institutions in France or abroad, or from public or private research centers.
L’archive ouverte pluridisciplinaire HAL, est destinée au dépôt et à la diffusion de documents scientifiques de niveau recherche, publiés ou non, émanant des établissements d’enseignement et de recherche français ou étrangers, des laboratoires publics ou privés.
Effect of Polymer Architecture on the Phase Behavior
and Structure of Polyelectrolyte/Microemulsion
Complexes (PEMECs)
Miriam Simon, Emanuel Schneck, Laurence Noirez, Sofia Rahn, Irina
Davidovich, Yeshayahu Talmon, Michael Gradzielski
To cite this version:
Miriam Simon, Emanuel Schneck, Laurence Noirez, Sofia Rahn, Irina Davidovich, et al.. Effect of Polymer Architecture on the Phase Behavior and Structure of Polyelectrolyte/Microemulsion Complexes (PEMECs). Macromolecules, American Chemical Society, 2020, 53, pp.4055 - 4067. �10.1021/acs.macromol.0c00236�. �hal-03028546�
ABSTRACT: We studied polyelectrolyte/microemulsion complexes (PEMECs) formed by the biopolymer sodium hyaluronate (NaHA) and cationic oil-in-water (O/W) microemulsion droplets. Around equimolar charge conditions, a two-phase region with a liquid−liquid phase separation (coacervate formation) is observed, while mixed complexes are formed at polyelectrolyte excess. The largest complexes are found close to the phase boundary. The detailed structure of these complexes was determined by a combination of static and dynamic light scattering (SLS and DLS), small-angle neutron scattering (SANS), and cryo-transmission electron cryomicroscopy (cryo-TEM). Interestingly, these complexes formed with NaHA are much more elongated compared to previously studied complexes formed with sodium polyacrylate (NaPA). Similar observations were made for another polysaccharide, sodium carboxymethyl cellulose (NaCMC). Apparently, the persistence length of the complexes is largely proportional to the persistence length of the polyelectrolyte, which was determined by analyzing the SANS data with a specifically developed model. Accordingly, the size of the complexes formed with stiffer biopolyelectrolytes becomes much larger, increasing with the molecular weight (Mw) of the polyelectrolyte. In summary, we conclude that the size and structure of the PEMECs can be controlled by the
type of polyelectrolyte, mixing ratio, size of the microemulsion droplets, and Mw of the polyelectrolyte. This means that the polyelectrolyte addition can be used as a key structuring element for the size and shape of such complexes.
■
INTRODUCTIONMicroemulsions classically come in the structural form of oil-in-water (O/W), or water-in-oil (W/O) droplets, or as bicontinuous structures.1,2 These structures are stabilized by the presence of a surfactant (and often also a cosurfactant3,4). Their structural units are typically in the size range of 2−20 nm, which explains their optical transparency. O/W micro-emulsion systems are particularly promising because of the high solubilization capacity for hydrophobic molecules in aqueous solution, which plays a key role in delivery systems, detergency, decontamination, etc.5−7
Microemulsion droplet systems have been studied to some extent. However, for some applications, one might be interested in modifying their properties and/or superstructures for further purposes. A classical case is the viscosity control, as microemulsions are generally low-viscous liquids, but for many applications, higher viscosities are required. This question is
usually addressed by either enhancing the viscosity of the continuous phase8 or cross-linking individual droplets by a polymer with a number of hydrophobic linkers.9,10
Another interesting colloidal system constitutes polyelec-trolyte/surfactant complexes (PESCs), which are formed by the ionic assembly of oppositely charged surfactant and polyelectrolyte.11 It has been shown that the electrostatic interactions of charged surfactants with oppositely charged polyelectrolytes can induce a pronounced viscosity increase for certain compositions.12Often PESCs are studied in the context
Received: January 30, 2020 Revised: April 10, 2020 Published: May 6, 2020
Downloaded via CEA SACLAY on November 27, 2020 at 15:05:18 (UTC).
of drug delivery13,14 or cosmetical and detergency formula-tions.15 However, such formulations and applications require good solubilization properties, and that is often a major difficulty in PESCs16 and accordingly has hampered their further development in this direction. Yet, this problem can become circumvented by starting with ionic O/W micro-emulsion droplets to be complexed with an oppositely charged polyelectrolyte. Such a system combines the high solubilization capacity of the microemulsion with the mesoscopic structuring effect of the polyelectrolyte.
Recently, a detailed study of the phase behavior and structure of complexes of O/W microemulsion droplets with polyacrylate (NaPA) has been carried out by some of us.17It was observed that such mixtures form self-assembled complexes with elongated structures, where the detailed structure depends markedly on the weight average molecular weight, Mw, of the polyelectrolyte, as well as on the size of the
microemulsion droplets. These interestingfindings can serve as a basis for further fundamental understanding of the assembly conditions. To develop more biofriendly formulations, it is important to explore how a change from the petrol-based and non-biodegradable polyacrylate to a biopolyanion affects the structures formed in polyelectrolyte/microemulsion complexes (PEMECs). In particular, the type of polyelectrolyte (persistence length, charge density, strength of interaction) can be expected to play a key role in the structures formed in these complexes since it is also an important factor in PESCs.18 The development of biofriendly materials is naturally important for applications in biomedicine, food modification, or wastewater treatment, where biocompatibility is of crucial importance.19−23However, on a more general note, sustainable materials derived from renewable resources are generally needed in all industry sectors to ensure our high standard of living and the well-being of our planet in the future.
To elucidate this question, we studied complexes of the previously investigated O/W microemulsion droplets3,24 composed of tetradecyldimethylamine oxide (TDMAO), tetradecyl-trimethyl-ammonium bromide (TTAB), 1-hexanol as cosurfactant, and decane as oil, where the formerly employed sodium polyacrylate (NaPA) was substituted by the biopolyanion sodium hyaluronate (NaHA). Both poly-electrolytes differ markedly with respect to their molecular architecture (seeFigure 1). Hyaluronic acid is a biopolyelec-trolyte with a sugar backbone, i.e., a polymer of disaccharides ofD-glucuronic acid and N-acetyl-D-glucosamine, which leads
to a much higher persistence length of the NaHA (9 nm) at an ionic strength of 30 mM25and about twice the value for low ionic strength26compared to NaPA (1.3 nm).27In both cases, the charge is located close to the backbone, but the charge density of the hyaluronic acid is rather low (∼1 charge/nm) compared to NaPA (∼4 charges/nm). At the same time, the charged carboxylate group of the NaHA is less accessible to interact strongly with macroions due to its more restricted
molecular mobility by being fixed on the polymer backbone. Therefore additional experiments were carried out with the sodium salt of carboxymethyl cellulose (NaCMC), a biopolyelectrolyte with a rigid polysaccharide backbone (6− 16 nm persistence length28), but sterically more easily accessible charges (seeFigure 1).
In our investigation, we focused on the phase behavior and the mesoscopic structure of the PEMECs formed with hyaluronate at neutral pH (7−8). The main parameters were the mixing ratio of microemulsion droplets and polyelectrolyte, the Mw of the hyaluronate, and the size of the charged
microemulsion droplets. The aim has been to deduce systematic correlations between the PEMEC properties and their composition, as well as the comparison to the behavior with NaCMC and with NaPA as polyanions.
■
MATERIALS AND METHODSMaterials. The surfactants used in the experiments were tetradecyldimethylamine oxide (TDMAO), received as a gift from Stepan Company, as a 25% TDMAO solution in water, named Ammonyx M (the solution was freeze-dried before use), and tetradecytrimethylammonium bromide (TTAB, 99%, Sigma-Aldrich), which was used without further purification. 1-Hexanol (>98%, Merck Schuchardt OHG) was employed as cosurfactant and decane (>98%, Fluka Chemika) as oil to form the microemulsions. The micro-emulsion droplets were prepared at a constant total surfactant concentration of 100 mM (95 mM TDMAO + 5 mM TTAB). 0, 50, or 75 mM of the cosurfactant hexanol were added, and the droplets were saturated with decane (which means 30, 80, and 200 mM decane, respectively, leading to dispersed microemulsion volume fractions of 3.0, 4.4, and 6.5%). This means that the size of the microemulsion droplets was controlled by the concentration of the cosurfactant.
In this work, we primarily employed biopolyelectrolytes, in particular, the sodium salt of hyaluronic acid (NaHA), which was used in different molecular weights: 51, 150, 360 (all Lifecore), and 800 kDa (SRD). The sodium salts of poly-acrylic acid (NaPA, 60 kDa, Sigma-Aldrich) and carboxymethyl cellulose (NaCMC, 90 and 250 kDa, Sigma-Aldrich) were employed for a generalizing comparison of polyelectrolytes (the Mwvalues always include the Na+counterion). All polyelectrolytes were used as received without further purification. The contour lengths (theoretical lengths of the stretched polyelec-trolyte chains) are 130, 370, 900, and 2000 nm for the NaHA51, 150, 360, and 800, respectively, 160 nm for NaPA60, and 200 and 480 nm for NaCMC90 and NaCMC250, respectively. Additional viscosity measurements were performed with NaHAs of 31, 186, 572, and 2073 kDa (all laboratory grade from Contipro, used as received).
Microemulsion droplets and polyelectrolytes were mixed in different charge ratios z = [−]/([+] + [−]) (where [+] is given by the TTAB units and [−] is given by the carboxylate units) while maintaining a constant microemulsion concentration of 100 mM. Samples are named according to composition: thefirst block indicates the used microemulsion by giving the amount of hexanol, the second specifies the type and Mwof used polyelectrolyte, and the mixing ratio is given in the end. For example, ME50-NaHA150-0.70 is a sample with medium-sized droplets (50 mM of hexanol) and sodium hyaluronate of 150 kDa, mixed at a charge ratio of z = 0.70. The Figure 1.Chemical structures of sodium hyaluronate (NaHA, left), sodium polyacrylate (NaPA, middle), and sodium carboxymethyl cellulose (NaCMC, right).
employed polyelectrolyte concentrations are above the overlap concentration (calculated for fully extended polymer chains) for all biopolyelectrolyte samples and most NaPA samples. The only exceptions are samples with short NaPA chains and small z ratios (the overlap concentration for NaPA05 is reached at z = 0.9, and for NaPA15 at z = 0.5).
All samples were prepared in Milli-Q water or D2O (>99.5% D, Eurisotop) for the SANS experiments.
■
METHODSStatic (SLS) and Dynamic (DLS) Light Scattering. SLS and DLS measurements were performed at TU Berlin simultaneously on an ALV/CGS-3 instrument, with a He−Ne laser with a wavelength of λ = 632.8 nm. Pseudo-cross-correlation functions for DLS were recorded using an ALV 5000/E multiple-τ correlator at 19 scattering angles, θ, ranging from 40 to 130°, set with an ALV-SP 125 goniometer. Diffusion coefficients D were obtained by plotting the relaxation ratesΓ of all measured angles according to D = Γ/q2. The SLS data were recorded in the same range of magnitude of the scattering vector (q), with
q 4πn0sin( /2)θ λ
= ·
(1) where n0is the refractive index of the solution andθ is the scattering angle. All measurements were carried out at 25.0 ± 0.1 °C in a thermostated toluene bath.
For SLS, the mean scattered intensity of the sample at each angle was normalized by the initial laser intensity, the background scattering from the solvent and the cuvette was subtracted, and the intensity was calibrated to absolute scale with a reference measurement of toluene.29
Small-Angle Neutron Scattering (SANS). SANS experiments were carried out on the PAXY instrument of the Laboratoire Léon Brillouin (LLB) in Saclay, France. Measurements were performed at 25 °C at three different configurations with sample-to-detector distances of 1.2, 5, and 6.6 m; collimation lengths of 2, 5, and 6 m; and wavelengths of 4, 4, and 12 Å, respectively, to cover a q-range of 0.03−5.4 nm−1.
Data reduction was done using the BerSANS software,30according to the standard procedure.31The raw intensity data were corrected for the scattering of the background (solvent and sample container), weighted by the respective transmissions. Additionally, the (electronic) background noise was subtracted using a cadmium sample, which absorbs incoming neutrons. The normalization and absolute scaling were done using a 1 mm reference sample of deionized water as an incoherent scatterer. Finally, the two-dimensional (2D) data were radially averaged and converted to one-dimensional (1D) scattering intensities.
Some additional measurements (ME75-NaPA samples in Figure 11) were carried out at D33 at Institut Laue-Langevin (ILL) in Grenoble, France, at sample-to-detector distances of 2(1.2), 7.8, and 12 m; collimation lengths of 2.8, 7.8, and 12 m; and wavelengths of 4.6, 4.6, and 13 Å, respectively, to cover a q-range of 0.013−6.1 nm−1. D33 has an additional detector at 1.2 m to measure the large q simultaneously to the 2 m setting. Data reduction for these data was carried out with LAMP.32
The wavelength smearing was described by the corresponding resolution parameters and was incorporated into the analysis using SASfit software.33 The wavelength spread (full width at
half-maximumFWHM) was 10%, and the size of the detector pixels was 5× 5 mm2for both instruments.
Fits were performed in absolute units, and it was assumed that all of the surfactant, cosurfactant, and oil are contained in the aggregates. The polyelectrolyte was considered as part of the solvent. More detailed information on the models used to describe the SANS data is given in the Supporting Information (SI).
Kinematic Viscosities. Kinematic viscosities were measured at TU Berlin with micro-Ostwald capillaries in a thermostated bath at 25.0± 0.1 °C, where the flow time, t, is proportional to the kinematic viscosityν: ν = η/ρ = Bt. The kinematic viscosity is the ratio of the dynamic viscosityη to the density of the fluid ρ, and B is a capillary constant. Theflow time was averaged from at least three consecutive measurements.
Cryo-TEM. Cryo-TEM images of selected samples were taken at Technion, Haifa. A small droplet of the solution was placed on a perforated carbon film supported on a TEM copper grid, held by tweezers in a controlled environment vitrification system at 100% relative humidity and 25°C. It was then blotted by a piece of filter paper, resulting in the formation of 100−300 nm thin films of spanning the holes of a perforated carbonfilm.34The specimen was then plunged into a reservoir of freezing liquid ethane, cooled by liquid nitrogen, to ensure its vitrification. The vitrified specimen was transferred under liquid nitrogen, mounted onto a Gatan 626 cryogenic sample holder, and cooled to−170 °C. All samples were observed under low-dose conditions with an FEI Talos 200C TEM. Images were recorded using novel“phase plates,” which convert phase differences between areas of the specimen to amplitude differences, thus enhancing the image contrast without resolution loss.35 The TEM is equipped with a Falcon III direct-imaging camera that allows imaging at very low electron exposure, essential for electron-sensitive specimens such as soft-matter samples. About 20 images were taken from each sample; the images were taken at different sample areas to ensure statistically relevant information.
■
RESULTS AND DISCUSSIONPhase Behavior of ME/NaHA Complexes. As afirst step, the macroscopic phase behavior of the formed complexes was
Figure 2.Phase diagrams for ME00 (R = 3.1 nm) mixed with sodium hyaluronate (NaHA, left), sodium polyacrylate (NaPA, middle), and sodium carboxymethyl cellulose (NaCMC, right) of different Mwvalues and in different charge ratios z.
studied as a function of the nominal charge ratio z = [−]/([+] + [−]) (nominal means that [+] is given by the TTAB units and [−] is given by the carboxylate units) for different molecular weights, Mw, of NaHA at room temperature. The
pH was checked to be always between 7 and 8, but not controlled by adding acid or base, to avoid adding ions to the mixture. Within this pH range, the acids are largely deprotonated and z should correspond to the actual charge ratio. The phase behavior of the samples was followed by visual inspection at regular time intervals, and documented by photographs, where the most instructive ones are given in
Figure S1, nicely showing the phase separation occurring around equimolarity. Samples that phase-separated within an hour were marked as biphasic, and samples that were stable for more than an hour, but not for a week, were called metastable. All samples that still consist of one single phase after 1 week were considered thermodynamically stable, as they also did not change visually during the course of several months.
Figure 2 (left) shows the phase diagram for small microemulsion droplets (ME00, R = 3.1 nm) mixed with sodium hyaluronate (NaHA) of different Mw values and for
different charge ratios. In this phase diagram, a very asymmetric two-phase region can be observed around the charge equilibrium (z = 0.5). While samples at polyelectrolyte excess show one clear and transparent phase, samples in the two-phase region contain a second optically transparent liquid phase thatfloats on top of a low-viscous water-rich phase, i.e., a coacervate phase of lower density is formed. When the sample is shaken, the two phases mix and the sample appears white. Upon resting the sample, the two phases phase-separate again, typically within a few hours (seeFigure S1for photos of such samples). It is interesting to note that the coacervate phase, floating on top of the other, is very viscous. This is quite different from the previously studied PEMECs with NaPA,17 where a powdery precipitate was formed, and no viscous coacervate phase was observed. The phase diagrams for larger microemulsion droplets (ME50, R = 4.1; ME75, R = 6.6 nm) mixed with NaHA are given inFigure S2, which generally show the same features. The single-phase regions at polyelectrolyte excess become somewhat smaller with increasing droplet size, as previously observed for NaPA.17
For a direct comparison, the phase diagrams of NaPA and NaCMC with small ME droplets are shown inFigure 2. Even though hyaluronate and polyacrylate are very different polyelectrolytes, a surprisingly similar phase behavior of mixtures with O/W microemulsion droplets is observed (phase diagrams of NaPA with larger droplets are given in
Figure S3 for comparison). In both cases, aggregates in the microemulsion charge excess part of the phase diagram are very unstable (precipitation or liquid−liquid phase separation takes place), while long-time stable samples are found at polyelectrolyte excess. It is interesting to note that the upper critical mixing ratio, z, for forming stable PEMECs is quite similar, ∼0.7, for NaPA and NaHA, which means that the colloidal stability here is largely governed by the relative charge ratio of surfactant and polyelectrolyte. For both polyelec-trolytes, the phase boundary between unstable and long-time stable samples does not depend much on the Mwvalue of the
polyelectrolyte, but for NaHA, the range of metastable phases within the unstable region is much smaller, i.e., the macroscopic phase separation occurs much faster here.
To further generalize our findings, we also employed NaCMC as polyelectrolyte, where the polymer structure and
stiffness are similar to those of NaHA, but the charge is attached to the backbone by aflexible spacer (seeFigure 1), and the charge density can easily be altered by the degree of substitution (DS). Here, the higher-Mw NaCMC250 has a
higher charge density with DS = 1.2, while DS = 0.7 for the shorter NaCMC90. When comparing their phase behavior (see
Figure 2, right), it is striking that the NaCMC phase diagram for the small droplets is somewhat different by showing a two-phase region more extended to higher z. But the more pronounced effect is seen on the droplet size when mixed with NaCMC (seeFigure S4). For samples prepared with NaCMC and medium-large droplets, the monophasic range is much smaller than that with the two other polyelectrolytes, and it almost vanishes for the largest droplets. As mentioned before, the NaCMC charge is not located directly on the PE backbone, but linked with a ratherflexible spacer. This spacer makes the charge more accessible for the ME droplets, so droplets can be bound more easily, which increases the strength of interaction, and the complexes then have an increased tendency for phase separation. Apparently, the accessibility of the charge via the flexibility provided by a spacer is very important here.
Interestingly, the nature of the two-phase region depends strongly on the type of PE. For NaPA, a solid powdery phase precipitates, while for NaHA and NaCMC, the second phase is a very viscous gel, i.e., a coacervate phase. Apparently, the extent of hydration in the complex is much higher for the polysaccharides, which is not surprising, given the large number of OH groups on their backbone, which enable stronger hydration. It should be noted that this behavior is quite similar to that observed for complexes of NaHA with TTAB, where a viscous second phase was observed, the difference just being that there the viscous phase precipitated to the bottom.36The difference in our case can be explained by the lower density of the microemulsion droplets.
Structural Characterization of ME/NaHA Complexes. Static and Dynamic Light Scattering (SLS/DLS). A first structural characterization of the stable single-phase samples at NaHA excess was done by static and dynamic light scattering. DLS measurements show an interesting feature different from the previously studied NaPA samples: Some of the NaHA samples show a bimodal decay (seeFigure S5). The tendency for a bimodal distribution function depends on the droplet size and the Mw value of NaHA. The smallest droplets most markedly show a bimodal distribution. For ME00, a bimodal relaxation is found for all mixing ratios and all Mw, except the
shortest NaHA51, which exhibits a monomodal relaxation. For the medium droplet size ME50, only samples with higher-Mw
NaHA show a bimodal decay, and only for higher mixing ratios. Finally, for the largest droplets ME75, a bimodal relaxation is no longer found and all measured samples show a simple decay of the correlation function (Figure S6). The slower relaxation mode in the bimodal distribution is nondiffusive (the relaxation rate, Γ, follows a power law of ∼q3; seeFigure S7) and also appears in samples of pure NaHA.
It can be attributed to the generally observed“slow mode” of polyelectrolytes, seen in particular at a low ionic strength,37 which has been attributed to the presence of supramolecular structures or hindered motions of interacting chains.38,39Such a slow mode with q3 scaling has been reported also for hyaluronate before.40 Because of the lower charge density, NaHA has to be employed in higher weight fractions than NaPA to achieve the same mixing ratios. NaHA also scatters light more strongly than NaPA due to higher Mw per unit
length, so it becomes visible in the measurements at higher concentrations. Even though NaHA is scattering more strongly, it is still a weak scatterer and can be easily concealed by more strongly scattering objects like larger microemulsion droplets. The faster mode observed in DLS belongs to the complexes formed by PE and ME droplets, which are of interest in this study, and thus, only this signal was further analyzed and the slower relaxation mode was neglected.
Both methods, SLS and DLS, show large aggregates close to the phase boundary, which are decreasing in size for larger charge ratios z. As expected, the higher Mw of the
polyelectrolytes and larger ME droplets lead to an increase in complex size. Thesefindings are very similar to the results previously found for ME/NaPA complexes,17 indicating a generic trend for such systems, independent of the nature of the polyelectrolyte. All light scattering results summarized in
Figure S8show hydrodynamic radii of 25−50 nm close to the phase boundary for the smallest droplets, which increase with the Mwof the NaHA. Interestingly, the largest values of almost
100 nm are found for medium-size ME droplets (R = 4.1 nm) and slightly smaller for the largest droplets (R = 6.6 nm), where the largest complexes of Rh∼ 80−100 nm are observed for Mwvalues of 360 and 800 kDa for NaHA.
The static scattering intensity shows a plateau over the whole q-range for most samples. Only some samples with high-MwNaHA and mixing ratios close to the phase boundary (z = 0.7) show an increase in intensity to lower q (seeFigure 3, left, andFigure S9). A plateau in the SLS data means that Rg·q ≪ 1, which would be valid for aggregates with Rg< 40 nm (with qmax
being 0.025 nm−1), in agreement with the DLS data (one should keep in mind here that for a cylinder of length L and radius R, it holds: Rg2= L2/12 + R2/2; accordingly, this is still
valid for cylinders of a length of up to 140 nm). The molecular weight of the complexes can be obtained from the intercept I(0) of the SLS data (obtained by a Guinier approximation); it shows that close to the phase boundary, values of several million Da are achieved (Table S2). By comparing the molecular weight of the mixed complexes to that of one single ME droplet without interactions (pure microemulsion measured with added salt to suppress interparticle inter-actions), and neglecting the weak scattering contribution of the polyelectrolyte, an aggregation number Nagg of droplets per
complex aggregate can be obtained. This shows that up to 40 droplets may be contained in one complex (Figure 3, right, and
Figure S8). The static light scattering results for all NaHA samples are summarized inTable S2. In general, the number of droplets contained in a complex increases with increasing Mw of the NaHA chain. However, it should be noted here that neglecting the scattering contribution of the NaHA leads to an upper estimate. Similarly, we are not claiming to find finite sized structures in the solution, but at the length scale probed here, we see structures that contain approximately the given numbers of ME droplets.
Viscosity. For additional information, the viscosities of a z-series of medium-sized microemulsion droplets (ME50) and NaHA186 were measured. The viscosity is very low at ME excess and increases strongly once the PE excess regime of the phase diagram is reached. This is simply due to the increased concentrations of NaHA in this regime, which already for the pure NaHA solution leads to a marked viscosity increase (see
Figure S10).Figure 4shows the viscosity ratios of ME/NaHA samples and pure NaHA solutions with the same NaHA concentration, for different charge ratios at PE excess. The viscosity ratios of NaPA and NaCMC samples of z = 0.7 are also plotted for comparison. As a first statement, it can be pointed out that the added microemulsion does not have a
Figure 3.Left: SLS intensity vs q shows a plateau for most samples (small droplets, R = 3.1 nm). Right: Aggregation numbers Nagg(number of droplets per complex) as obtained from static light scattering (small droplets, R = 3.1 nm). For data on bigger droplets, seeFigures S8 and S9. The last number of the sample name indicates the charge ratio z of the sample.
Figure 4.Viscosity ratios of pure polyelectrolytes and PEMECs for different charge ratios z for medium-sized microemulsion droplets (R = 4.3 nm).
strong impact on the viscosity of the polyelectrolyte solution. For NaHA186, the largest effect is obtained at z = 0.7, close to the phase boundary, where the microemulsion decreases the viscosity compared to the original PE viscosity by a factor of almost 2. This effect becomes much weaker for higher mixing ratios. The viscosity effect is markedly depending on Mwand is
about 2 for NaHA572, while it almost vanishes for NaHA31. For NaCMC250, a similar value to that for NaHA572 is observed, which may be partly attributed to the similar Mw, but
may also reflect a stronger attractive interaction due to the more accessible charges of NaCMC.
These results are interpreted by the rather weak electrostatic interactions of the microemulsion droplets with the poly-electrolytes, which is most likely due to the low charge density on the droplet surface. This should result in rather transient aggregates with a short structural relaxation time, thereby not affecting the viscosity significantly. The lower relative viscosity at low z can be explained such that the complexation is most pronounced here, which also leads to a condensation of NaHA chains and thereby to a relatively weaker polyelectrolyte network and correspondingly lowered viscosity. Close to the phase boundary, where large aggregates were observed by DLS and SLS, those weak interactions still have a compacting effect on the hyaluronate, the more so for longer chains (higher Mw). When the hyaluronate is bound in aggregates, the charges are screened, and the separate strands can slide next to each other without entanglement. At larger polyelectrolyte excess, the hydrodynamic radii obtained from DLS become smaller, actually approaching those of the free droplets (seeFigures 6
andS8). Together with the viscosity measurements, this can be interpreted as a continuous but transient polyelectrolyte network (no change in viscosity), which is decorated with separate ME droplets. Apparently, the transient nature of the interconnection by ME droplets results in a short structural relaxation time and the corresponding low viscosity. In general, it can be concluded that the addition of the ME droplets has a rather small effect on the viscosity of the NaHA network, as previously seen for the addition of pure cationic surfactant at surfactant excess conditions.41For a comparison, the viscosity effect on NaCMC is more strongly pronounced, confirming a stronger interaction (as seen before in the phase behavior) and a resulting more pronounced compaction of the aggregates.
Small-Angle Neutron Scattering (SANS) and Dynamic Light Scattering (DLS). Although light scattering is a useful
tool to determine the overall size of the formed complexes, it is not able to yield detailed information about the shape and internal structure of these complexes because of the limited q-range probed and the small size of the microemulsion droplets. For this reason, small-angle neutron scattering (SANS) was employed to characterize the different PEMEC systems with respect to their mesoscopic structure. This was done comprehensively for different Mw values of NaHA and for
different size microemulsion droplets, always as a function of the mixing ratio, z. Selected SANS data are shown inFigure 5. The full set of scattering curves is shown inFigure S12.
As previously observed for the polyacrylate PEMEC,17 the SANS measurements show that the droplets remain unchanged in shape and size when interacting with the hyaluronate. This is confirmed by the unchanged scattering curves at high q, especially the form factor minimum (seeFigure S13for zoom into the minimum). The complexing effect of the hyaluronate is seen at low q, where the interactions of the droplets are probed. All SANS data show an increase in intensity toward low q that continues up to q = 0.03 nm−1. Note that no plateau is visible in any of the SANS data of NaHA complexes. In comparison, NaPA samples with small Mw’s showed a plateau;
however, the shortest NaHA chains used in this work are still much longer than the shorter NaPA chains used previously.17 As the differences in the size of the formed complexes become clearer in static light scattering, where the observed q-range is at lower q values, the SLS data were scaled according to the contrast differences of SANS and SLS (for details of the calculation and refractive index increments, see SI F) and plotted with the SANS data inFigure 5for a complete picture. A plateau is observed for most samples in SLS. Unfortunately, the onset of the plateau seems to be exactly in the middle between the two observable length scales of SLS and SANS, and due to the experimental constraints, no overlapping data are available, but by combining these two methods, a good characterization of the PEMECs can still be achieved.
The slope of the intensity increase in the SANS data depends on the mixing ratio, z. As previously seen for NaPA, the slope is highest for samples close to the phase boundary (low z) and decreases with increasing polyelectrolyte excess, i.e., with increasing electrostatic screening. As an example, this is shown for the smallest microemulsion droplets (ME00, R = 3.1 nm) for the shortest (Mw = 51 kDa) NaHA inFigure 5
(left) (others are shown inFigure S12). The largest aggregates
Figure 5.Scattering curves of PEMECs with small microemulsion droplets (R = 3.1 nm). Left: different mixing ratios, z, on the polyelectrolyte-rich side of the phase diagram of NaHA51. Right: mixing ratio z = 0.70 with different Mw’s of NaHA. Filled symbols are SLS data, and empty symbols are SANS data; the scaling of the SLS data is described inSI F.
are formed close to the phase boundary (z∼ 0.6), and the q−2 slope suggests random walk assemblies of microemulsion droplets at this mixing ratio. At z = 0.7, the slope of the intensity is close to q−1, which indicates locally linear arrangements of the microemulsion droplets. At high polyelectrolyte excess (z = 0.9), only a small intensity increase is still visible. Figure 5 (right) compares the SANS data of complexes of small microemulsion droplets at the same mixing ratio (z = 0.7, where linear droplet arrangements were found) with different Mw’s NaHA. Here, only small deviations in the
q−1 slope are visible, becoming somewhat steeper with increasing Mw value of NaHA. The bigger the droplet, the
smaller is the visible difference between the NaHAs of different Mw’s (seeFigure S14for medium and large droplets). Due to
the lack of a plateau, no characteristic length of these linear complexes can be determined from SANS. Simulations of SANS curves based on homogeneous cylinders with different lengths show that the linear PEMEC arrangements extend over more than 100 nm (see Figure S15), but cannot be much larger than the values as seen by the plateau in the SLS data. It is interesting to note that the local arrangement of ME droplets in the PEMECs apparently is rather independent of the droplet size and the Mwof the NaHA and depends largely
on the mixing ratio. For larger ME droplets, the main difference in the SANS data is simply explained by the higher Mw values of these droplets. This result is different from previous measurements with NaPA, where we had found higher aggregation numbers for larger droplets.17
Knowing that the droplets are arranged in locally linear arrangements while retaining their original size and shape, we can now interpret the (fast) diffusion coefficients measured in DLS as the diffusion of cylinders with a diameter of one droplet. The length of one cylinder was calculated using the established expression for the diffusion coefficient by Ortega et al.42 (the radius was taken as that of the microemulsion droplets; more details are given inSI D).
D L k T p C L ( ) 1 3 (ln ) t B t 0 πη = + (2)
The values given inFigure 6show that this model predicts the presence of rods in the length range of 50−200 nm, in good agreement with the SANS data (and one should keep in mind that this still corresponds to a value of Rgsmaller than 50 nm).
Comparison of PEMECs Formed with Sodium Hyaluronate (NaHA), Sodium Carboxymethyl Cellulose
Figure 6.Diffusion coefficient, D, hydrodynamic radius, Rh, and lengths of cylinders, L, as deduced from DLS measurements for complexes formed by ME00 (small droplets, R = 3.1 nm), with NaHA of different Mw’s at different mixing ratios, z.
Figure 7.Left: SLS data of ME00 (small droplets, R = 3.1 nm) mixed with different polyelectrolytes at z = 0.7. Right: aggregation numbers, Nagg (droplets per complex), as obtained from SLS, as a function of the molecular weight Mw(including the Na+counterion). The dotted lines represent theoretical number of droplets per PE chain according to the number of charges.
(NaCMC), and Sodium Polyacrylate (NaPA). After having analyzed the structural information regarding PEMECs formed with NaHA of different Mw’s, it is now interesting to compare
their structural features with those seen previously for sodium polyacrylate (NaPA).17 This comparison is interesting since NaPA is a much moreflexible polyanion than NaHA with its polysaccharide backbone (intrinsic persistence lengths of 1.3 nm compared to 9 nm for NaHA).25,27 Accordingly, we can elucidate the effect of the polymer persistence length on the mesoscopic structure of the PEMECs. In addition, some experiments were performed with the sodium salt of carboxymethyl cellulose (NaCMC) to see how the location of the charge on the polysaccharide affects the complexation behavior, while the backbone and its stiffness (persistence length of 16 nm28) are quite similar to those of NaHA. For NaHA and NaPA, the charge is located close to the backbone, while for NaCMC, it is much more easily accessible, as it is connected to the backbone by a rather flexible spacer (see
Figure 1). The charge density of NaCMC depends on the degree of carboxylation, and the two NaCMCs used in this work differ not only in their molecular weight but also in their charge density. The longer NaCMC chain (NaCMC250) also has the higher charge density with 1.2 charges per monomer unit, while the shorter NaCMC90 has a degree of substitution (DS) of 0.7.
Static light scattering was measured for all samples to determine the molecular weight and the aggregation number (Figure 7). The SLS data show the same trend for all polyelectrolytes: the aggregation numbers at a constant charge ratio, z, increase with increasing Mw of the PE. NaPA/ME
complexes have a higher aggregation number than NaHA complexes at a given Mwof PE, but the aggregation number is
highest for NaCMC complexes. In general, Naggis smaller than
that calculated theoretically with the assumption of having one polymer chain complexed stoichiometrically with ME droplets according to the number of charges (given as dotted lines in
Figure 7, right). Here, it should be noted that the droplets have a rather low charge density, as the average spacing between the charges on the droplet surface is∼3.5 nm, while that of NaHA is∼1 nm, i.e., a 3.5 times higher value. Under these conditions, it is not possible to fully compensate all PE charges, leading to smaller aggregation numbers. Because of this, the complexes will build up a negative net charge, which is the driving force for their locally elongated form, and which also prevents the complexes from growing very large. This effect is more pronounced with increasing Mwof the polyelectrolyte, because
at the given conditions, the PE concentration is typically above the overlap concentration, which means that the formation of complexes with only one PE chain is unlikely. In addition, only an effective domain size of the structures is visible in light scattering, making it more difficult to give exact aggregation numbers.
The SANS measurements are able to give more information about the shape and composition of the mixed complexes. At first glance, the complexes formed with microemulsion droplets and NaHA, NaCMC, or NaPA look rather similar in SANS. We observe large mixed complexes close to the phase boundary that decrease in size with increasing polyelectrolyte excess (Figures S12 and S17).Figure 8shows the SANS data for samples of small microemulsion droplets (ME00, R = 3.1 nm) with different polyelectrolytes at a constant charge ratio of z = 0.7 (polyelectrolyte excess, close to the phase boundary for NaPA and NaCMC, not so close for NaHA). All of these
complexes show a slope between q−1and q−1.5in the neutron scattering data, which corresponds to elongated structures. The Mw values of the polyelectrolytes were chosen so that the stretched chains (contour lengths) are similar in lengths
(NaPA60∼ 160 nm, NaHA51 ∼ 130 nm, NaCMC90 ∼ 200
nm). However, it should be noted here that being mixed at the same charge ratio implies that the weight fraction of NaHA (NaCMC90/NaCMC250) is about 4 (3/2) times higher than that of NaPA, due to the lower charge density per mass of NaHA (NaCMC). InFigure S16, the same comparison is done for medium-sized droplets (ME50, R = 4.1 nm), and the scattering curves look very similar. Figure S17 shows more SANS data of NaCMC complexes, which resemble those of the NaHA in their general behavior.
The direct comparison for a constant mixing ratio of z = 0.7 shows that the slope for the NaPA samples is generally higher than those for the NaHA or NaCMC ones. While the slopes of the more rigid polysaccharides are very close to a q−1power law, the slope of the flexible NaPA is ∼q−1.5. This can be attributed to the different stiffnesses of the polyelectrolytes; NaHA and NaCMC are quite rigid due to their backbones being composed of disaccharide units, while NaPA is rather flexible. The stiffer NaHA and NaCMC are more likely to arrange the droplets in a straight cylindrical geometry leading to a q−1dependence, while the less rigid NaPA forms curved chains of droplets, i.e., assumes the conformation of a semiflexible polymer. Consequently, the low-q region exhibits a higher slope (q−1.5). The two limits generally known to describe SANS data of similar polymeric structures quantita-tively are long straight cylinders with a slope of q−1orflexible Gaussian coils with a slope of q−2.43 We can therefore qualitatively conclude that the two polysaccharides employed here form long aggregates with essentially linear arrangements of separate droplets, when interacting with oppositely charged microemulsion droplets. In contrast, the formed aggregates of theflexible NaPA show a semiflexible behavior.
The comparison of the SANS data of NaPA and NaHA samples at z = 0.9 (data shown inFigure S18), i.e., at very high PE excess, points out another difference. At this high PE excess, the NaPA samples resemble those of single micro-emulsion droplets without interactions. Apparently, the PE excess at this charge ratio is high enough to stabilize each
Figure 8.Comparison of SANS data for small (ME00, R = 3.1 nm) microemulsion droplets mixed with NaHA (Mw = 51 kDa), NaPA (Mw= 60 kDa), and NaCMC (Mw= 90 kDa) of comparable length, at z = 0.7, close to the phase boundary.
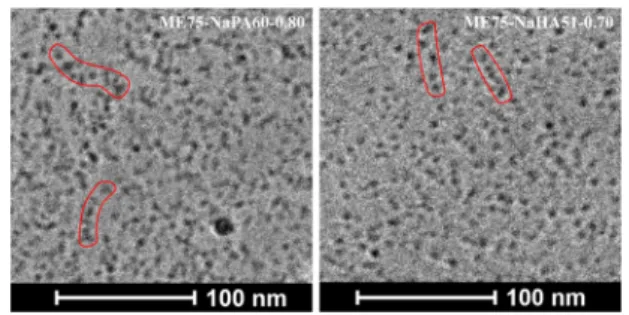
While both images show dense packings of droplets that are hard to separate into single aggregates, those images also do not contradict the findings obtained by SANS, which is an important observation. In both images, we can find linear arrangements of droplets. For the NaPA sample, the strands of droplets look more branched and bend than for the NaHA sample, where more extended strings of ME droplets are visible (see indications in red inFigure 9). To be able to interpret the results of two fundamentally different methods in the same way increases the chances that this interpretation represents the real situation substantially.
Further Analysis of the Scattering Data. Further information regarding the SANS data can be obtained by plotting and analyzing the data in the so-called “Holtzer
lengths correspond almost exactly to the respective droplet diameters, which indicates that dimers of droplets are rather loosely joined. Samples with NaHA at this mixing ratio do not follow the classical Holtzer plot behavior for aflexible chain, so no persistence length can be obtained here. Instead, for the NaHA and NaCMC complexes, one observes the behavior of a stiff rod, and obviously, the persistence length is larger than the experimental observation window of 100 nm. This confirms the previously made assumption that here the ME droplets arrange to straight cylindrical aggregates of a substantial length. The Holtzer plots for NaHA samples closer to the phase boundary (z = 0.6 and 0.65) and at high PE excess are shown inFigure S19A,B.
Another way of comparing the complexes formed by ME droplets with different polyelectrolytes is by fitting the slope, A, of the linear part of the SANS data at small q with I(q) = q−A+ B, where A corresponds to the fractal dimension of the formed complexes. Here, a value of A = 1 corresponds to straight cylinders, whereas higher values indicate more bend cylinders. The limit of this model would be a Gaussian coil with A = 2.49 Thefitted exponents for z = 0.7 samples are plotted inFigure 11 and show a logarithmic trend with the Mw value of the
polyelectrolyte for all systems. The A value of NaPA samples is generally higher than that of NaHA samples at a given mixing ratio, confirming again that much more flexible aggregates are formed by the flexible polyelectrolyte, while a stiff polyelec-trolyte arranges the ME droplets in straight rods. In addition, the slope increases systematically with increasing size of the microemulsion droplets. The NaHA samples closer to the
Figure 9.Comparison of cryo-TEM micrographs of large ME droplets (ME75, R = 6.6 nm) mixed with NaPA (left) and NaHA (right) at z-values in PE excess, close to the phase boundary (z = 0.7 for NaHA and 0.8 for NaPA, because a z = 0.7 sample was not stable with large droplets).
Figure 10.Holtzer plots of SANS data of NaHA, NaPA, and NaCMC mixed with small (left) and medium (right)-sized microemulsion droplets. A charge ratio of z = 0.7 was not stable for ME50-NaCMC90 samples.
phase boundary (z = 0.6−0.65) showed slopes between 1.6 and 1.1, but no direct comparison to NaPA can be drawn here because NaPA samples were not stable at these mixing ratios. More analytical description of the scattering data was also made. As afirst step, the data were described with a model of homogeneous cylinders, before a more sophisticated model of linearly arranged spheres50 was attempted. However, both models showed substantial shortcomings in properly describ-ing the scatterdescrib-ing data (see SI F). Due to the lack of an appropriate model to describe SANS data of curved droplet chains, a Monte Carlo model was developed by us for this purpose (a comparison of thefit quality of the different models is given inFigure S20, showing the significant improvement by the new model). The model describes chains of N homogeneous spheres of average radius R, which are separated by an average distance d between the sphere surfaces. Both R and d are polydisperse and randomly picked from normal
distributions with standard deviations (σ) corresponding to the polydispersity parameters. The chains assume the random conformations of semiflexible polymers of a given persistence length. In practice, this was achieved by sampling random conformations while penalizing high angles between the vectors between each sphere and its two neighbors with a harmonic constraint potential of adjustable strength V0. In this procedure, nonphysical conformations with overlapping spheres were excluded. To obtain the scattering curves given in Figure 12, at least 5000 conformations were randomly generated in this way. The scattering intensities were then computed by calculating the form factor amplitudes of each sphere, subsequent phase-correct summation based on each set of sphere coordinates using the Debye formula,51 and averaging over all conformations. The persistence length lp
was calculated a posteriori from the ensemble-averaged ratio between contour length LCand end-to-end distance h, where
⟨h2⟩ = 2L
Clp− 2lp2(1− e−LC/lp)
52
(for more details, seeSI F). With this model at hand, it was possible to quantitatively describe the full set of SANS data of samples with z = 0.7 for different polyelectrolytes (Figure 12). To this end, all microemulsion droplet parameters (R, polydispersity in R, volume fraction, contrast) were kept constant for all samples. Parameters that depend on the type of polyelectrolyte (d, polydispersity in d, V0) were used as global model parameters for all samples with the same PE type. So, the only parameter changing with the Mw of PE is the number of droplets per
aggregate N.
The results show that all data of samples close to the phase boundary (where elongated complexes are found) can be described accurately with the new model of cylindrically arranged droplets with a persistence length of the aggregate that depends on the type of polyelectrolyte. The obtained persistence lengths are lp(NaPA)∼ 17 nm and lp(NaHA)∼ 51 nm, confirming and quantifying the assumptions stated above. Furthermore, the distances between droplet surfaces depend on the type of polyelectrolyte, being ∼2 nm for NaPA and
Figure 11.Fitted slope low q SANS data of PEMECs at z = 0.7. The slope shows a logarithmic dependency on the Mwof polyelectrolyte for all, NaHA, NaCMC, and NaPA, samples.
Figure 12.Modeled SANS data of NaPA (left) and NaHA (right) samples at z = 0.7. The persistence length, lp, was calculated afterwards from the modeled end-to-end distance and contour length. The angular potential was kept constant for all samples with the same type of PE, resulting in very similar lps. The insets show examples of simulated complexes for the longest chain lengths. More simulations are shown inFigure S21.
■
CONCLUSIONSIn summary, we studied the structure of polyelectrolyte/ microemulsion complexes (PEMECs) of positively charged microemulsion droplets with different negatively charged polyelectrolytes. Three very different PEs were employed: The biopolymer sodium hyaluronate (NaHA) was the main focus of this study, and sodium polyacrylate (NaPA) and the sodium salt of carboxymethyl cellulose (NaCMC) were studied for a systematic comparison. While the molecular architectures of NaHA and NaCMC and also their persistence lengths in aqueous solution are rather similar, the two PEs exhibit very different phase behaviors when interacting with microemulsion droplets. For NaCMC with its more flexibly attached charge, the strength of the interaction with the oppositely charged microemulsion droplets is much larger, and therefore, a phase separation takes place much more easily, and also the viscosity reduction is more marked. In contrast, NaHA
compensate the excess charge of the PE. In addition, their surface becomes less curved, which should also make it easier for the PE charges to interact with them.
The structural behavior of stable PEMECs for polyelec-trolyte excess is similar for all studied PEs. All systems locally form large elongated structures at PE excess close to the phase boundary, which decrease in size when the PE excess is increased, due to the increased local charging in the complexes. The elongated complexes are formed by separate micro-emulsion droplets arranged in cylindrical geometries. The ME droplets retain their size and shape when interacting with the polyelectrolytes. The number of droplets per complex depends mainly on the Mw value of the employed polyelectrolyte; it
increases proportionally to the latter. The structure of the complexes was studied in detail by small-angle neutron scattering (SANS). It was found that, although though the scattering data of the formed complexes look very similar at first glance, the exact morphology depends strongly on the backbone of the employed polyelectrolyte. For a quantitative analysis, a stochastic model was developed that describes such cylindrically arranged droplets with different persistence lengths of the complexes accurately. The more flexible polyelectrolyte NaPA also forms much moreflexible elongated complexes, where the persistence length corresponds to the size of about two microemulsion droplets. Contrarily, stiffer polyelectrolytes like NaHA or NaCMC form much more rigid rodlike aggregates of ∼50 nm persistence length when interacting with the microemulsion droplets, as shown in
Figure 13. The effectively observed length of these cylindrical
0.70 ME50-NaHA360-0.70 4.0 (0.6) 5.5 (3) 13 3.0 162 50 ME50-NaHA800-0.70 4.0 (0.6) 5.5 (3) 15 3.0 190 50
aR was kept constant for all ME50 samples. d and V
0 were used as globalfit parameters for each PE type. LCand lpwere calculated from the modeled conformations. Minor variations in lpforfixed V0reflect the influence of the nonoverlap requirement and the stochastic nature of the model.
Figure 13.Complexes formed by microemulsion droplets withflexible polyelectrolytes (such as NaPA) form flexible droplets chains, approaching random coil-like conformations. In contrast, complexes formed with more rigid polyelectrolytes (such as NaHA and NaCMC) form long linear arrays of droplets.
aggregates then was 100−200 nm, while NaPA on this length scale forms structures similar to Gaussian coils. It should also be noted that these aggregates/complexes are not just containing one polyelectrolyte chain, and especially for longer chains (higher Mw), they will be interconnected by such chains, thereby forming a transient network, as depicted inFigure 13. To conclude, it was found that PEMECs can be formed generically with quite different types of polyelectrolytes, and large complexes are formed at polyelectrolyte excess in the vicinity of the phase boundary. The local structure of the complexes is largely controlled by the stiffness of the polyelectrolyte, where quite flexible complexes with short cylindrical units are formed by the flexible PE NaPA, while much stiffer cylindrical arrangements are present for polysaccharide-based PEs like NaHA. The main finding of our work therefore is that the persistence length of the PE becomes translated and amplified into the persistence length of the PEMEC aggregates in a manner similar to that seen before for complexes of lysozyme and hyaluronan.25 In this manner, PEMECs with tailor-made structures can be designed, to combine the high loading capacity of a microemulsion with the superstructure arising from the polyelectrolyte.
■
ASSOCIATED CONTENT*
sı Supporting InformationThe Supporting Information is available free of charge at
https://pubs.acs.org/doi/10.1021/acs.macromol.0c00236. Sample compositions, phase behavior, light scattering data, determination of diffusion coefficient of rods, viscosities, description of SANS models, additional SANS data, and list of abbreviations (PDF)
■
AUTHOR INFORMATIONCorresponding Authors
Miriam Simon − Stranski-Laboratorium für Physikalische und Theoretische Chemie, Institut für Chemie, Technische
Universität Berlin, 10623 Berlin, Germany; orcid.org/0000-0003-3065-6230; Email:miriam.simon@tu-berlin.de
Michael Gradzielski − Stranski-Laboratorium für Physikalische und Theoretische Chemie, Institut für Chemie, Technische Universität Berlin, 10623 Berlin, Germany; orcid.org/0000-0002-7262-7115; Email:michael.gradzielski@tu-berlin.de
Authors
Emanuel Schneck − Physics Department, Technische Universität Darmstadt, 64289 Darmstadt, Germany;
orcid.org/0000-0001-9769-2194
Laurence Noirez − Laboratoire Léon Brillouin (CEA-CNRS), University of Paris-Saclay, 91191 Gif-sur-Yvette, France Sofia Rahn − Stranski-Laboratorium für Physikalische und
Theoretische Chemie, Institut für Chemie, Technische Universität Berlin, 10623 Berlin, Germany
Irina Davidovich − Department of Chemical Engineering and the Russell Berrie Nanotechnology Institute (RBNI),
TechnionIsrael Institute of Technology, Haifa 3200003, Israel
Yeshayahu Talmon − Department of Chemical Engineering and the Russell Berrie Nanotechnology Institute (RBNI),
TechnionIsrael Institute of Technology, Haifa 3200003, Israel
Complete contact information is available at:
https://pubs.acs.org/10.1021/acs.macromol.0c00236
Notes
The authors declare no competingfinancial interest.
■
ACKNOWLEDGMENTSThe authors thank the Laboratoire Léon Brillouin (LLB) and the Institut Laue-Langevin (ILL) for allocated beamtimes. They also thank Sylvain Prévost for his support during the SANS beamtime at ILL and Sebastian Bayer for providing DLS measurements of the pure NaHA. The cryo-TEM was performed at the Technion Center for Electron Microscopy of Soft Materials, supported by the Technion Russell Berrie Nanotechnology Institute (RBNI). M.S. thanks TU Berlin for funding her Ph.D. project. E.S. thanks Ana Celia Vila Verde for fruitful discussions.
■
REFERENCES(1) Winsor, P. A. Hydrotropy, solubilisation and related emulsification processes. Trans. Faraday Soc. 1948, 44, 376−398.
(2) Kahlweit, M.; Strey, R. Phase Behavior of Ternary Systems of the Type H2O-Oil-Nonionic Amphiphile (Microemulsions). Angew. Chem., Int. Ed. 1985, 24, 654−668.
(3) Gradzielski, M.; Hoffmann, H.; Langevin, D. Solubilization of Decane into the Ternary System TDMAO/1-Hexanol/Water. J. Phys. Chem. A. 1995, 99, 12612−12623.
(4) Gradzielski, M. Effect of the cosurfactant structure on the bending elasticity in non-ionic oil-in-water microemulsions. Langmuir 1998, 14, 6037−6044.
(5) Lawrence, M. J.; Rees, G. D. Microemulsion-based media as novel drug delivery systems. Adv. Drug Delivery Rev. 2012, 64, 175− 193.
(6) Boonme, P. Applications of microemulsions in cosmetics. J. Cosmet. Dermatol. 2007, 6, 223−228.
(7) Solans, C.; García Dominguez, J.; Friberg, S. E. Evaluation of Textile Detergent Efficiency of Microemulsions in Systems of Water Nonionic Surfactant and Hydrocarbon at Low Temperature. J. Dispersion Sci. Technol. 1985, 6, 523−537.
(8) Magno, M.; Tessendorf, R.; Medronho, B.; Miguel, M. G.; Stubenrauch, C. Gelled polymerizable microemulsions. Part 3 rheology. Soft Matter 2009, 5, 4763−4772.
(9) Burghardt, W. R.; Krishan, K.; Bates, F. S.; Lodge, T. P. Linear viscoelasticity of a polymeric bicontinuous microemulsion. Macro-molecules 2002, 35, 4210−4215.
(10) Malo de Molina, P.; Herfurth, C.; Laschewsky, A.; Gradzielski, M. Structure and dynamics of networks in mixtures of hydrophobi-cally modified telechelic multiarm polymers and oil in water microemulsions. Langmuir 2012, 28, 15994−16006.
(11) Gradzielski, M.; Hoffmann, I. Polyelectrolyte-surfactant complexes (PESCs) composed of oppositely charged components. Curr. Opin. Colloid Interface Sci. 2018, 35, 124−141.
(12) Hoffmann, I.; Heunemann, P.; Prévost, S.; Schweins, R.; Wagner, N. J.; Gradzielski, M. Self-aggregation of mixtures of oppositely charged polyelectrolytes and surfactants studied by rheology, dynamic light scattering and small-angle neutron scattering. Langmuir 2011, 27, 4386−4396.
(13) Bronich, T. K.; Nehls, A.; Eisenberg, A.; Kabanov, V. A.; Kabanov, A. V. Novel drug delivery systems based on the complexes of block ionomers and surfactants of opposite charge. Colloids Surf., B 1999, 16, 243−251.
(14) Oh, K. T.; Bronich, T. K.; Bromberg, L.; Hatton, T. A.; Kabanov, A. V. Block ionomer complexes as prospective nano-containers for drug delivery. J. Controlled Release 2006, 115, 9−17.
(15) Tam, K. C.; Wyn-Jones, E. Insights on polymer surfactant complex structures during the binding of surfactants to polymers as measured by equilibrium and structural techniques. Chem. Soc. Rev. 2006, 35, 693−709.
1477−1494.
(21) Mitsou, E.; Tavantzis, G.; Sotiroudis, G.; Ladikos, D.; Xenakis, A.; Papadimitriou, V. Food grade water-in-oil microemulsions as replacement of oil phase to help process and stabilization of whipped cream. Colloids Surf., A 2016, 510, 69−76.
(22) Chatzidaki, M. D.; Mitsou, E.; Yaghmur, A.; Xenakis, A.; Papadimitriou, V. Formulation and characterization of food-grade microemulsions as carriers of natural phenolic antioxidants. Colloids Surf., A 2015, 483, 130−136.
(23) Chiappisi, L.; Simon, M.; Gradzielski, M. Toward Bioderived Intelligent Nanocarriers for Controlled Pollutant Recovery and pH-Sensitive Binding. ACS Appl. Mater. Interfaces 2015, 7, 6139−6145.
(24) Gorski, N.; Gradzielski, M.; Hoffmann, H. The Influence of Ionic Charges on the Structural and Dynamical Behavior of O/W Microemulsion Droplets. Ber. Bunsenges. Phys. Chem. 1996, 100, 1109−1117.
(25) Morfin, I.; Buhler, E.; Cousin, F.; Grillo, I.; Boué, F. Rodlike complexes of a polyelectrolyte (hyaluronan) and a protein (lysozyme) observed by SANS. Biomacromolecules 2011, 12, 859−870.
(26) Oelschlaeger, C.; Cota Pinto Coelho, M.; Willenbacher, N. Chain Flexibility and Dynamics of Polysaccharide Hyaluronan in Entangled Solutions: A High Frequency Rheology and Diffusing Wave Spectroscopy Study. Biomacromolecules 2013, 14, 3689−3696.
(27) Dong, J.; Ozaki, Y.; Nakashima, K. FTIR studies of conformational energies of poly (acrylic acid) in cast films. J. Polym. Sci., Part B: Polym. Phys. 1997, 35, 507−515.
(28) Hoogendam, C. W.; de Keizer, A.; Cohen Stuart, M. A.; Bijsterbosch, B. H.; Smit, J. A. M.; van Dijk, J. A. P. P.; van der Horst, P. M.; Batelaan, J. G. Macromolecules 1998, 31, 6297.
(29) Itakura, M.; Shimada, K.; Matsuyama, S.; Saito, T.; Kinugasa, S. A convenient method to determine the Rayleigh ratio with uniform polystyrene oligomers. J. Appl. Polym. Sci. 2006, 99, 1953−1959.
(30) Keiderling, U. The new‘BerSANS-PC’ software for reduction and treatment of small angle neutron scattering data. Appl. Phys. A: Mater. Sci. Process. 2002, 74, 1455−1457.
(31) Chen, S.-H.; Lin, T.-L. Colloidal Solutions. Methods Exp. Phys. 1987, 23, 489−543.
(32) Richard, D.; Ferrand, M.; Kearley, G. J. Analysis and visualisation of neutron-scattering data. J. Neutron Res. 1996, 4, 33− 39.
(33) Breßler, I.; Kohlbrecher, J.; Thünemann, A. SASfit: a tool for small-angle scattering data analysis using a library of analytical expressions. J. Appl. Crystallogr. 2015, 48, 1587−1598.
(34) Talmon, Y. The study of nanostructured liquids by cryogenic-temperature electron microscopy - A status report. J. Mol. Liq. 2015, 210, 2−8.
(35) Danev, R.; Baumeister, W. Expanding the boundaries of cryo-EM with phase plates. Curr. Opin. Struct. Biol. 2017, 46, 87−94.
(36) Thalberg, K.; Lindman, B.; Karlström, G. Phase Diagram of a System of Cationic Surfactant and Anionic Polyelectrolyte: Tetradecyltrlmethylammonium Bromide-Hyaluronan-Water. J. Phys. Chem. B. 1990, 94, 4290−4295.
rodlike and disklike particles in dilute solution. J. Chem. Phys. 2003, 119, 9914−9919.
(43) Hammouda, B. Probing Nanoscale Structure - The SANS Toolbox 2016.
(44) Maleki, A.; Kjoniksen, A.-L.; Nyström, B. Anomalous Viscosity Behavior in Aqueous Solutions of Hyaluronic Acid. Polym. Bull. 2007, 59, 217−226.
(45) Von Lospichl, B.; Hemmati-Sadeghi, S.; Dey, P.; Dehne, T.; Haag, R.; Sittinger, M.; Ringe, J.; Gradzielski, M. Injectable hydrogels for treatment of osteoarthritis - A rheological study. Colloids Surf., B 2017, 159, 477−483.
(46) Banc, A.; Genix, A. C.; Chirat, M.; Dupas, C.; Caillol, S.; Sztucki, M.; Oberdisse, J. Tuning structure and rheology of silica− latex nanocomposites with the molecular weight of matrix chains: a coupled SAXS−TEM−simulation approach. Macromolecules 2014, 47, 3219−3230.
(47) Holtzer, A. Interpretation of the Angular Distribution of the Light Scattered by a Polydisperse System of Rods. J. Polym. Sci. 1955, 17, 432−434.
(48) Magid, L. J. The Surfactant-Polyelectrolyte Analogy. J. Phys. Chem. B 1998, 102, 4064−4074.
(49) Dreiss, C. A. Wormlike micelles: where do we stand? Recent developments, linear rheology and scattering techniques. Soft Matter 2007, 3, 956−970.
(50) Chiappisi, L.; Prévost, S.; Gradzielski, M. Scattering form factor of N linearly aligned particles forming a cylindrical superstructure. J. Appl. Crystallogr. 2014, 47, 827−834.
(51) Warren, B. E. X-ray Diffraction. Courier Corporation, 1990. (52) Hiemenz, P. C.; Lodge, T. P.Polymer Chemistry. CRC Press, 2007.