HAL Id: hal-00449575
https://hal.archives-ouvertes.fr/hal-00449575
Preprint submitted on 22 Jan 2010
HAL is a multi-disciplinary open access
archive for the deposit and dissemination of
sci-entific research documents, whether they are
pub-lished or not. The documents may come from
teaching and research institutions in France or
abroad, or from public or private research centers.
L’archive ouverte pluridisciplinaire HAL, est
destinée au dépôt et à la diffusion de documents
scientifiques de niveau recherche, publiés ou non,
émanant des établissements d’enseignement et de
recherche français ou étrangers, des laboratoires
publics ou privés.
A new analysis of access to healthcare reveals disparities
in a cross-border population of the southern european
alps
Sandra Perez, Fabrice Decoupigny
To cite this version:
Sandra Perez, Fabrice Decoupigny. A new analysis of access to healthcare reveals disparities in a
cross-border population of the southern european alps . 2009. �hal-00449575�
A NEW ANALYSIS OF ACCESS TO HEALTHCARE
REVEALS
DISPARITIES
IN
A
CROSS-BORDER
POPULATION OF THE SOUTHERN EUROPEAN ALPS
1Fabrice DECOUPIGNY
Department of Geography, University of Nice, France decoupig@unice.fr
Sandra PEREZ
Department of Geography, University of Nice, France perez@unice.fr
Access to care in modern societies is actually considered as a right to which every citizen is entitled. It has been subject to studies on medical demography and, less often analyses that can be used actually to assess this accessibility. The authors quantify accessibility to healthcare using a model derived from graph theory. Accessibility to healthcare is multifactorial and the factors on which it depends are related to the density of the health offer, to its spatial distribution, time of access to care services, income and patient information. The authors do not address these aspects, but focus instead on the first three portions which are purely geographical. The results reveal disparities of access to healthcare are very complex in the studied area because they are not only due to a border context but also to a population gradient between the littoral and the back country.
Key words: Accessibility to healthcare; Modeling; Graph Theory; Spatial inequalities; Equity.
1
1. INTRODUCTION
The concept of accessibility is used in several scientific disciplines ranging from sociology to medicine, but with different meanings and different methods of analysis. In geography, the accessibility of a location is generally defined as "the ease or difficulty with which a location can be reached from one or several other locations, by one or more individuals likely to move with all or part of system of transport" (Huriot and Pecqueur 1997).
Thus, accessibility involves not only the possibility of reaching a given place, but also the difficulty most often related to the spatial constraints. Generally, the determinants of accessibility are the locations of places of origin and destination, and the characteristics of the road network (type of road, speed, sinuosity, network connectivity, density ...). If the accessibility of a place can be studied by analyzing the distance between the place of another in geographic space, the “distance time” should be preferred and not only the “Euclidean” distance, because geographical areas are clearly composed of elements that could create spatial discontinuities as a result of their different features.
Accessibility as a social and health indicator is a condition of access to care but does not alone determine the effective use of care. Accessibility also relates to the financial costs of recourse to health services (social insurance) and to medical innovation. However, accessibility remains a prime objective of any equitable healthcare and accessibility is widely seen as a determinant of health, or a possible risk factor.
WHO defines health as a “state of complete physical wellbeing, mental and social, and does not consist only of one absence of disease or infirmity”2. (Lucas-Gabrielli, Nabet, and Wet Cooper 2001) have shown that use of health services is weaker as the population is more distant from them. Access to healthcare has become for a few years a major requirement of European citizens. However, in a border context like that of Southern Alps (Map 2, The border space of Southern Alps) this access to the healthcare may be unequal.
This cross-border region also spans different political systems. The Italian health system is based on the principle that: the offer controls the request. This can increase the geographical distance of the services, and lead to long waiting lists. One consequence can be “escape” towards France for
2
urgent cases. In France, the principle of organization of the medical system is reversed: the request controls the offer and access to the healthcare for the French population is generally more equal. However, disparities at the level of spatial organization persist in France. For example, the North of France is generally less well equipped than south, and they are also disparities between urban and rural zones, the littoral and its back-country, and rich and poor districts within the same urban unit. The Department of the Alpes-Maritimes is characterized by a high density of doctors, but the situation is actually more moderate at a local scale, and particularly at the level of the back-country. Indeed, population densities (Map 3, Densities of population in Southern Alps) vary according to a gradient: from the littoral where they are strongest, passing by the middle country, to reach the back country where they are weakest. The situation is similar between the littoral of Imperia Province and its back-country, eg. in the Cuneo province, where population densities are well differentiated between mountain municipalities (the comunita montane ) and those of plain.
We set out in this paper to quantify the accessibility of healthcare in these regions using a model based on graph theory our approach is innovative because we have used graph theory to quantify access to care.
MAP 1 General location map MAP 2 The border space of Southern Alps (municipality level)
MAP 3 Densities of population in Southern Alps
2. METHODOLOGY, THE MOVEMENT SIMULATION MODEL “FRED” (Decoupigny, “FRED 1998-2008 software”)
The graphical gravity model is one of the most commonly used models in studies of accessibility. The model is statistical and it enables simulation of interactions between locations to determine the probability of movement between them. Lucas and al present methods for evaluating access to care: measures such as the attractiveness of locations derived from Newton's law, theoretical attractiveness of areas measured using Thiessen polygons (Euclidean distance) and areas computing by the law of Reilly. Gravity modeling is used to determine the intensity of a relationship between geographical units, taking into account their potential (population), and their distance. The spatial interactions between the origin and destination depend on their strength of attraction and the possibility of communication. Based on the Newton’s law of universal gravitation:
Fij=k —
Mi * popj
where F is the rate of used service i by the inhabitants of the town j, M represents the mass function (number of services), pop is the size of the municipality of origin j, and d is the distance between the locations i j. The attractiveness of a place is directly proportional to the mass Mi and inversely proportional to the distance between the location of origin and the place of destination (Dij). This model was used in its following form by Reilly (1929) to determine the catchment areas of businesses:
Iij
= G x M
ix M
jD² ij
The rules of the model are that consumers visit an establishment more often if they are closer, and their demand weakens as they move away from it. The attraction of a place is proportional to its size, and inversely proportional to the square of the distance of the consumer. Thus, interactions between two places will be more important when their weight is high and the distance between them is small, and the attraction and use of services decreases with distance. Given the “distance-time” and the “mass” of each node of the network, we determined the number of people who have access to care in a given time-frame and secondly, we calculated the potential population of each destination municipality. These calculations were used to determine which places were most frequented by the public, and therefore more accessible and attractive. Flows represent the population of the town of origin. The model thus calculates the probability of moving based on accessibility in distance-time regardless of the neighbourhood (the neighbourhood attractions are neutral).The attraction is a function of travel time calculated as the shortest path between the destination and all other locations. Based on the model of Reilly, we calculated the potential for each municipality, which is the theoretical attractiveness of the destination. These calculations determine access to care. Accessibility is represented by isochrons curves (distance-time between users of care services). Several analyses have shown that accessibility to the healthcare increases with the size of the city and decreases with distance to this one (Reilly 1931).
Detailed description of the calculation procedure
From a geographical map we created a graph network with two files, the file Nodes and the file Arcs. This produced a file describing the features and characteristics of the different peaks that constitute the graph.
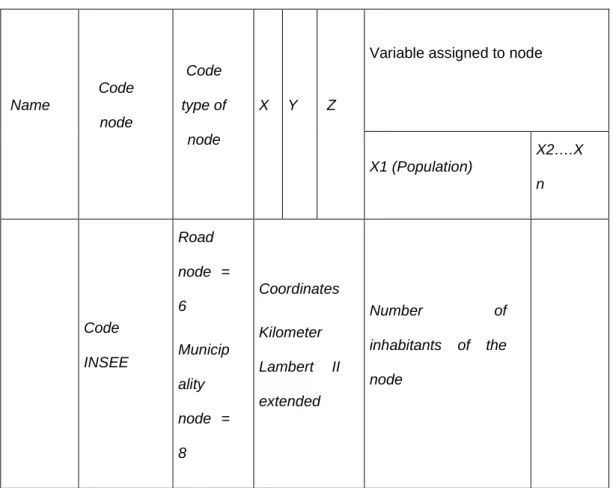
TABLE 1 Structure of file nodes
Variable assigned to node
Name Code node Code type of node X Y Z X1 (Population) X2….X n Code INSEE Road node = 6 Municip ality node = 8 Coordinates Kilometer Lambert II extended Number of inhabitants of the node
INSEE: The French Statistics Institute
TABLE 2 Structure of file arcs
Code origin node Code destination node Distance Kilometer Average speed of the road
416 477 2.5 50
477 416 2.5 50
To calculate accessibility and take into account the roads between different nodes, it is necessary to know the travel time. We assume that the roads of travel are predefined by a choice of the shortest path. Calculation of minimal paths was carried out using the Floyd’s algorithm (Floyd 1962).The calculations of optimal roads enabled us to create files associated with the network graph. They represent the information on the minimal paths recorded for a given graph. They are in two forms:
1- An origin-destination file, where paths are shortest (minimal paths) from all nodes to all nodes, this gives, for any pair of nodes, the distance or minimum travel time to reach one node from another.
2- A circuit file, from a matrix which gives the successive nodes of minimal paths for all pairs of nodes of the origin-destination file.
Calculation of minimal paths
The calculation was carried out two steps, firstly we calculated a matrix of minimum arcs, then, secondly we compared the different arcs to get the shortest distance time between two nodes.
For each node i = 1, 2, ..., n For each node j = 1, 2, ..., n
If i = j
l(i, j)
←
0,Otherwise
If the arc between i and j does exist
l(i, j)
←
arc length (i, j)Otherwise
l(i, j)
←
+∞
Next node j Next node i
Algorithm 1: Statement of the formal calculation of the matrix of minimum arc - Floyd’s algorithm
Several algorithms can be use to calculate all the minimal paths between all vertices of the graph3
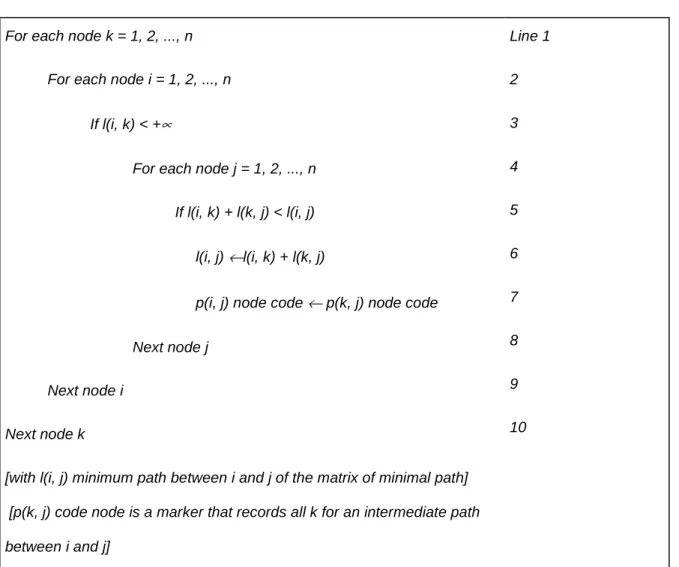
We used the algorithm of Floyd because "it applies regardless of length (even zero) and the density of the graph" (Floyd, 1962). Once the minimal arcs matrix is created, a search for the minimal paths can be done. The calculation is to determine k intermediate vertices connecting two nodes i and j taking into account the orientation of arcs. For each pair of vertices (i, j), the Floyd algorithm tries to find a path shorter than the path (i, j) for all k = (1, 2, ..., n), through that k (node between i and j). If this condition is true (line 5), the path is formed by a sub-path between i and k (line 6), and another between j and k (each of these sub-paths, which may use intermediate vertices).
TABLE 3 Algorithm 2 formal statement of Floyd’s algorithm
For each node k = 1, 2, ..., n For each node i = 1, 2, ..., n
If l(i, k) < +∝
For each node j = 1, 2, ..., n If l(i, k) + l(k, j) < l(i, j) l(i, j) ←l(i, k) + l(k, j)
p(i, j) node code ← p(k, j) node code Next node j
Next node i Next node k
[with l(i, j) minimum path between i and j of the matrix of minimal path] [p(k, j) code node is a marker that records all k for an intermediate path between i and j] Line 1 2 3 4 5 6 7 8 9 10
3
See a full description of these algorithms in BARTNIK, G. MINOUX, M. 1986. Graphs, algorithms, software, Bordas, Paris: 118-146.
The calculation saves the data in the form of an "origin-destination" of minimal paths (This operation is possible because we wrote the line 7 which keeps in memory the code of the previous intermediate node j). One can thus obtain the matrix that defines all previous nodes k intermediaries between an origin and a destination (i, j).
Creating files with the minimum distances: File creation origin-destination
Whatever the initial conditions of the calculation of minimal paths (time or distance), the original destination file of the shortest paths records on the same line the source code of the node and the destination node, the minimum time and distance involved (respectively the minimum distance and time associated with that distance) and whether the calculation was the minimization of time (respectively minimizing the distance).
TABLE 4 File format originally intended for minimal paths
Code origin node Code destination node
Time (min) Distance kilometer
Files circuit paths
The previous matrix is registered and gave all the sub paths necessary to trace the circuit of intermediate nodes between a pair of nodes belonging to the origin-destination file.
TABLE 5 File formats of minimal paths
Code origin node
Code destination node
Previous node Previous arc
Code of the arc whose source node is the” previous node” and the destination node is the “destination node code”
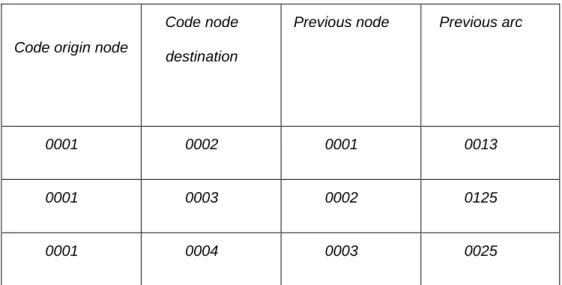
This file is read as follows: instead of reading a path in chronological order, the circuit is given by countdown.
Code origin node
Code node destination
Previous node Previous arc
0001 0002 0001 0013
0001 0003 0002 0125
0001 0004 0003 0025
For example we want to know the path that leads from node 1 to 4. Referring to the line that gives node 1 as the origin and node 4 as the destination, we read that node 4 before the funnel is 3 (= 1 + path ? 3 4). We then search the path from 1 to 3 and find that 2 is the previous 3 (path = 1 +? 2 3 4). We see that the previous path from 1 to 2 is the origin node 1, the node is finished and it passes through nodes 1, 2, 3 and 4. The previous column arc allows us to associate the arc of the directed graph with each intermediate node, with an origin code "the code of the previous node” and a destination “code of the node destination”. When we simulate movement by optimization the search for arcs in the corresponding paths is carried out.
Whereas distance is one of the crucial factors in displacements of the population, this is more than the simple “Euclidean” distance but rather “distance-time” as noted earlier. This distance-time was calculated by considering the distance in Km separating two places, and the speed of circulation was determined from the characteristics of the network (road type, speed, sinuosity, connectivity, density etc…). The morphology of roads in the region is complex because the road network covers a hilly area and the medium speed on the axis of circulation is reduced.
TABLE 6 The average speed for each type of road
Type of road and regulatory speed Average speed km/h
Highway 110
Expressway 90
Large 2 or 3 lanes road 70
2 Lanes road 60
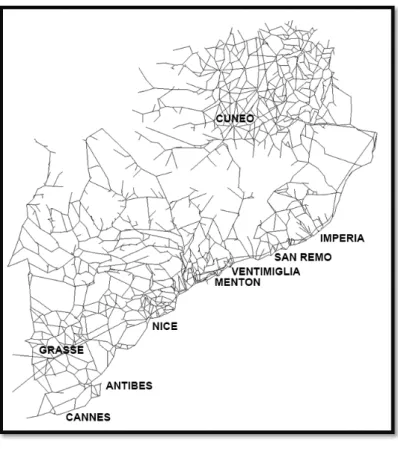
FIGURE 1 Graph network of Southern Alps
Arcs represent road chunks distance of which is expressed in minutes. All municipalities are represented by chunks which are summits of graph and on the same graph we added variables: the location of general practitioners, specialists, for example. The place of destination represents any municipality which is characterized by the presence of a health service. The population of any municipality having an offer of care does not move, since we favour the proximity of care, and not the choice between several destinations or several practitioners.
Knowing the geographical distribution of the offer of care and that of users of the services, and also the road infrastructure, accessibility to health care can be spatially differentiated and quantified. Access to health care is divided into two parts:
1- Access to general practitioners and to medical specialists, 2- Access to pharmacies and medical laboratories.
The data are from 2006 and come from the French directory ADELI of the occupations of health4 and from the Aziende Sanitarie Locale (ASL) for Italy5. The data are similar and the only harmonization consisted of grouping at the level of the psychologists and the neurologists, as well as
4
http://www.finess.sante.gouv.fr 5
gynaecologists and obstetricians, because these distinctions do not exist in Italy. We did not retain all the specialists, but only 11 categories which correspond to the doctors to whom the population has most need: dermatologists, ophthalmologists, gastroenterologists, rheumatologists, chiropodists, pulmonologists, endocrinologists, psychiatrists, neurologists, gynaecologists and paediatricians.
2. MODELING THE ACCESS TO GENERAL PRACTITIONERS AND TO SPECIALIST DOCTORS
2-1 MODELING THE ACCESS TO GENERAL PRACTITIONERS
In a previous study, (Perez, 2008) noted areas of very poor access to this sanitary basic service in the Alps. In 1998, 84% of the French population had a general practitioner in the municipality of residence and the average access time was 8 minutes (Schmidt and Niel, 1999). The average access to general practitioners in the space of Southern Alps is slightly lower than the French average of 1998 (7 min), but 11% of all the municipalities have an access time superior than 20 min, and 5% are situated beyond 30 min (Map 4, Modeling access to general practitioners).
MAP 4 Modeling access to general practitioners
In the Department of the Alpes-Maritimes the average distance-time to a general practitioner is 10 min. However, 30 000 inhabitants, essentially situated in the western hinterland of the Department do not have this basic service. The access time is greater than 30 min in the hight-country. The province of Imperia is characterized by an average access time (to the closest general practitioner) that is slightly lower (by 2 min). This can be explained by the fact that the surface area is smaller than the other territories and thus, the access time by the road network is reduced than in the Alpes-Maritimes. Finally, in the province of Cuneo, the average distance time is 7 min, but even so disparities appear because 7% of the municipalities have an access time greater than 20 min (3,6% of the population), in municipalities in mountainous regions of the western part of the province. Having seen that in the western parts of the Department of the Alpes-Maritimes and the province of Cuneo, and also in the central part of the province of Imperia, the population has travel more than 20-30 min, before reaching the first general practitioner, let us examine their destinations in more details.
MAP 5 Destination of populations without good access to general practitioners
Firstly, we note the municipalities of the middle country, and those around Cuneo have access time under 20 min. Secondly, one notes an intermediate level acces still under 20 min e.g hinterland of Grasse, rear-country of the Alpes-Maritimes, hinterland of Imperia, eastern part of the Province of Cuneo). Finally, in the central part of the hinterland of the Alpes-Maritimes there exist
municipalities which possess a number of general practitioners lower than the previous category, but which nevertheless represent an attractive pole.
2-2 MODELING THE ACCESS TO THE SPECIALIST DOCTORS
At the level of access to more specialized medicine, the tendencies observed previously for the general practitioners are even more obvious because this type of healthcare is generally an offer only concentrated in the main poles (Map 6 Modeling access to specialist doctors).
MAP 6 Modeling access to specialist doctors
In the Alpes-Maritimes, the average distance “time of access” to specialists is 13 min. However, 37% of the municipalities are characterized by an access greater than this average (between 20 and 45 min: for municipalities situated in the West part of the Alpes-Maritimes, and in the North of the Grasse back-country).The average distance time to the specialist is higher in the Italian provinces (20 min), because their concentration is stronger than on the French side. Indeed, the Italian specialists are essentially confined to the main cities (Imperia, San Remo and Cuneo). Finally, for 17 municipalities of the West part of Cuneo Province (3620 inhabitants), the access time
is greater than 20 min. The populations short of specialists gravitate towards the 88 municipalities which are provided with them, and are the nearest.
MAP 7 Destination of populations without specialists
Attention must also be paid to destinations which only a single specialist (Péone, Drap, Séranon, Gilette, Saint-Martin-Vésubie and Saint-Etienne-de-Tinée), because, the departure of the specialist in these municipalities will clearly be problematical for the surrounding municipalities in terms of accessibility. This situation is most noticeable in the Italian provinces of Imperia (Pieve di Teco, Isolabona and Pontedassio) and Cuneo (essentially in comunita montane), where the municipalities of Alba, Bra, Mondovi, Fossano, and Savigliano are characterized by a large number of specialists, poor access times and consequently a high number of inhabitants attracted towards them.
3. MODELING ACCESS TO DRUGSTORES AND TO MEDICAL LABORATORIES
3-1 MODELING ACCESS TO THE DRUGSTORES
MAP 8 Modeling access to the drugstores
The average density of pharmacies is highest in the department of Alpes-Maritimes, but this area is characterized by significant discontinuities in the distribution of supply which leads unequal access to these institutions for the population located mainly in the western part of the Grasse hinterland6 (Unlike the Alpes-Maritimes, the Italian provinces are characterized by a lower density of pharmacies, but they are more widely distributed, which results in better accessibility.
The map below shows the destinations to the nearest town with at least one pharmacy. The hierarchical classification has allowed us to identify a group of municipalities characterized by the presence of a single drugstore, and of course these municipalities represent poles of attraction for rural areas without a pharmacy. The presence of a single accessible pharmacy is an issue for the population because its closure could drastically increase access times.
6
It could be explained by the French regulations by which the number of inhabitants per pharmacy must be greater than 3000)
MAP 9 Destination of municipalities without pharmacies
The analysis of accessibility to pharmacies reveals that their spatial distribution is correlated with the population distribution. The offer of a pharmacy is increasingly important as the population increases. Disparities are less apparent in the Italian provinces than in the French department. Pharmacies in the Alpes-Maritimes are concentrated in major coastal municipalities, while in the provinces of Cuneo and Imperia (where the supply is less), the distribution is more balanced at the communal level.
3-2 MODELING ACCESS TO MEDICAL LABORATORIES
The average time to access the nearest laboratory is 24 min, but 42% of the municipalities of the Southern Alps take longer, meaning that 115 237 inhabitants have to travel more than 24 min to access this health service.
MAP 10 Access to medical laboratories
In the French department, laboratories are even more concentrated in the municipalities of the coastal strip and the Near Hinterland and the average access time to the nearest laboratory is 26 min. It increases quickly and becomes very long in the upper country especially in the West, where the access time exceeds 45 min. In the Italian provinces, where supply is reduced we found the same characteristics, with a concentration in main cities. The map below shows the phenomenon of polarization around the municipalities provided with medical laboratories. Indeed, areas of influence are quite important in terms of population.
MAP 11 Destination of populations without medical laboratories
The province of Cuneo is characterized by a very large number of people likely to move in order to access this health service. The “attraction” is highest for the town of Cuneo, with 3 laboratories and 113 262 people living nearby. Bra, Fossano, and Saluzzo with a single laboratory each, are destinations for respectively 16.000 inhabitants (81 municipalities), 91.618 inhabitants (57 municipalities) and 66.769 inhabitants (43 municipalities). In the province of Imperia, 12 municipalities are oriented towards the town of San Remo (26.000 inhabitants), and 25 to the town of Imperia (27.700 inhabitants) and of lesser importance to Bordighera (13 300 inhabitants). In the Department of Alpes-Maritimes, particular attention must be drawn to the influence of Saint-Martin-du-Var with a medical analysis laboratory which is the nearest common destination for 63 municipalities in the high country of the Department (27.100 inhabitants).
We have seen that the spatial distribution of health services is not at all uniform over the territories.
Furthermore, since a map summarizing the rates of old age (Map 12) appears to show a correlation between municipalities which are far from the generalists and specialists and those possessing a high proportion of elderly. The elderly have increased health needs, and could meet difficulties moving. A multidisciplinary health centre was established in the French department in February 2008 to enable those in the hinterland to access to care. Currently, the centre has a general practitioner, a
podiatrist-chiropodist, a dentist, an orthopaedist, a physiotherapist and a nurse. This section aims to evaluate the effectiveness of its spatial location using the gravity model.
MAP 12 The rate of elderly
Before the setting-up of the medical centre, the closest centre to Aiglun, Amirat, Briançonnet, Gars, Greolières and Mas was Seranon. These municipalities are characterized by weak population densities, high rates of elderly and by access times to care that are much higher than the average. After the establishing the closest municipality becomes Valderoure, and the estimated saving of time is then 6 min. So, the creation of the nursing home reduces the access time to the care, but only for the municipalities situated near Valderoure.
TABLE 7 Time access to the nearest specialist before and after the setting up of the nursing house Before After From to Seranon to Valderoure Saving time (min) Aiglun 42 38 4 Amirat 40 31 9 Brianconnet 50 44 6 Gars 36 32 4 Greolières 26 20 6 Le Mas 32 28 4 Les Mujouls 38 32 6 Saint Auban 29 24 5
Access time to specialists still remains very high compare to the average (around Peone, Gilette and Villars-sur-Var) suggest the creation of another medical centre in this area.
4. CONCLUSIONS
This analysis has highlighted areas with poor medical access. These areas are characterized by low population densities, high rates of elderly, reduced medical resources and consequently poor accessibility to the care. These spaces are both sides of the border. As regards access to general practitioners, the main differences are not so much trans-national, than between coasts and hinterlands, and between the plain and the mountain sector of Cuneo Province, whereas as far as specialist access is concerned the national logic of the distribution of healthcare prevails (a Beveridge-Bismark model). Access times become quite prolonged in Italy, where the offer of care is more concentrated in the main cities.
Accessibility to health care may in the very short term become reduced in the back country. Because of difficult working conditions in these sectors general practitioners do not lead to settle. Furthermore, with medical demography issues (ageing of health professionals) the percentage of municipalities provided with a general practitioner may decrease, and access times correspondingly increase.
In seeking healthcare, the patient makes a compromise between proximity and quality. For example, Italian patients may be prepared to move across the border (and therefore not be reimbursed) to consult French practitioners they judge according to be more competent than their Italian counterparts. This phenomenon is called "leakage".
But instead of “competition” the actors would benefit if they were to think in terms of cooperation, especially in an era of budget cutbacks; networking offers care and sharing across the Franco-Italian border to achieve economies of scale, eliminate costly duplication in the case of expensive equipment, and make use of complementarities in healthcare.
In summary, we have shown that a simple gravitational model can be used to quantify access to healthcare facilities in a geographically-complex region of Europe.
In future work, we will study indicators and outcomes of health in order to carry out detailed comparisons using novel “distance-time” measurement (parameter) developed in the current paper.
REFERENCES
ALDOUS, J-M. WILSON, R-J. 2000. Graphs and applications, an Introductory Approach, Springer
Verlag Londres Berlin Heidelberg, 439 p.
AMBROISE-THOMAS, P. 2007. Comment corriger l’inégalité de l’offre de soins en médecine générale sur le territoire national ?, Rapport IRDES, 9 p.
BADEYAN G et al. 2003. Information en santé : développements européens ADSP n°42:17-72 Health Consumer Powerhouse. 2008. Euro Health consumer index. Bruxelles, Rapport, 51 p. BAILLY, A. PERIAT, M. 1995. Médicométrie. Une nouvelle approche de la santé, Economica, 100 p.
BARNAY, T. JUSOT, F. ROCHEREAU, T. SERMET, C. 2005. Comparability of health surveys in Europe, Paris, IRDES, 56 p.
BAPTISTE, H. 1999. Interactions entre le système de transport et les systèmes de villes : perspective historique pour une modélisation dynamique spatialisée, Thèse Tours, 427 p.
BARTNIK, G. MINOUX, M. 1986. Graphs, algorithms, software, Bordas, Paris: 118-146.
BLACK, D. MORRIS, J-N. SMITH, C. TOWNSEND, P. WHITEHEAD, M. 1988. Inequalities in health, The Black Report, 464 p.
BENOÎT, J-M. BENOÎT, P. PUCCI, D. 2002. La France à 20 minutes (et plus), Belin, 271 p.
BESSIERE, S. BREUIL-GRENIER, P. DARRINE, S. 2004. La démographie médicale à l’horizon 2025 : une actualisation des projections au niveau national, DRESS, Etudes et Résultats, n°352, 12 p.
BONNET, P. 2002. Le concept d’accessibilité et d’accès aux soins, Université Paul Valéry Montpellier 3, Mémoire de DEA, 12 p.
BOURGUEIL, Y. MOUSQUES, J. MAREK, A. TAJHAMADY, A. 2007. Améliorer la répartition géographique des médecins : les mesures adoptées en France. Questions d’Economie de la Santé, IRDES n°122, 6 p.
BUSSE, R. WORZ, M. FOUBISTER, T. MUSSALIOS, E. BERMAN, P. 2007. Mapping health service access: national and cross-border issues, Rapport IRDES, 52 p.
BREUIL-GRENIER, P. 2003 Démographie médicale : intérêts et difficultés d’analyses à différents niveaux géographiques. Cahiers de Sociologie et de Démographie médicale. n°2 avril-juin XXXXIIIème année:165-186.
CASANOVA, Ph. KOLTCHANOV, V. LEGOUT, M. MARTINEAU, Y. 2001. Application et techniques nouvelles SA . Plateforme de simulation pour l’étude prospective de la mobilité urbaine des agglomérations françaises et européennes : MOBISIM-SMA, Ministère de l’Equipement, du
Logement et des Transports, Rapport DRAST (Direction de la Recherche et des Affaires Scientifiques et Techniques), 104 p.
COHU, S. LEQUET-SLAMAL, D. 2006. Les systèmes de santé du sud de l’Europe : des réformes
axées sur la décentralisation, DRESS, Etudes et Résultats, n°475, 8 p.
CURTIS, S. 2003. Health and Inequality: Geographical Perspectives, American Geographers, Vol 71. 1981: 425-436.
DECOUPIGNY, F. 2003. Modélisation d’un déplacement sur une double échelle in Graphes et réseaux : modélisation multiniveau, ouvrage collectif sous la direction de Philippe Mathis, Traité IGAT, série Aspects fondamentaux de l’analyse spatiale, Editions Hermès, 77-90.
FLOYD R-W. 1962. Algorithm 97: Shortest Path. Communications of the ACM Volume.5, no 6, June 1962: 345-360.
FORTHERINGHAM, S. Spatial structure and distance decay parameters Association of American
Geographers. Vol 71. 1981: 425-436.
FRANCE, G. TARONI, F. 2005. The evolution of Health policy making in Italy Journal of Health
Politics, Policy and Law, Vol.30, n°1-2, 169-188.
GOODMAN, D-C.1997.The distance to community medical care and the likelihood of hospitalisation : is closer always better ? American Journal of Public Health, n°87: 1144-1150.
HANSEN, W-G. 1959. How accessibility shapes land use, Journal of the American Institute of
Planners. n°25: 73-76.
HURIOT M., PERREUR J.,1997.L'accessibilité, in Auray P., Bailly A., Derycke P.-H., Huriot J.-M. (dir.), Encyclopédie d’économie spatiale : concepts, comportements, organisations, Paris :
Economica, 55-80.
KAUFMANN, M. WEGENER, D. 2001. Drawing Graphs, methods and models, Springer Verlag, Berlin Heidelberg New York, 307 p.
KERVASDOUE, J. (sous la direction de). 2006. Carnet de santé de la France en 2006: économie, droit et politiques de santé, Dunod, 248 p.
LACOSTE, O. 2003. Les suds du Nord Etude territorialisée de Santé publique et de prospective,
Rapport, 100 p.
LACOSTE, O. 2002. Distance, proximité, accessibilité attraction et recours de la population vis-à-vis du système de soins, Rapport, 73 p.
L’HOSTIS, A. BAPTISTE, H. 2002. Qualité de service et accessibilité régionale, Rapport de
recherche GRTT, Rapport INRETS, 90p.
LUCAS-GABRIELLE, V. NABET, N. TONNELLIER, F. 1995. Les soins de proximité une exception française ? Rapport de travail, CREDES, 92 p.
OCDE. 2007. Panorama de la santé. Les indicateurs de l’OCDE, Rapport OCDE, 195 p.
MULLER, J-C. 1979. La cartographie d’une métrique non euclidienne: les distances-temps, l’Espace Géographique, vol 8, n°3: 215-227.
MULLER, P. 2006. Espaces mouvements et territoires de soins, Pratiques : Cahiers de la
Médecine utopique. 4-70.
NIEZ, X. 2001. Les facteurs qui influencent la démographie médicale au niveau régional Cahiers
de Sociologie et de Démographie médicale, XXXXIème année n°2, avril-juin : 141-172.
PEREZ, S. 2008. Accessibilité aux soins dans l’espace frontalier des Alpes du Sud, l’Harmattan,
Géographie et Cultures 15 p.
REILLY, W-J. 1931. The Law of Retail Gravitation, W. Reilly ed, 285 Madison Ave, New York, NY SCHMITT, B. NIEL, X. 1999. La diffusion des services sanitaires et sociaux depuis 1980. Le poids croissant des zones périurbaines. DRESS Etudes et Résultats, Fasc 32 8 p.
SMITH, S. EASTERLOW, D. 2005. The strange Geography of Health Inequalities, Transactions of
the Institute of British Geographers, 30:173-190.
VIGNERON, E. GUIGOU, J-L. 2001. Distance et Santé. La question de la proximité des soins,
PUF, 127 p.