HAL Id: hal-02347956
https://hal.archives-ouvertes.fr/hal-02347956
Submitted on 7 Nov 2020HAL is a multi-disciplinary open access archive for the deposit and dissemination of sci-entific research documents, whether they are pub-lished or not. The documents may come from teaching and research institutions in France or abroad, or from public or private research centers.
L’archive ouverte pluridisciplinaire HAL, est destinée au dépôt et à la diffusion de documents scientifiques de niveau recherche, publiés ou non, émanant des établissements d’enseignement et de recherche français ou étrangers, des laboratoires publics ou privés.
Effects of complexation with sulfuric acid on the
photodissociation of protonated Cinchona alkaloids in
the gas phase
Feriel Ben Nasr, Ivan Alata, Debora Scuderi, Valéria Lepère, Valérie Brenner,
Nejm-Eddine Jaïdane, Anne Zehnacker
To cite this version:
Feriel Ben Nasr, Ivan Alata, Debora Scuderi, Valéria Lepère, Valérie Brenner, et al.. Effects of complexation with sulfuric acid on the photodissociation of protonated Cinchona alkaloids in the gas phase. Physical Chemistry Chemical Physics, Royal Society of Chemistry, 2019, 21 (28), pp.15439-15451. �10.1039/c9cp01518c�. �hal-02347956�
1
Effects of complexation with sulfuric acid on the
Photodissociation of Protonated Cinchona Alkaloids in the
gas phase
Feriel Ben Nasr,
a,dIvan Alata,
aDebora Scuderi,
bValeria Lepère,
aValerie Brenner,
cNejm-Eddine Jaïdane,
dAnne Zehnacker
*aa) Institut des Sciences Moléculaires d’Orsay (ISMO), CNRS, Univ. Paris-Sud,
Université Paris-Saclay, F-91405 Orsay, France
b) Univ. Paris-Sud, Laboratoire de Chimie Physique, UMR8000, and CNRS,
Orsay, F-91405 France
c) LIDYL, CEA, CNRS, F-91191 Gif-sur-Yvette, France
d) Laboratoire de Spectroscopie Atomique, Moléculaire et Applications
(LSAMA) Université de Tunis El Manar, LSAMA, Tunis 1060, Tunisia
2
Abstract
The role of complexation with sulfuric acid on the photodissociation of protonated cinchona alkaloids, namely cinchonidine (Cd), quinine (Qn) and quinidine (Qd), is studied by combining laser spectroscopy with quantum chemical calculations. The protonated complexes are structurally characterized in a room-temperature ion trap by means of Infra-Red Multiple Photon dissociation (IRMPD) spectroscopy in the fingerprint and the (XH) (X=C, N, O) stretch regions. Comparison with density functional theory calculations including dispersion (DFT-D) unambiguously shows that the complex consists of a doubly protonated cinchona alkaloid strongly bound to a bisulfate HSO4- anion, which bridges the two protonated sites of the cinchona alkaloid.
UV excitation of the complex does not induce loss of specific photo fragments. Indeed the UV-induced fragmentation pattern is identical to that observed in collision-UV-induced dissociation experiments. This contrasts with the photodissociation observed in the protonated monomer or dimer, for which photo-specific fragments were observed. Analysis of the nature of the first electronic transitions at the second order approximate coupled-cluster level (CC2) explains the difference in behavior of the complex relative to the monomer or dimer towards UV excitation.
3
Introduction
Exposure of biomolecules like proteins or DNA to UV light leads to structural damages, which in turn alter their biological functions, an exemplary case being mutagenic and carcinogenic effects caused by UV radiations on DNA.1-3 These damages may be increased in the presence of
sensitizing drugs.4 Understanding the protection mechanisms of biomolecules against UV-induced
damages has prompted numerous studies, both in the biomolecules themselves and in model systems.5 For example, the photochemistry and photophysics of individual DNA bases have been intensively studied in solution.6-10 The solvent, water in a biological context, plays an important role in the deactivation process, by stabilizing polar or charged species, modifying the excited-state energetics, or acting as a thermal bath. Gas-phase experiments are therefore required to get information on the molecule properties without the participation of the solvent. They have been conducted on small biomolecules such as DNA bases11-13 and peptides and allow getting information on the photophysical processes at play in the chromophore.8, 14-22 Many studies have been devoted to the electronic excited states of protonated biomolecules isolated in the gas phase, either under supersonic expansion conditions,23, 24 in room-temperature ion traps,15, 25-31 and more recently in cryogenic ion traps.32-40 Of special interest are the aza-aromatic molecules due to their complex photophysical behavior related to several close-lying electronic transitions.29, 30, 37, 41, 42
We have recently studied aza-aromatic molecules, namely, cinchona alkaloids. Cinchona alkaloids, among which quinine is the most famous, originate from the bark of Cinchona trees and are widely used in chemistry or medicine.43-48 However, photosensitizing effects have been observed in the treated patients.49 This justifies the studies of photophysical and photochemical processes in
quinine, in its free base or sulfate forms.
The cinchona alkaloids, quinine (Qn), quinidine (Qd), cinchonidine (Cd) and cinchonine (Cn) are displayed in Figure 1. They consist of an aliphatic bicyclic tertiary amine, the alkaloid part, which is substituted by a vinyl group at C3 and linked to a planar aromatic quinoline ring via
an OH-containing flexible linker C8C9. These natural molecules are classified into pairs, i.e. Qd/Qn
and Cd/Cn, which only differ by the chirality of C8 and C9. Qd/Qn differ from Cd/Cn by the presence
of a methoxy substitutent on the aromatic ring. Cinchona alkaloids contain two basic nitrogens (Nalk
and Narom in Figure 1). The alkaloid nitrogen Nalk is the most basic site and is protonated in our
experimental conditions. When not specified otherwise, CdH+ denotes cinchonidine protonated on Nalk. Protonation on Narom will be denoted by CdNaromH+. Doubly protonated cinchonidine (noted
CdH22+ in what follows) is formed in acidic solution (pH below <~4-5). Cinchona alkaloids possess
4
optically active while the nπ* transitions involving the quinoline or the alkaloid nitrogen lone pair have much weaker oscillator strength.50, 51 Like for other aza-aromatic molecules,30 protonation
removes the nπ* excited state involving the alkaloid nitrogen lone pair from the transition manifold. This results in high fluorescence quantum yield.52
We have previously reported that protonated cinchona alkaloids show complex photochemical properties in the gas phase, using MS3 experiments involving IR characterization of the UV fragments.53-57 Based on IR spectra of the photofragments, combined with CC2 calculations, we have proposed that UV-induced C8C9 bond cleavage happens through conformation-dependent
reactions involving coupled electron and proton transfers.53 The mechanism is modified in the protonated dimer, for which a photo-induced proton transfer, followed by dissociation of the complex, results to a metastable molecule protonated on the aromatic nitrogen, CdNaromH+.54, 57, 58
We extend here these studies to the complexes of cinchona alkaloids with sulfuric acid. Indeed, drugs based on cinchona alkaloids are used under their sulfate form and the above-mentioned complexes are spontaneously formed in the electrospray. The complexes are studied by multistage mass spectrometry (MSn) coupled with laser spectroscopy. We first resort to Infra-Red Multiple Photon Dissociation (IRMPD) spectroscopy, combined with quantum chemical calculations, to determine the structure of the protonated complexes of cinchona alkaloids with sulfuric acid. H2SO4 is a strong di-acid; in water at neutral pH, the most abundant species is SO4
2-and the concentration in H2SO4 is negligible. In contrast, H2SO4 is stable in the gas phase59, 60 while
isolated HSO4- has never been observed. Rare gas matrices are an intermediate case in which H2SO4
is observed when isolated or included in a 1:1 complex with NH3.61 However, for more basic
environments, proton transfer takes place and an ion pair containing HSO4- is formed.
This study first aims at defining which forms of Cd, CdH+ or CdH
22+, and sulfuric acid,
H2SO4, HSO4- or SO42-, are contained in the protonated complex. We can exclude SO42- because
there are only two stable protonation sites in the Cd molecule. However, should we describe the complex in terms of CdH+:H2SO4 or CdH22+:HSO4-? Furthermore, UV irradiation only results to
dissociation of the complex into protonated monomers, in contrast to protonated monomers and dimers that yield specific fragments under UV excitation. The second goal of this study is then to explain the absence of specific photofragments of the complex, in terms of structure and nature of the electronic excited states calculated at the CC2 level. The present study focuses first on Cd, and is extended to Qn and Qd, which have a methoxy substitutent on the aromatic ring. Moreover, Qn and Qd differ from each other by the chirality of C8 and C9, which is 8S/9R in Qn, as it is in Cd, and
8R/9S in Qd. We will assess whether the structure of the complexes or their photodissociation mechanism is affected by this change in absolute configuration.
5
Experimental and theoretical methods:
a) Experimental method:
The experimental set-up has been described in details elsewhere.53 The multistage mass spectrometry (MSn) experiments were based on a modified Paul ion trap (Bruker, Esquire 3000+).62 Ions were generated by electrospraying a 10 μM solution of the alkaloids or their sulfate in a 50:50 water/methanol mixture, adding 2 μl of 98% formic acid to assist the protonation. The electrospray ionization (ESI) conditions were those already described for these systems.57, 63 The alkaloids under study as well as their sulfates were obtained from Sigma-Aldrich and were used without further purification.
Collision-induced dissociation (CID) spectra were obtained in a MS2 experiment by mass selection of the parent in a ±5 Da window. The parent was fragmented in the Paul ion trap by collision with He, applying a radiofrequency (RF) voltage of variable amplitude during 200 ms.
The IRMPD spectra were recorded resorting to a MS2 scheme involving IR irradiation in the above-mentioned Paul ion trap, equipped with a diamond window. The spectra were recorded in the 800-1800 cm-1 range using the infrared free electron laser (FEL) at the “Centre Laser Infrarouge
d’Orsay CLIO”.64 The spectral bandwidth was typically 1% of the central wavelength and the power
of the order of 0.8W. The 2800-4000 cm-1 range was covered by a tabletop IR Optical Parametric
Oscillator/Amplifier (OPO/OPA) (LaserVision 10 Hz repetition rate, pulses duration 4-6 ns, spectral bandwidth 3 cm-1, IR power of ~ 200 mW). The IR laser was focused on the center of the trap by a parabolic Oxygen-Free High-Thermal Conductivity (OFHC) copper mirror with focal length of 350 mm. A synchronized CO2 laser (Universal Laser system 10 W at cw operation, centered at λ = 10.6
μm) was co-focused with the FEL or OPO source to enhance the fragmentation yield.
The fourth harmonic (266 nm) of a 10 Hz Nd-YAG laser (Minilite Continuum 500 µJ/pulse, pulse duration 5 ns) was used to electronically excite the systems, hence inducing their photo-dissociation. The UV laser was slightly focused on the center of the trap by a 1000 mm focal length quartz lens. The protonated complex built from cinchonidine and sulfuric acid (m/z 324) was isolated in a 5 Da window and fragmented by irradiation at 266 nm during 1 s. The photo-fragments were isolated and characterized by IRMPD based on a MS3 scheme reported previously.53, 54, 58
b) Theoretical methods:
The potential energy surface (PES) of the complexes of cinchonidine was first explored with a force field using the Maestro program, a part of the Schrödinger package.65 Exploration with two
6
force fields, MMFFs and OPLS2003, generated similar structures.66 67 These force fields were
already used successfully for exploring the potential-energy surface of neutral or protonated quinine as well as its protonated dimer.57, 68 The structures with energy below 21 kJ/mol relative to the most
stable one were fully optimized within the frame of the density functional theory (DFT) including empirical dispersion (DFT-D3),69, 70 at the B3LYP-D3/6-31++G(d,p) level71-73 and the harmonic frequencies were calculated at the same level of theory for structures which correspond to true minima. This level is known to yield frequencies in good agreement with experimental values.70, 72,
74, 75 The “tight” criterion and fine grid were used so that the convergence threshold was set to 6 10-5
and 1.5 10-5 au for the maximum displacements and forces, respectively. In order to take into account the anharmonicity, the harmonic frequencies were corrected by mode-dependent scaling factors. These scaling factors were determined as the average of the ratio of the experimental frequencies to the calculated values of the studied molecules as described in section c).
Basis-set superposition error (BSSE) effects on both the geometry and energetics were taken into account. The geometry optimization was performed considering the BSSE term and the energetic was calculated using the counterpoise method.76 In what follows, the stability of the complexes is given in terms of Gibbs energy ΔG relative to the most stable structure taken as the zero of the scale. The BSSE corrections does not amount to more of 5% of the relative Gibbs energy and hardly modify the geometry. For example, the NalkH+…O- distance and NalkH+…O- angle are
modified by less than 0.1 % in the most stable form of CdH22+:HSO4- (videinfra). The difference is
slightly larger for the CdH+:H
2SO4- complexes, 0.3% and 1% for the most stable forms.
Furthermore, BSSE corrections hardly modify the calculated harmonic frequencies of the most stable form of CdH22+:HSO4-. The BSSE-corrected frequencies differ only by less than 0.1%from
the non-BSSE-corrected ones in the ν(XH) range, a discrepancy smaller than the experimental resolution (4 cm-1). The discrepancy is slightly larger in the fingerprint region, but remains smaller than 0.3%, except for the β(NalkH+) mode (0.6%). The intermolecular modes are more affected (1 to
3%). The most modified mode is the hindered rotation of HSO4- (cogwheel motion) for which the
discrepancy between the two calculated frequencies is 5%.
Quinine and quinidine differ from cinchonidine by the presence of a methoxy OCH3
substituent in the aromatic ring. This leads to additional conformational flexibility, with two classes of conformers corresponding to the OCH3 in cis or trans position, as observed in
2-methoxynaphthalene.77 The complexes containing quinine and quinidine were then calculated using those containing cinchonidine as starting points. The chirality of the chiral centers was modified when necessary and the methoxy group was added, in the two possible positions.
7
The calculations were done using the Gaussian 09 package.78 Obtained conformers
structures were drawn with the Gabedit software.79 Assignment was based on spectroscopic criteria
(good match between calculated and experimental frequencies) and thermodynamics, favoring the most stable structures.
The electronic excited states of the protonated monomers and complexes were calculated at the CC2 level of theory.80 The calculations were performed using the resolution-of-the-identity (RI) approximation81 and the correlation-consistent polarized valence double-ζ (cc-pVDZ) basis set.82 The ground state of the most stable structure assigned to the experiment was calculated at the RI-CC2 level, keeping the DFT-D geometry. Vertical excitation energies were then calculated at the RI-CC2 level considering six excited states. 22 core orbitals were frozen for the protonated cinchonidine monomers and 31 for the complex. The CC2 convergence was set at 10-7. This method has been used on numerous protonated organic molecules and satisfactorily reproduces the S10
transition energy.83 All the calculations were done using the Turbomole V6.6 program package.84 The difference in density between the ground state and the electronic excited states were calculated using the density analysis of Turbomole and plotted using the VMD software.85
c) Isolated systems
The vibrational spectroscopy of the molecular sub-units is summarized here. Comparison between the experimental vibrational frequencies determined previously or in this work and those calculated here are used for determining the scaling factors used.
H2SO4 and HSO4-: The vibrational spectroscopy of H2SO4 is well known in the gas phase59, 60 and
in low-temperature matrices.86 In the 3 μm region, the infra-red spectrum of H2SO4 vapours shows
an intense band at 3609.2 cm-1 assigned to the ν(OH) stretch.59 The scaling factor in this range is determined as the ratio between experimental and calculated (3755 cm-1) frequencies of the H2SO4
ν(OH) stretch, it amounts to 0,961. This scaling factor is of the same order as those defined for the B3LYP functional associated with other Pople basis sets.87
The experimental spectrum of H2SO4 in the fingerprint region (800-1800 cm-1) is dominated
by two intense features at 1220.1 and 1464.7 cm-1 assigned to the ν(SO2) symmetric and
antisymmetric stretches, respectively. The band located at 1157.1cm-1 is assigned to the β(SOH) asymmetric bend while that at 834.1 and 891.4 cm-1 are attributed to the S(OH)2 symmetric and
asymmetric stretches. As we shall see later, the vibrational modes of the complexes involve stretching and bending motions extensively delocalized on the OH and CO groups. For this reasons, we have treated the stretching and bending modes on the same footing. The scaling factor in the
8
fingerprint region is determined as the average ratio between experimental and calculated frequencies of the β(SO2) and β(OH) bends, and νS(OH)2 and ν(SO2) stretches. The obtained scaling
factor is 1,060. This value reproduces well the experimental IR spectra of H2SO4 in the low
frequencies region and scaling factors >1 are generally used for SO containing species.88-90
Less is known on the infrared spectroscopy of the bisulfate anion HSO4-, which has been studied
mostly in the condensed phase, for example in sulfuric acid solutions91, 92 or thin films,93 or in strongly bound complexes under cryogenic matrix61 or gas-phase conditions.90 Due to the absence of experimental data in isolated conditions, we will use the same scaling factors as for H2SO4.
CdH+, QnH+ and QdH+: The conformational landscape of neutral cinchona alkaloids has been
extensively studied by Bürgi et al. and Caner et al.94-96 The same nomenclature as for the neutral systems is used for all protonated states,97 as described previously.53 The details of the nomenclature are given in the electronic supplementary information (ESI†). Briefly, the structures can be separated in two classes: in the “Closed” structures, the alkaloid is folded over the aromatic ring while in the “Open” structures, it is extended outwards.
The vibrational spectroscopy of gas-phase Cd is not known. However, Qn and Qd have been studied previously under jet-cooled conditions by IR-UV double resonance spectroscopy.68 The experimental frequency of 3650 cm-1 observed in both molecules, a typical free ν(OH) stretch value, has been assigned to the ν(OH) stretch of the most stable γ-open conformer for which the calculated value is 3821 cm-1, which leads to a scaling factor of 0.955. The experimental ν(OH) frequency does
not change much upon protonation on the alkaloid nitrogen; it is measured at ~3650 cm-1 in CdH+,
QnH+, or QdH+ by IRMPD spectroscopy.56 It does not change substantially with the protonation on
the aromatic nitrogen and appears at the same value in CdNaromH+. The average scaling factor of the
ν(OH) stretch of the protonated species is then taken equal to 0.955, the same value as determined for neutral Qn under supersonic-jet conditions.
The ν(NalkH+) stretch frequency is sensitive to conformation and hydrogen bond formation.56
The cinchonidine protonated monomers and dimers (ν(NalkH+) stretch frequency ranging from 3209
to 3300 cm-1) were used to determine the average scaling factor, which amounts to 0.970.54
The ν(NaromH+) stretch is experimentally observed at 3470 cm-1, in the monomer and the
dimer. The calculated value does not depend on the conformer and yields a scaling factor of 0.971. We can anticipate from what is known on the isolated systems that free ν(OH) stretches should appear around 3650 cm-1 whatever the protonation state of the molecule. For protonation on Nalk, ν(NalkH+) is expected at 3280 cm-1 for a free NalkH+ and strongly shifted down in energy when
it is involved in an intermolecular hydrogen bond.56 Finally, for protonation on Narom, ν(NaromH+) is
9
between calculated and experimental frequencies of the reference structures allow us to assume an error of ~20 cm-1 on the calculated frequencies.
Results:
1. Structural studies
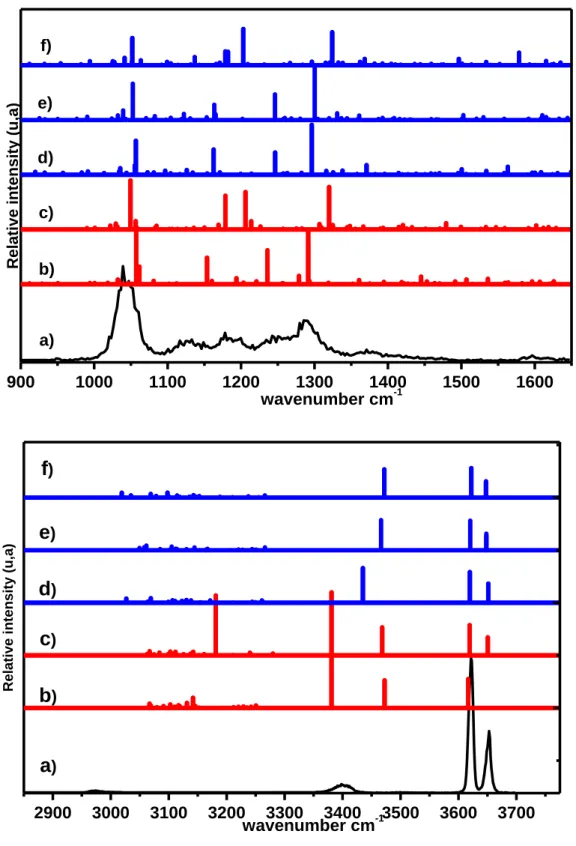
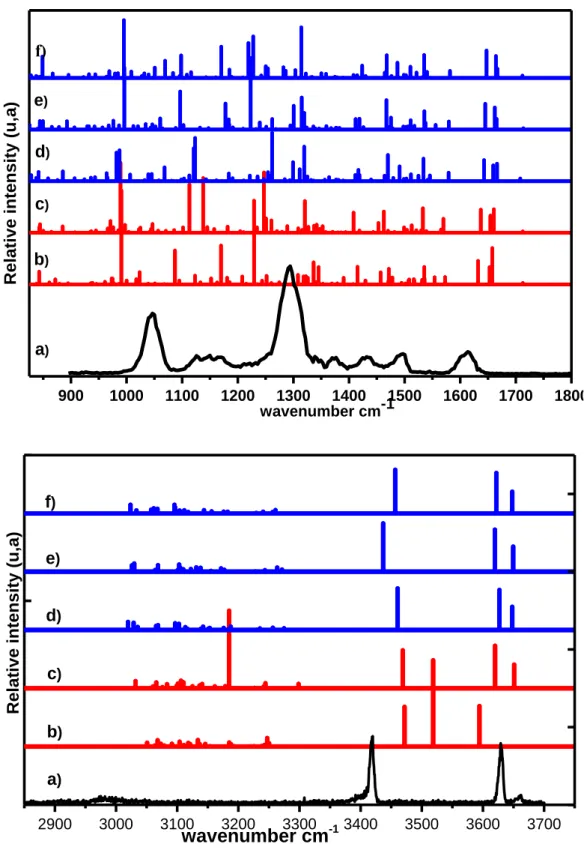
1.1. Experimental IRMPD spectra
The IRMPD spectra obtained by electro-spraying a solution of cinchonidine sulfate are shown in Figure 3 and Figure 5. The 3 μm region shows two narrow bands in the region of the free ν(OH). The presence of two bands in this region allows ruling out the presence of SO42-; one of these bands
belongs to CdH+ and the other one to H2SO4 or HSO4-. The band at 3652 cm-1 is typical of the free
ν(OH) of Cd but is not informative about the protonation site of Cd. The intense band at 3621 cm-1
appears in the range of the free ν(OH) of H2SO4 or HSO4-, but does not allow deducing whether the
system contains H2SO4 or HSO4-. Finally, a broad band appears at 3396 cm-1. This range
corresponds either to ν(Narom H+) or to intermolecular hydrogen-bonded ν(OH). We will therefore
consider the two species H2SO4 and HSO4- and calculate both CdH+:H2SO4 and CdH22+:HSO4
-complexes. The fingerprint region is dominated by an intense band centered at 1040 cm-1 followed by congested features spreading up to 1400 cm-1.
1.2. Calculated structure of the CdH+:H2SO4 complex
The most stable structures of the complexes are presented in Figure 2. The most important structural parameters are listed in Table 1 and the relative energies in Table 3.
All the calculated conformations are strongly bound by an intermolecular NH+q…-q’O interaction that links NalkH+ and the SO group of sulfuric acid (d=1.84 to 1.88 Å). NBO analysis of
the electron density and orbital populations is reported in the ESI† and shows that this interaction is mostly electrostatic in nature. It manifests itself by a substantial red shift of the ν(NalkH+) stretch
frequency at 3291 cm-1, while the ν(OH) frequencies remain unchanged relative to the bare molecules, reflecting the free nature of the H2SO4 hydroxyls.
In Anti-γ-open’, one of the OH groups of H2SO4 interacts with the aromatic ring, more
precisely the C6 ring without nitrogen, denoted as aromC in what follows (OH…aromC interaction).
The OH…X distance, where X is the center of the aromC ring, is 3.30 Å. Due to this interaction, the
10
The complexes with the Closed conformers are more compact, with shorter distances between H2SO4 and the aromatic ring. Anti-γ-closed and Anti-γ-closed’ exhibit an OH…πaromC
interaction, with a OH…X distance of 2.58 Å, much shorter than in Anti-γ-open’. In Anti-γ-closed’, a strong OH…Narom hydrogen bond bridges H2SO4 and the aromatic nitrogen (d=1.58 Å). This
interaction results to a strong down shift of the H2SO4 ν(OH) frequency, down to 2343 cm-1.
The calculated spectra of the CdH+:H2SO4 structures are shown in Figure 3. The free ν(OH)
stretches localized on CdH+ and H2SO4 are calculated in the 3550-3650 cm-1 range for all the
structures. When one hydroxyl group of H2SO4 interacts with the aromatic π electrons, like in
Anti-γ-open’, its ν(OH) frequency is shifted down to the 3400-3450 cm-1 range. When one hydroxyl
group of H2SO4 interacts with Narom, its ν(OH) frequency is shifted further down to ~ 3300 cm-1 in
Anti-γ-closed’ and 2343 cm-1 in Anti--closed, which is out of our experimental range and is not
presented in Figure 3. The ν(NalkH+) stretch is calculated in the 3170-3270 cm-1 range in all the
CdH+:H2SO4 complexes indicating that it is involved in a strong interaction.
In the fingerprint region, the two β(OH) bending modes of H2SO4 are calculated in the
1150-1200 and 1250-1300 cm-1 range. They are the most intense calculated transitions, together with the ν(S-OH) stretch at ~900 cm-1 and the two ν(SO) stretches in the 1300- 1450 cm-1 region.
1.3. Calculated structure of the CdH22+:HSO4- complex
The most stable structures of the CdH22+:HSO4- complex are presented in Figure 4. The
structural parameters are listed in Table 2 and the energies in Table 3. Two of these complexes contain the Open form of CdH22+ and three the Closed form. They all involve strong electrostatic
interactions between the bisulfate anion and the protonated nitrogen atoms. These interactions are mostly electrostatic, like that described above. The electrostatic interactions between two charged species being stronger than that between a charged species and a neutral entity. All the CdH22+:HSO4- complexes are then much more stable than the corresponding CdH+:H2SO4
structures, the energy difference between them being 7 kcal/mol or more.
The structures containing Open and Closed conformations of CdH22+ strongly differ from
each other. When CdH22+ is Open, stabilization mostly arises from the NalkH+q…-q’O interaction.
This ionic interaction is strong, as it can be assessed from the short (1.58 Å) distance between NalkH+q and O-q’, and purely electrostatic. The quinoline ring and HSO4- are distant by more than
6.0 Å. The Anti-β-open structure involves an additional OH…O-q’ hydrogen bond relative to Syn-γ-open, from the OH of CdH22+ to one oxygen atom of HSO4-. The corresponding OH…O-q’
11
contributes to the stabilization of Anti-β-open, which is more stable than the Syn-γ-open by ~ 2 kcal/mol.
The complexes with the Closed conformers involve an additional interaction between O-q’ of HSO4- and the NaromH+ group of CdH22+, which allows HSO4- to bridge the two protonated
nitrogen atoms. This interaction is not as strong as NalkH+q…O-q’, because of the larger (> 2.3 Å)
distance between the two sites. Again, it is purely electrostatic. The geometry of the complex results from a compromise between these two interactions, but that involving the NalkH+ group is dominant
and dictates the NalkH+q…O-q’ distance, quasi identical (1.64 to 1.60 Å) to that calculated for the
Open complexes (1.58 to 1.57 Å). The NaromH+q…O-q’ interaction stabilizes the complexes
containing Closed forms by more than 2 kcal/mol relative to those with Open forms.
The spectra calculated for the Cd2H2+: HSO4- structures are shown in Figure 5. The ν(OH)
stretches localized on Cd2H2+ and HSO4- are calculated in the 3580-3680 cm-1 range, as expected
for free OH, for all the structures, except Anti-β-open in which the Cd2H2+ ν(OH) is shifted down
to 3380 cm-1 because the OH group acts as an hydrogen bond donor to an oxygen of HSO4-. The
spectrum of Syn-γ-open stands out by the presence of an intense transition at 3106 cm-1 due to the aromatic ν(C3’H) stretching mode gaining intensity through the interaction with the HSO4- ion. The
calculated spectrum of all the complexes shows an intense ν(NalkH+) stretch in the 2570 - 2700 cm-1
region, which is out of our experimental range and not shown in Figure 5. 56
The calculated ν(NaromH+) does not vary much with the structure and is calculated at ~ 3465-
3470 cm-1 for the complexes with both Open and Closed structures. It is only shifted down by a few wavenumbers (<5 cm-1) in the bridged complexes with the Closed forms, with a slightly lower value
in Syn-γ-closed’ than Anti-γ-closed, in line with the more compact structure of the former.
Most of the peaks calculated in the fingerprint region correspond to vibrations localized on HSO4-. Syn-γ-closed’, Anti-γ-closed and Anti-β-openhave vibrations at 1162, 1246 and 1295 cm-1
that are described in terms of the β(OH) bending motion of HSO4- coupled with ν(SO) stretches.
Syn-γ-open and Syn-γ-closed have several vibrations between 1170 and 1210 cm-1 that correspond to the β(OH) bending motion of HSO4- coupled with β(CaliphaticH) and β(CaromaticH) bending motions.
1.4. Assignment of the observed complex
Figure 3 compares the experiment to the spectra simulated for CdH+:H2SO4. The calculated
spectrum of CdH+:H
2SO4 poorly reproduces the experimental data in the high frequencies range as
well as in the fingerprint region. In particular, no band is observed in the range of the calculated bonded ν(NalkH+) (3170-3300 cm-1 range). In the fingerprint region, no strong band is observed
12
above 1350 cm-1 where the two ν(SO) stretches are expected. This result allows ruling out that the
observed complex is CdH+:H 2SO4.
Figures 5 compares the experiment to the spectra simulated for CdH22+:HSO4-. In the high
frequency region, the band around 3650 cm-1 is assigned to a free ν(OH) stretch of CdH22+. This
allows ruling Anti-β-open for the attribution. The strong feature at 3621 cm-1 is attributed to ν(OH) of HSO4- and is only slightly lower in frequency than the free v(OH), estimated at 3650 cm-1 in
HSO4-. The broader feature around 3400 cm-1 is attributed to the ν(NaromH+) stretch. Finally, no
intense band is experimentally observed in the 3000-3200 cm-1 region corresponding to the ν(CH) stretching modes. Thus, the observed complex cannot be Syn-γ-open. Based on the 3μm region, we can safely assign the observed complex to one of the calculated structures containing a Closed conformer, which all reproduce reasonably well the experimental spectrum. The experimental spectrum obtained in the fingerprint region is also satisfactorily reproduced by those calculated for the Closed structures and most of the observed peaks are assigned to transitions localized on HSO4-.
Moreover, the energetic values listed in Table 3 indicate that the Closed structures are by far more stable than the complexes involving neutral H2SO4, and more stable by several kcal/mol than the
Open conformers. Anti-γ-closed, Syn-γ-closed’ and Syn-γ-closed are almost iso-energetic within the error. Among them, Syn-γ-closed’ displays the best match with the experimental spectrum both in the 3 m and in the fingerprint region. We therefore assume that the observed spectrum is mainly due to Syn-γ-closed’, without excluding a contribution of the two other forms.
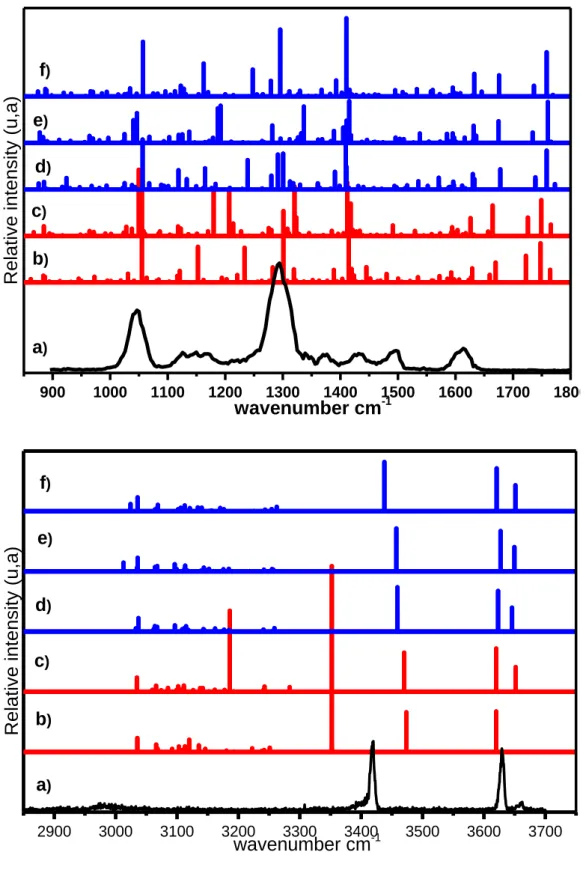
1.5. Extension to quinine and quinindine
The geometries obtained for QnH22+:HSO4- are shown in Figure 6 and Figure 7. The
dihedral angles of the calculated complexes are listed in Table 4 and Table 5 and their energetics in Table 6. The structures obtained for QdH22+:HSO4- are very similar and are shown in Figure S1.
The energetics and the structural parameters are listed in Tables S1 and Table S2 of the ESI†. The calculated complexes are similar for the cis and trans structures and resemble those obtained for CdH22+:HSO4-. The presence of the OCH3 substituent slightly modifies the energetic
order between the different geometries and complexes with Open forms become energetically competitive with the complexes with Closed forms. The complexes built from the Closed cis conformers resemble those obtained for CdH22+:HSO4-, with HSO4- bridging the two protonated
sites of the molecule and showing no interaction with the OH or the OCH3 groups of Qn. Cis and
Trans syn-γ-Open show no difference relative to the CdH22+:HSO4- system. In contrast, the
13
only with the NalkH+ group but also with the OCH3 group (distance of 2 Å) and the OH group of
QnH22+. These additional hydrogen bonds contribute to the stability to the complex. In
Trans-syn-β-open, only the additional interaction between HSO4- and OH is observed.
The IR spectra of all these complexes, the 3μ region and the fingerprint region, are presented in
Figures 8 and 9. In the 3 μm region, the spectra of the cis/trans QnH22+:HSO4- complexes parallel
those of the CdH22+:HSO4- complex. In the fingerprint region, the calculated spectra of cis/trans
QnH22+:HSO4- have some transitions in common with CdH22+:HSO4-. Most of the differences
between QnH22+:HSO4- and CdH22+:HSO4- are due to modes localized on the methoxy substituent.
The ν(CO) stretch of the OCH3 is calculated between ~ 1110 cm-1 and ~ 1220 cm-1, with a weak
intensity. It is higher in energy and has larger intensity in the trans forms. No particularly intense band stands out in the cis conformers. A very intense β(CaromH) bend is calculated at ~ 1300 cm-1 -
1330 cm-1 for all the trans conformers of QnH22+, becoming the most intense in the fingerprint
region. The absence of intense transition in the ~ 1400 cm-1 region of the experimental spectrum and the presence of bands above 1650 cm-1 allows discarding the trans conformers.
The results obtained in the high-frequency region parallel those obtained for cinchonidine. The spectrum of the Closed cis geometries shows better correspondence with the experimental data than those of the Open cis geometries. Moreover, the cis conformers are more stable than the trans. Cis-Syn-γ-closed, Cis-Syn-γ-closed’ and Cis-Anti-γ-closed show good correspondence with the experiment. It is therefore likely that the observed spectrum contains contributions of these three cis Closed forms, whose relative Gibbs energy (1.0-1.5 kcal/mol) is of the order of the expected calculation error. The preference for cis forms results parallel those observed for similar systems like neutral 2-methoxynaphthalene 77, Naproxene, 98, 99 or neutral quinine and hydroquinine. 68, 97
No difference is experimentally observed between the complexes Qn and Qd, as it was already the case for the protonated monomers.56 Qn and Qd therefore behave like true enantiomers in this context.
2. Photodissociation
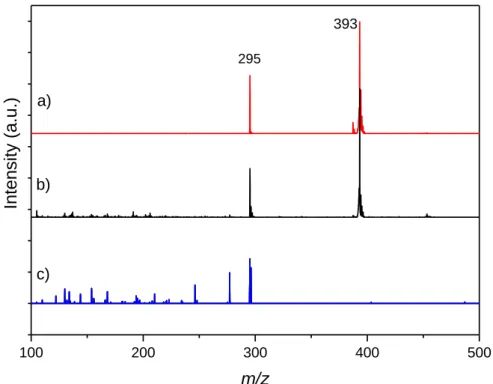
2.1. Experimental results
The mass spectrum resulting from the photodissociation of CdH2+HSO4- at 266 nm is shown
in Figure 10, as well as its CID spectrum. The conditions (collision voltage or UV power) have been adjusted so that the total fragmentation yield is the same for the two spectra, namely, 0.33, which allows better comparison between them. The UVPD spectrum is noisier because light scattered from the laser may create stray ions, but the two spectra show identical fragmentation
14
pattern, with the major fragment being the protonated monomer. In contrast with CdH+ itself, the
CdH22+:HSO4- complex (m/z 393) does not show any specific UVPD photo-fragment, and the same
behavior is observed for Qn or Qd. Figure 10 also shows the CID spectrum of CdH+ (m/z 295)
produced by UV irradiation of the complex. The fragmentation pattern is the same as observed for CdH+ formed in the ESI, with the main channels being water loss (m/z 277) or loss of water and methylamine (m/z 246). The fragmentation efficiency for a given radiofrequency amplitude is of the same order as that of CdH+ formed in the ESI.54
2.2. Excited states calculations
Vertical excitation energies and nature of the first three excited states: The energies of the first three vertical electronic transitions of Syn-γ-closed’ are listed in Table 7. We have limited the table to the transitions below the energy of the UV laser (4.66 eV). Table 7 also includes the doubly protonated monomer CdH22+for the sake of comparison. However, this doubly charged species is
not stable in the gas phase and was not observed in our experimental conditions. Therefore, its PES was not fully explored. The structure of isolated CdH22+ presented in the table is a local minimum
obtained by optimizing the geometry of CdH22+, starting from the geometry contained in the
CdH22+:HSO4- Syn-γ-closed’ complex. Finally, the table includes the results for the corresponding
monomers protonated on Nalk or CdNaromH+, the corresponding monomer protonated on Narom, in
the same geometry as contained in the complex. In short, the systems will be denoted by CdH22+:HSO4-, CdH22+, CdH+, and CdNaromH+ in what follows. Figure 11 shows the difference
between the electronic density of the ground state and that of the first three excited states of CdH+, CdNaromH+, CdH22+ and CdH22+:HSO4-. In the discussion that follows, the canonical occupied HF
orbitals delocalized all over the two aromatic rings will be denoted by arom and the unoccupied one
by *arom, while the occupied orbitals localized on the aza C6 ring or carbonaceous C6 ring will be
denoted by aromN or aromC, respectively. Similarly, the unoccupied ones will be denoted by *aromN
or *aromC respectively. The Nakl and Narom lone pairs will be denoted by nNalk and nNarom,
respectively. Finally, the canonical HF orbitals localized on the alkaloid C=C group will be denoted by CC or *CC, respectively.
The three lower-energy transitions of CdH+ involve aromatic π electrons as well as the lone
pair located on Narom, as suggested for quinoline (Figure 11a).100 The S10 transition mainly
involves HOMO-4 (mostly Narom lone pair) → LUMO (π*arom) (68%) and HOMO-3 (mixed Narom
lone pair and πarom) → LUMO (24 %) excitations. It is therefore an intramolecular charge transfer
15
transitions are ππ* transitions localized on the aromatic ring. They involve the very same orbitals HOMO-1(πarom)→ LUMO (64%) and HOMO (πarom) → LUMO+1 (π*arom) (30%) for S20 and
HOMO-1 →LUMO (85%) for S30 as the so-called Lb and La electronic transitions of naphthalene
derivatives.10110268
In CdNaromH+, (Figure 11b), the S10 transition mainly involves HOMO (mostly nNalk) →
LUMO (mostly π*arom) (40%) and HOMO-1 (nNalk and πaromC) → LUMO (37 %) excitations. The
S10 transition is therefore mainly an intramolecular charge transfer from nNalk to π*arom, i.e.a
nalk*arom CT transition. The S20 transition is mainly a naphthalene-like πaromπ*arom transition that
involves HOMO-2 (πarom) → LUMO (54%) and HOMO-1 → LUMO (31%) excitations. Finally,
the S30 transition involves HOMO-1 → LUMO+1 (π*arom) (44%) and HOMO → LUMO+1 (35%)
excitations, it is mainly a naphthalene-like πaromπ*arom transition.
For CdH22+, (Figure 11c), both nitrogen atoms are protonated and there is no possibility for
CT nπ* transitions involving a nitrogen lone pair. The S10 and S20 transitions are of ππ* character.
S10 corresponds to the HOMO-1 (πaromC) → LUMO (π*arom) (94%) excitation, while S20
corresponds to HOMO-2 (πarom) → LUMO (72%) and HOMO-1→LUMO+1 (πarom) (26%),
respectively. Interestingly, the S30 transition corresponds to an intramolecular charge-transfer from
the alkaloid C=C to the aromatic ring. Indeed, it is a HOMO → LUMO transition (95%) with the HOMO orbital being the π C=C orbital of the C=C double bond.
In the CdH22+:HSO4- complex also, both nitrogen atoms of CdH22+ are protonated and there
is no possibility for intramolecular CT involving a nitrogen lone pair (Figure 11d). The presence of HSO4- completely modifies the nature of the S10 transition compared to CdH22+. At equilibrium
distance, the charge transfer transition involving the C=C orbital is out of the manifold of the
transitions reached by the UV laser. The C=C orbital corresponds to the HOMO and is involved in
none of the first five electronic transitions, and only marginally in S60, which is higher in energy
(5.23 eV) than the laser energy. S10 now corresponds to HOMO-3 → LUMO excitation (93%),
with the HOMO-3 being mainly described in terms of combination of the lone pairs nO of the oxygen
atoms of the three S=O groups of HSO4-, and the LUMO being a *aromN orbital. The S10 transition
can therefore be described in terms of a nO*aromN intermolecular CT from the bisulfate to CdH22+.
The S20 and S30 transitions correspond to HOMO-1(aromC) → LUMO (81%) and to HOMO-2
16
Modification of the electronic transitions when elongating the NH bonds:
Based on calculations of the excited states at the same level as in this work, it was proposed previously that the photoreactivity of the closed forms of CdH+ arises from proton transfer from N
alk
to Narom. The CdNaromH+ formed thereby undergoes electron transfer from the C=C group of the
alkaloid to Narom, resulting to the formation of specific photofragments.53 This was confirmed by the
experimental finding that in a similar system, hydroquinine, in which the CC bond is saturated, there is no formation of photofragments.53 Elongating the NaromH+ bond in CdNaromH+ lowers the
charge-transfer transition that plays a major role in the reactivity of the cinchona alkaloids, like the charge transfer involving CO in tyrosine containing peptides.3853 We have therefore calculated the change in electron density for the first three electronic transitions of CdH22+ and CdH22+:HSO4-, when
elongating either the NalkH or the NaromH distances. The density difference between the ground state
and the first three excited states of the complex is compared to that in CdH22+in Figure 12. In
CdH22+, the S10 transition for the NalkH+ bond modified from its equilibrium distance (1.023 Å) to
2.000 Å is an intramolecular charge transfer within the alkaloid part of the molecule. It is mostly a HOMO (C=C) → LUMO (*NalkH+) (96%) transition. It is therefore a CT transition from the C=C
orbital to the *NalkH+ orbital.53 For the NaromH+ bond elongated from its equilibrium distance (1.018
Å) to 2.000 Å the S10 and S20 are HOMO-1 (arom) → LUMO (*NaromH+) (96%) and HOMO-2
(arom) → LUMO (*NaromH+) (98%) transitions. However, the S30 transition is a HOMO (C=C) →
LUMO (97%) transition, i.e. a charge transfer from the C=C group localized on the alcaloid. In both cases, one of the first three electronic transitions, namely, S10 when elongating the NalkH+ bondor
S30, when elongating the NaromH+ bond involves charge migration from the C=C orbital to the
*NH+.
The CdH22+:HSO4- complex behaves differently from CdH22+. Elongating the NalkH+ bond from its
equilibrium distance is prevented by the cage effect due to the presence of HSO4-. Elongating the
NaromH bond from its equilibrium value (1.017Å) to 2.000 Å has two consequences. Compared to
CdH22+, it modifies the energy order of the transition. For an identical NaromH distance, of 2.000 Å,
S20 and S30 in the complex are similar to S20 and S10 in CdH22+, respectively in terms of
excitations type and then electron density changes. S10 in the complex is the HOMO-3 → LUMO
excitation (90%), with the HOMO-3 being mainly described in terms of combination of the nO of
the three S=O groups of HSO4-, and the LUMO being the NaromH+ orbital. It corresponds therefore
to an intermolecular CT transition.
We can conclude from these results that the bisulfate anion has a protective effect and prevents photodissociation of the CdH22+:HSO4- complex in two manners. Firstly, the fact that the two
17
nitrogen atoms, Nalk and Narom, are protonated prevents proton transfer from Nalk to Narom. Moreover,
the short hydrogen bond between the bisulfate and Nalk induces a cage effect that prevents motions
of the NalkH+. The second effect of the complex formation is that the CT transitions from the C=C
orbital of the alkaloid part of the molecule to the *NalkH+ or NaromH+ orbital are removed from the
manifold accessible by the laser. Instead, the first three Sn0 transition involve ππ* excitations and
then electron density changes within the quinoline ring, or charge migration from the bisulfate anion to the aza C6 ring, or to the *NaromH+.
Conclusion
This study unambiguously shows that the complexes formed between protonated cinchonidine and sulfuric acid actually contains doubly protonated cinchonidine CdH22+ and the
bisulfate anion, HSO4-. The cinchona alkaloid is therefore protonated on both nitrogens, the alkaloid
nitrogen Nalk and the aromatic nitrogen Narom. HSO4- bridges the two protonation sites so that
electrostatic interactions between CdH22+ and HSO4- stabilize the doubly protonated species in the
gas phase. The same structure as for cinchonidine is observed for quinine and quinidine. No chirality effect is observed in the structure of the complex.
The presence of bisulfate has several consequences on the photophysics of protonated cinchonidine. First, the cinchonidine contained in the complex is doubly protonated, so that the transitions involving the Nalk or Narom lone pair are removed from the manifold. The presence of
HSO4- also has a protective role towards photo-dissociation. It first prevents the mobility of the
proton localized on Nalk thanks to the strong electrostatic interaction. Such a cage effect has already
been observed in tryptamine, tryptophan, or cinchonidine itself, embedded in cyclodextrine.53, 103, 104 This explains why the reactivity related to proton mobility, previously proposed for isolated
CdH+, is not observed here.53 The second role of the bisulfate is to modify the nature of the electronic transitions. In particular, the CT transitions from C=C orbital to *NalkH+ or *NaromH+, which has
been supposed to play a role in the photodissociation of CdH+, is higher than the laser energy in the complex.53 This study emphasizes the role of counterions in protecting biomolecules from photodissociation. The influence of complexation by sulfuric acid on the protonated cinchona alkaloid dimers is currently in progress and will be reported in a near future.
Acknowledgment
We thank Dr J. M. Ortega and the CLIO team for technical assistance. We acknowledge the use of the computing center MésoLUM of the LUMAT research federation (FR LUMAT 2764).
18
The research described here has been supported by the Investissements d’Avenir LabEx PALM contract (ANR-10-LABX-0039-PALM), by the ANR contract (ESBODYR ANR-14-CE06-0019-03), and by the RTRA “Triangle de la Physique” contract (Project N°2013-0562-T, Chiraux IRUV). We thank Fabrice Gobert for experimental help. FB gratefully acknowledges the support of COST Action CM1405 (MOLIM).
References
1. M. Ichihashi, M. Ueda, A. Budiyanto, T. Bito, M. Oka, M. Fukunaga, K. Tsuru and T. Horikawa,
Toxicology, 2003, 189, 21-39.
2. J. Cadet, E. Sage and T. Douki, Mutation Research-Fundamental and Molecular Mechanisms of
Mutagenesis, 2005, 571, 3-17.
3. R. P. Sinha and D. P. Hader, Photochemical & Photobiological Sciences, 2002, 1, 225-236. 4. H. H. Tonnesen, International Journal of Pharmaceutics, 2001, 225, 1-14.
5. G. Cosa, K. S. Focsaneanu, J. R. N. McLean, J. P. McNamee and J. C. Scaiano, Photochemistry and
Photobiology, 2001, 73, 585-599.
6. J. M. L. Pecourt, J. Peon and B. Kohler, Journal of the American Chemical Society, 2001, 123, 10370-10378.
7. C. E. Crespo-Hernandez, B. Cohen, P. M. Hare and B. Kohler, Chemical Reviews, 2004, 104, 1977-2019.
8. C. T. Middleton, K. de La Harpe, C. Su, Y. K. Law, C. E. Crespo-Hernandez and B. Kohler, in Annu.
Rev. Phys. Chem., 2009, vol. 60, pp. 217-239.
9. D. Onidas, D. Markovitsi, S. Marguet, A. Sharonov and T. Gustavsson, Journal of Physical Chemistry
B, 2002, 106, 11367-11374.
10. T. Gustavsson, A. Banyasz, E. Lazzarotto, D. Markovitsi, G. Scalmani, M. J. Frisch, V. Barone and R. Improta, Journal of the American Chemical Society, 2006, 128, 607-619.
11. C. Canuel, M. Mons, F. Piuzzi, B. Tardivel, I. Dimicoli and M. Elhanine, Journal of Chemical Physics, 2005, 122.
12. S. Ullrich, T. Schultz, M. Z. Zgierski and A. Stolow, Physical Chemistry Chemical Physics, 2004, 6, 2796-2801.
13. H. Kang, K. T. Lee, B. Jung, Y. J. Ko and S. K. Kim, Journal of the American Chemical Society, 2002, 124, 12958-12959.
14. B. Lucas, M. Barat, J. A. Fayeton, M. Perot, C. Jouvet, G. Gregoire and S. B. Nielsen, Journal of
Chemical Physics, 2008, 128, 164302.
15. L. Joly, R. Antoine, M. Broyer, P. Dugourd and J. Lemoine, Journal of Mass Spectrometry, 2007, 42, 818-824.
16. J. P. Reilly, Mass Spectrometry Reviews, 2009, 28, 425-447.
17. J. P. O'Brien and J. S. Brodbelt, Analytical Chemistry, 2013, 85, 10399-10407. 18. C. Y. Lin and R. C. Dunbar, Journal of Physical Chemistry, 1995, 99, 1754-1759.
19. Z. Q. Guan, N. L. Kelleher, P. B. Oconnor, D. J. Aaserud, D. P. Little and F. W. McLafferty,
International Journal of Mass Spectrometry and Ion Processes, 1996, 157, 357-364.
20. J. H. Moon, Y. S. Shin, H. J. Cha and M. S. Kim, Rapid Communications in Mass Spectrometry, 2007, 21, 359-368.
21. N. C. Polfer, Chem. Soc. Rev., 2011, 40, 2211-2221.
22. A. M. Rijs and J. Oomens, eds., Gas-Phase IR Spectroscopy and Structure of Biological Molecules, Springer International Publishing, 2015.
19 23. I. Alata, J. Bert, M. Broquier, C. Dedonder, G. Feraud, G. Gregoire, S. Soorkia, E. Marceca and C.
Jouvet, Journal of Physical Chemistry A, 2013, 117, 4420-4427.
24. I. Alata, M. Broquier, C. Dedonder, C. Jouvet and E. Marceca, Chemical Physics, 2012, 393, 25-31. 25. S. Daly, M. Krstic, A. Giuliani, R. Antoine, L. Nahon, A. Zavras, G. N. Khairallah, V.
Bonacic-Koutecky, P. Dugourd and R. A. J. O'Hair, Physical Chemistry Chemical Physics, 2015, 17, 25772-25777.
26. J. A. Madsen, D. R. Boutz and J. S. Brodbelt, Journal of Proteome Research, 2010, 9, 4205-4214. 27. L. Joly, R. Antoine, A. R. Allouche and P. Dugourd, Journal of the American Chemical Society, 2008,
130, 13832-13833.
28. F. O. Talbot, T. Tabarin, R. Antoine, M. Broyer and P. Dugourd, Journal of Chemical Physics, 2005, 122.
29. C. S. Hansen, S. J. Blanksby, N. Chalyavi, E. J. Bieske, J. R. Reimers and A. J. Trevitt, Journal of
Chemical Physics, 2015, 142.
30. C. S. Hansen, S. J. Blanksby and A. J. Trevitt, Phys. Chem. Chem. Phys., 2015, DOI: DOI: 10.1039/C5CP02035B.
31. K. Ranka, N. Zhao, L. Yu, J. F. Stanton and N. C. Polfer, Journal of the American Society for Mass
Spectrometry, 2018, 29, 1791-1801.
32. Y. Inokuchi, R. Kusaka, T. Ebata, O. V. Boyarkin and T. R. Rizzo, Chemphyschem, 2013, 14, 649-660. 33. T. N. Wassermann, O. V. Boyarkin, B. Paizs and T. R. Rizzo, Journal of the American Society for
Mass Spectrometry, 2012, 23, 1029-1045.
34. A. Kamariotis, O. V. Boyarkin, S. R. Mercier, R. D. Beck, M. F. Bush, E. R. Williams and T. R. Rizzo,
Journal of the American Chemical Society, 2006, 128, 905-916.
35. G. Feraud, M. Broquier, C. Dedonder, C. Jouvet, G. Gregoire and S. Soorkia, The Journal of Physical
Chemistry A, 2015, 119, 5914-5924.
36. H. Kang, G. Feraud, C. Dedonder-Lardeux and C. Jouvet, Journal of Physical Chemistry Letters, 2014, 5, 2760-2764.
37. G. Feraud, M. Broquier, C. Dedonder-Lardeux, G. Gregoire, S. Soorkia and C. Jouvet, Physical
Chemistry Chemical Physics, 2014, 16, 5250-5259.
38. C. Dehon, S. Soorkia, M. Pedrazzani, C. Jouvet, M. Barat, J. A. Fayeton and B. Lucas, Physical
Chemistry Chemical Physics, 2013, 15, 8779-8788.
39. A. B. Wolk, C. M. Leavitt, E. Garand and M. A. Johnson, Accounts of Chemical Research, 2014, 47, 202-210.
40. C. M. Choi, D. H. Choi, N. J. Kim and J. Heo, International Journal of Mass Spectrometry, 2012, 314, 18-21.
41. G. A. Pino, G. Feraud, M. Broquier, G. Gregoire, S. Soorkia, C. Dedonder and C. Jouvet, Physical
Chemistry Chemical Physics, 2016, 18, 20126-20134.
42. M. Broquier, S. Soorkia, C. Dedonder-Lardeux, C. Jouvet, P. Theule and G. Gregoire, Journal of
Physical Chemistry A, 2016, 120, 3797-3809.
43. M. Lammerhofer and W. Lindner, Journal of Chromatography A, 1996, 741, 33-48.
44. O. J. Sonderegger, G. M. W. Ho, T. Burgi and A. Baiker, Journal of Catalysis, 2005, 230, 499-506. 45. C. E. Song, Cinchona Alkaloids in Synthesis and Catalysis, Wiley-VCH, Weinheim, 2009.
46. T. Burgi and A. Baiker, Accounts of Chemical Research, 2004, 37, 909-917.
47. J. Wang, L. D. Heikkinen, H. Li, L. S. Zu, W. Jiang, H. X. Xie and W. Wang, Advanced Synthesis &
Catalysis, 2007, 349, 1052-1056.
48. A. Adili, Z. L. Tao, D. F. Chen and Z. Y. Han, Organic & Biomolecular Chemistry, 2015, 13, 2247-2250.
49. B. L. Diffey, P. M. Farr and S. J. Adams, British Journal of Dermatology, 1988, 118, 679-685. 50. W. W. Qin, A. Vozza and A. M. Brouwer, Journal of Physical Chemistry C, 2009, 113, 11790-11795. 51. J. Qian and A. M. Brouwer, Physical Chemistry Chemical Physics, 2010, 12, 12562-12569.
52. W. H. Melhuish, Journal of Physical Chemistry, 1961, 65, 229-&.
53. S. Kumar, B. Lucas, J. Fayeton, D. Scuderi, I. Alata, M. Broquier, K. Le Barbu-Debus, V. Lepere and A. Zehnacker, Physical Chemistry Chemical Physics, 2016, 18, 22668-22677.
20 54. I. Alata, D. Scuderi, V. Lepere, V. Steinmetz, F. Gobert, L. Thiao-Layel, K. Le Barbu-Debus and A.
Zehnacker-Rentien, Journal of Physical Chemistry A, 2015, 119, 10007-10015. 55. A. Zehnacker, International Reviews in Physical Chemistry, 2014, 33, 151-207.
56. D. Scuderi, K. Le Barbu-Debus and A. Zehnacker, Physical Chemistry Chemical Physics, 2011, 13, 17916-17929.
57. D. Scuderi, P. Maitre, F. Rondino, K. Le Barbu-Debus, V. Lepere and A. Zehnacker-Rentien, Journal
of Physical Chemistry A, 2010, 114, 3306-3312.
58. D. Scuderi, V. Lepere, G. Piani, A. Bouchet and A. Zehnacker-Rentien, Journal of Physical Chemistry
Letters, 2014, 5, 56.
59. P. E. Hintze, H. G. Kjaergaard, V. Vaida and J. B. Burkholder, Journal of Physical Chemistry A, 2003, 107, 1112-1118.
60. P. E. Hintze, K. J. Feierabend, D. K. Havey and V. Vaida, Spectrochimica Acta Part a-Molecular and
Biomolecular Spectroscopy, 2005, 61, 559-566.
61. M. Rozenberg, A. Loewenschuss and C. J. Nielsen, Journal of Physical Chemistry A, 2011, 115, 5759-5766.
62. L. Mac Aleese, A. Simon, T. B. McMahon, J.-M. Ortega, D. Scuderi, J. Lemaire and P. Maître,
International Journal of Mass Spectrometry, 2006, 249-250, 14-20.
63. J. B. Fenn, M. Mann, C. K. Meng, S. F. Wong and C. M. Whitehouse, Science. 1989 Oct
6;246(4926):64-71., 1989.
64. R. Prazeres, J. M. Berset, F. Glotin, D. Jaroszynski and J. M. Ortega, Nuclear Instruments &
Methods in Physics Research Section a-Accelerators Spectrometers Detectors and Associated Equipment, 1993, 331, 15-19.
65. MacroModel version 9.8; ed. Schrödinger, LLC: New York, NY, 2010, 2010.
66. E. Harder, W. Damm, J. Maple, C. Wu, M. Reboul, J. Y. Xiang, L. Wang, D. Lupyan, M. K. Dahlgren, J. L. Knight, J. W. Kaus, D. S. Cerutti, G. Krilov, W. L. Jorgensen, R. Abel and R. A. Friesner, Journal
of Chemical Theory and Computation, 2016, 12, 281-296.
67. H. T. A., Journal of Computational Chemistry, 1999, 20, 720-729.
68. A. Sen, A. Bouchet, V. Lepere, K. Le Barbu-Debus, D. Scuderi, F. Piuzzi and A. Zehnacker-Rentien,
The Journal of Physical Chemistry. A, 2012, 116, 8334-8344.
69. L. Goerigk and S. Grimme, Physical Chemistry Chemical Physics, 2011, 13, 6670-6688. 70. S. Grimme, J. Antony, S. Ehrlich and H. Krieg, Journal of Chemical Physics, 2010, 132. 71. A. D. Becke, Physical Review A, 1988, 38, 3098-3100.
72. M. D. Halls, J. Velkovski and H. B. Schlegel, Theoretical Chemistry Accounts, 2001, 105, 413. 73. M. J. Frisch, J. A. Pople and J. S. Binkley, Journal of Chemical Physics, 1984, 80, 3265-3269. 74. S. Grimme, S. Ehrlich and L. Goerigk, Journal of Computational Chemistry, 2011, 32, 1456-1465. 75. J. Altnoeder, A. Bouchet, J. J. Lee, K. E. Otto, M. A. Suhm and A. Zehnacker-Rentien, Physical
Chemistry Chemical Physics, 2013, 15, 10167-10180.
76. S. Boys and F. Bernardi, Mol. Phys., 1970, 19, 553.
77. T. Troxler, B. A. Pryor and M. R. Topp, Chem. Phys. Lett., 1997, 274, 71-78.
78. M. J. Frisch, G. W. Trucks, H. B. Schlegel, G. E. Scuseria, M. A. Robb, J. R. Cheeseman, J. A.
Montgomery, T. V. Jr., K. N. Kudin, J. C. Burant, J. M. Millam, S. S. Iyengar, J. Tomasi, V. Barone, B. Mennucci, M. Cossi, G. Scalmani, N. Rega, G. A. Petersson, H. Nakatsuji, M. Hada, M. Ehara, K. Toyota, R. Fukuda, J. Hasegawa, M. Ishida, T. Nakajima, Y. Honda, O. Kitao, H. Nakai, M. Klene, X. Li, J. E. Knox, H. P. Hratchian, J. B. Cross, V. Bakken, C. Adamo, J. Jaramillo, R. Gomperts, R. E. Stratmann, O. Yazyev, A. J. Austin, R. Cammi, C. Pomelli, J. W. Ochterski, P. Y. Ayala, K. Morokuma, G. A. Voth, P. Salvador, J. J. Dannenberg, V. G. Zakrzewski, S. Dapprich, A. D. Daniels, M. C. Strain, O. Farkas, D. K. Malick, A. D. Rabuck, K. Raghavachari, J. B. Foresman, J. V. Ortiz, Q. Cui, A. G. Baboul, S. Clifford, J. Cioslowski, B. B. Stefanov, G. Liu, A. Liashenko, P. Piskorz, I. Komaromi, R. L. Martin, D. J. Fox, T. Keith, M. A. Al-Laham, C. Y. Peng, A. Nanayakkara, M. Challacombe, P. M. W. Gill, B. Johnson, W. Chen, M. W. Wong, C. Gonzalez and J. A. Pople, Journal, 2004.
79. A. R. Allouche, Journal of Computational Chemistry, 2011, 32, 174.
21 81. F. Weigend and M. Haser, Theoretical Chemistry Accounts, 1997, 97, 331-340.
82. T. H. Dunning, Journal of Chemical Physics, 1989, 90, 1007-1023.
83. R. L. Garcia, N. Nieuwjaer, C. Desfrancois, F. Lecomte, S. D. Leite, B. Manil, M. Broquier and G. Gregoire, Physical Chemistry Chemical Physics, 2017, 19, 8258-8268.
84. R. Ahlrichs, M. Bar, M. Haser, H. Horn and C. Kolmel, Chemical Physics Letters 1989, 162, 165-169. 85. W. Humphrey, A. Dalke and K. Schulten, J. Molec. Graphics, 1996, 14, 33-38.
86. A. Givan, L. A. Larsen, A. Loewenschuss and C. J. Nielsen, Journal of Molecular Structure, 1999, 509, 35-47.
87. http://cccbdb.nist.gov/vibscalejust.asp).
88. R. Paciotti, C. Coletti, N. Re, D. Scuderi, B. Chiavarino, S. Fornarini and M. E. Crestoni, Physical
Chemistry Chemical Physics, 2015, 17, 25891-25904.
89. L. Barnes, B. Schindler, A. R. Allouche, D. Simon, S. Chambert, J. Oomens and I. Compagnon,
Physical Chemistry Chemical Physics, 2015, 17, 25705-25713.
90. T. I. Yacovitch, T. Wende, L. Jiang, N. Heine, G. Meijer, D. M. Neumark and K. R. Asmis, Journal of
Physical Chemistry Letters, 2011, 2, 2135-2140.
91. J. J. Max, C. Menichelli and C. Chapados, Journal of Physical Chemistry A, 2000, 104, 2845-2858. 92. C. Menichelli, J. J. Max and C. Chapados, Canadian Journal of Chemistry-Revue Canadienne De
Chimie, 2000, 78, 1128-1142.
93. K. L. Nash, K. J. Sully and A. B. Horn, Physical Chemistry Chemical Physics, 2000, 2, 4933-4940. 94. A. Urakawa, D. M. Meier, H. Rugger and A. Baiker, Journal of Physical Chemistry A, 2008, 112,
7250-7255.
95. T. Burgi and A. Baiker, Journal of the American Chemical Society, 1998, 120, 12920-12926. 96. H. Caner, P. U. Biedermann and I. Agranat, Chirality, 2003, 15, 637-645.
97. A. Sen, V. Lepere, K. Le Barbu-Debus and A. Zehnacker, Chemphyschem : a European Journal of
Chemical Physics and Physical Chemistry, 2013, 14, 3559-3568.
98. F. Lahmani, K. Le Barbu-Debus, N. Seurre and A. Zehnacker-Rentien, Chem. Phys. Lett., 2003, 375, 636-644.
99. L. Alvarez-Valtierra, J. W. Young and D. W. Pratt, Chem. Phys. Lett., 2011, 509, 96-101.
100. A. Hiraya, Y. Achiba, K. Kimura and E. C. Lim, Journal of Chemical Physics, 1984, 81, 3345-3347. 101. S. M. Beck, D. E. Powers, J. B. Hopkins and R. E. Smalley, Journal of Chemical Physics, 1980, 73,
2019.
102. F. Lahmani, E. Breheret, A. Zehnackerrentien and T. Ebata, Journal of the Chemical
Society-Faraday Transactions, 1993, 89, 623-629.
103. A. Fujihara, T. Sato and S. Hayakawa, Chem. Phys. Lett., 2014, 610, 228-233.
104. U. Kadhane, M. Perot, B. Lucas, M. Barat, J. A. Fayeton, C. Jouvet, A. Ehlerding, M. B. S. Kirketerp, S. B. Nielsen, J. A. Wyer and H. Zettergren, Chem. Phys. Lett., 2009, 480, 57-61.
22 Figures and Tables
Table1: Significant calculated dihedral angles (°) and distances (Å) of the most stable conformers
of the CdH+H2SO4 complex optimized at the B3LYP-D3/6-31++G(d,p) level. Dihedral angles (°)
and distances (Å)
Anti-γ-open Anti-γ-open’ Anti-γ-closed Anti-γ-closed’
τ1 (C3’C4’ C9 C8) 100 109 68 70 τ2 (C4’ C9 C8 Nalk) 168 164 44 54 τ3 (N C8 C9 O) -69 -71 165 175 T3 (C8 C9 O H) -179 172 172 179 dNalkHδ+…δ-OS 1.88 1.88 1.84 1.87 dNarom…HOS 7.14 5.47 1.58 3.38
Table 2: Significant calculated dihedral angles (°) and distances (Å) of the most stable conformers
of the CdH2+HSO4- complex optimized at the B3LYP-D3/6-31++G(d,p) level. Dihedral
angles (°) and distances (Å)
Syn-γ-closed Syn-γ-closed’ Anti-γ-closed Anti-β-open Syn-γ-open
τ1 (C3’C4’C9 C8) -108 -107 68 100 -83 τ2(C4’C9C8 Nalk) 72 47 58 165 161 τ3 (N C8 C9 O) -165 171 177 -71 -73 T3 (C8 C9 O H) 172 165 169 108 149 dNalkH+δ…-δOS 1.64 1.62 1.6 1.57 1.58 dNaromH+δ…-δOS 2.76 2.35 2.66 7.03 6.17
23
Table 3: Calculated relative electronic energy ΔE and Gibbs free energy ΔG including counterpoise correction, for CdH+H2SO4 and CdH22+HSO4- at the B3LYP-D3/
6-31++G (d,p) level of theory. Counterpoise correction to the energy BSSE. Natural charges on significant atoms q. The notation used for for CdH+ and CdH2+ is taken
24 Molecules ΔE (kcal/mol) with counterpoise correction ΔG (kcal/mol) with counterpoise correction BSSE (kcal/mol) q(O) (…NalkH+) q(O) (… Narom+) q(O) (free) q(H) (NalkH+) q(H) (NaromH+) q(S) q(H) (SOH) q(O) (SOH) H2SO4 - - - -0.90 - - 2.53 0.53 -0.90 CdH+ Anti γ-closed - - - - - - 0.48 - - - - CdH+H 2SO4 Anti γ-open 17.5 14.5 2.2 -0.96 - -0.88 0.49 - 2.57 0.55 0.55 -0.90 -0.90 Anti γ-open’ 16.7 16.2 2.3 -0.94 - -0.91 0.49 - 2.56 0.55 0.55 -0.89 -0.88 Anti γ-closed 8.0 7.5 3.0 -0.89 - -1.01 0.51 - 2.59 0.54 0.53 -0.91 -0.92 Anti γ-closed’ 14.2 13.2 2.6 -0.94 - -0.91 0.50 - 2.57 0.55 0.54 -0.89 -0.90 HSO4 -- - - - -1.02 -1.02 -1.00 - - 2.53 0.49 -0.97 CdH22+ Anti-γ-closed - - - - - 0.47 0.48 - - - CdH22+HSO4 -Anti-β-open 3.0 2.2 2.6 -1.01 - -0.98 -1.03 * 0.51 0.46 2.56 0.53 -0.90
25
Syn-γ-open 5.0 4.8 2.3 -1.01 - -1.03 * 0.51 0.46 2.56 0.53 -0.90
Syn-γ-closed’ 0.1 0.0 2.7 -1.04 -0.99 -0.92 0.51 0.49 2.56 0.53 -0.92
Anti-γ-closed 0.5 0.4 2.7 -1.03 -0.99 -0.92 0.51 0.48 2.56 0.53 -0.92
Syn-γ-closed 0.0 0.2 2.7 -1.02 -0.99 -1.02 0.51 0.47 2.56 0.53 -0.92
26 Table 4: Significant calculated dihedral angles (°) and distances (Å) of the most stable
conformers of the Cis QnH22+HSO4- complex optimized at the B3LYP-D3/6-31++G(d,p) level
of theory.
Dihedral angles (°) and
distances (Å)
Cis-Anti-β-open Cis-Syn-γ-open Cis-Syn-γ-closed Cis-Syn-γ-closed’ Cis-Anti-γ-closed
τ1 (C3’ C4’ C9 C8) 98 -85 -110 -107 74 τ2 (C4’ C9C8Nalk) 162 160 59 47 60 τ3 (N C8 C9 O) -74 -73 -178 171 -180 T3 (C8 C9 O H) 111 151 171 165 170 dNalkH+δ…-δOS 1.6 1.58 1.62 1.62 1.64 dNaromH+δ…-δOS 7.17 6.19 2.51 2.34 2.51
27 Table 5: Significant calculated dihedral angles (°) and distances (Å) of the most stable
conformers of the Trans QnH22+HSO4- complex optimized at the B3LYP-D3/6-31++G(d,p)
level of theory.
Dihedral angles (°) and
distances (Å)
Trans-Anti-β-open Trans-Syn-γ-open Trans-Syn-γ-closed Trans-Syn-γ-closed’ Trans-Anti-γ-closed
τ1 (C3’ C4’ C9 C8) 103 -87 -109 -108 76 τ2 (C4’ C9 C8Nalk) 166 160 57 46 60 τ3 (N C8 C9 O) -71 -74 -180 170 180 T3 (C8 C9 O H) 106 153 171 166 169 dNalkH+δ…-δOS 1.57 1.58 1.62 1.63 1.67 dNaromH+δ…-δOS 7.08 6.16 2.49 2.34 2.5
28 Table 6: Calculated relative electronic energy ΔE and Gibbs free energy ΔG including counterpoise correction, for the most stable conformers of QnH22+HSO4- at the B3LYP-D3/ 6-31++G (d,p) level of theory. Counterpoise correction to the energy BSSE.
Complex [QnH2+HSO4-] ΔE (kcal/mol) with counterpoise correction ΔG (kcal/mol) with counterpoise correction BSSE (kcal/mol) Cis-Anti-β-open 0.4 0.0 2.7 Cis-Syn-γ-open 5.9 5.0 2.3 Cis-Syn-γ-closed 0.0 0.6 3.0 Cis-Syn-γ-closed’ 1.1 0.8 2.7 Cis-Anti-γ-closed 1.5 0.9 2.9 Trans-Anti-β-open 5.4 4 2.6 Trans-Syn-γ-open 7.1 5.9 2.3 Trans-Syn-γ-closed 1.2 1.7 2.9 Trans-Syn-γ-closed’ 1.9 1.5 2.7 Trans-Anti-γ-closed 1.4 1.2 2.9
29 Table 7: Energy E0-1,2,3 (eV) of the first three vertical transitions S1,2,30 of the protonated monomer CdH+, of the di-protonated monomer CdH2+
(see text), and of the CdH2+HSO4- complex to which the experimental spectra has been assigned, all in the Syn-γ-closed conformation. The transition
energy is given relative to the ground state of the corresponding system. Only the transitions below the laser energy (4.66 eV) are considered.
Protonated system E0-1 Orbitals involved in S10 E0-2 Orbitals involved in S20 E0-3 Orbitals involved in S30
CdH+ 4.24 HOMO-4 →LUMO (68%) HOMO-3 →LUMO (24 %) 4.36 HOMO-1→LUMO (64%) HOMO→LUMO+1 (30%) 4.69 HOMO-1→LUMO (85%) Cd NaromH+ 2.48 HOMO→LUMO (40%) HOMO-1→LUMO (39%) HOMO-2 →LUMO (15%) 3.98 HOMO-2→LUMO (54%) HOMO-1→LUMO (31%) 4.09 HOMO→LUMO+1 (44%) HOMO-1→LUMO+1 (35%) CdH2+ 3.85 HOMO-1→LUMO (94%) 4.29 HOMO-2→LUMO (72%) HOMO-1→LUMO+1 (26%) 4.63 HOMO→LUMO (95%)
CdH2+HSO4- 3.80 HOMO-3→LUMO (93%) 4.09 HOMO-1→LUMO (81%) 4.17 HOMO-2 →LUMO (61%)
30
Figure 1: Structure of the molecules under study
9 9
9 9
31
Figure 2: Structure of the four most stable conformers of the CdH+H2SO4 complex calculated at the
B3LYP-D3/6-31++G (d,p) level of theory. The Gibbs free energy relative to the most stable calculated complex is given in parentheses in kcal/mol
Anti-γ-open (14.5) Anti-γ-open’ (16.5)
Anti-γ-closed (7.5) Anti-γ-closed’ (13.2)
b) c)