HAL Id: hal-01779034
https://hal.archives-ouvertes.fr/hal-01779034
Submitted on 26 Apr 2018
HAL is a multi-disciplinary open access
archive for the deposit and dissemination of
sci-entific research documents, whether they are
pub-lished or not. The documents may come from
teaching and research institutions in France or
abroad, or from public or private research centers.
L’archive ouverte pluridisciplinaire HAL, est
destinée au dépôt et à la diffusion de documents
scientifiques de niveau recherche, publiés ou non,
émanant des établissements d’enseignement et de
recherche français ou étrangers, des laboratoires
publics ou privés.
Experimental study of bubble detection in liquid metal.
Rafaël Guichou, Philippe Tordjeman, Rémi Zamansky, Wladimir Bergez,
Kevin Paumel
To cite this version:
Rafaël Guichou, Philippe Tordjeman, Rémi Zamansky, Wladimir Bergez, Kevin Paumel. Experimental
study of bubble detection in liquid metal.. Magnetohydrodynamics c/c of Magnitnaia Gidrodinamika,
Institute of Physics, University of Latvia, 2017, vol. 53 (n° 4), pp. 667-676. �10.22364/mmp2017.30�.
�hal-01779034�
O
pen
A
rchive
T
OULOUSE
A
rchive
O
uverte (
OATAO
)
OATAO is an open access repository that collects the work of Toulouse researchers and
makes it freely available over the web where possible.
This is an author-deposited version published in :
http://oatao.univ-toulouse.fr/
Eprints ID : 19815
To link to this article : DOI: 10.22364/mhd
URL
http://doi.org/10.22364/mhd
To cite this version : Guichou, Rafael and Tordjeman, Philippe and
Zamansky, Rémi and Bergez, Wladimir and Paumel, Kevin :
Experimental study of bubble detection in liquid metal (2017), Journal of
Magnetohydrodynamics, vol. 53, n°4, pp.667-676
Any correspondance concerning this service should be sent to the repository
EXPERIMENTAL STUDY OF BUBBLE DETECTION
IN LIQUID METAL
R. Guichou
1, P. Tordjeman
1, W. Bergez
1, R. Zamansky
1, K. Paumel
2 1Institut de M´ecanique des Fluides de Toulouse (IMFT), Universit´e de Toulouse, CNRS-INPT-UPS, Toulouse, France
2
CEA, DEN, Cadarache, STCP/LIET, F13108 St Paul lez Durance, France Bubble detection in liquid metal is an important issue for various technological applic-ations. For instance, in the framework of Sodium Fast Reactors design, the presence of gas in the sodium flow of the primary and secondary loops is an issue of crucial import-ance for safety and reliability. Here, the two main gas measurement methods in sodium are ultrasonic testing and eddy-current testing; we investigate the second method in our study. In a first approach, we have performed experiments with liquid metal galinstan containing insulating spherical beads of millimeter size. The liquid metal is probed with an Eddy-current Flowmeter (ECFM) in order to detect the beads and characterize their diameter and position. Results show that the signal measured by the ECFM is correl-ated with the effect of these parameters. Finally, an analytical model is proposed and compared to the experimental results.
Introduction. Bubble detection and characterization in opaque media, such as liquid metals, is an open subject of research, which finds applications in several industrial domains from the nuclear energy in the Sodium Fast Reactors (SFR) to the metallurgy. In the SFRs, the liquid sodium is used as a coolant of the nuclear core, and the presence of bubbles in the flow could indicate a leak occur-ing in the sodium–gas exchanger between the secondary and the tertiary circuit. Due to the physical properties of sodium, two measurement methods distinguish themselves for the gas detection: the eddy-current method which is the prin-ciple we investigated, and Ultrasonic testing. Eddy-current testing is commonly used for the detection of superficial defects in metallic bodies. Besides, flowmetry with eddy currents has already been implemented successfully for various liquid metals [1], [2], [3].
The main objective of the study is to develop a robust method to detect inclusions, such as bubbles or impurities, in liquid metals with the aid of an Eddy-Current Flowmeter (ECFM). In this paper, we also present models that have been developed to understand and analyze the measured signals. These models are based on a perturbative approach of the magnetic flux due to the two-phase liquid metal at small skin depths (δ = 1/√µσπf ≪ D) and low magnetic Reynolds num-ber (Rm = µσU δ ≪ 1), where µ is the magnetic permeability, σ is the electrical conductivity, f is the frequency, D is the characteristic length of the flow and U the flow velocity. A perturbative model has already been developed in [4], [5]. It states that the total magnetic flux φ in the two-phase liquid can be expanded at first order in the flow velocity U and void fraction α: φ ≈ φ0+ φU + φα, where
φ0is the flux in the absence of motion and due to Faraday effects, φU is the flux
due to motion effects, and φα is the perturbation of the flux due to the dispersed
phase.
In the first section, we present the experimental setup consisting of a tube of liquid metal (galinstan) containing insulating beads arranged with known position and diameters. An ECFM translates along the tube to probe the liquid metal. The frequency range of the current supplying the ECFM is between 1000 Hz and 3000 Hz (Rm ≪ 1 and 4.8 < δ < 8.3 mm). In the second section, we study the ECFM response by varying the current frequency f , the ECFM velocity U and
(a) u Galinstan MACOR Tube Insulating bead Positioning thread S1 P S2 (b) S1 P S2 ∆ V = VS 1 − VS 2
Fig. 1. (a) Explanatory layout of the ECFM. (b) ECFM wiring diagram.
the bead diameter D (the bead position is fixed). In the third section, we propose an analytical model of the perturbation of the magnetic field by one bead and compare it with the experimental results.
1. Experimental setup. The setup (Fig. 1a) consists of a vertical tube made from non-conducting non-ferromagnetic Macor ceramic tube (inner diameter 25 mm, outer diameter 29 mm) containing a static two-phase liquid metal: galin-stan (alloy of Gallium, Indium and Tin). Spherical beads (with four diameters of 2, 3, 4 and 5 mm) made of polymer material by 3D printing are disposed in the galinstan. The radial position of the beads is fixed with a thread (diameter 50 µm) at three different distances from the axis of the tube (3.5, 6.5 or 9.5 mm). Each tube contains one thread at a given position, where two beads of different diameters are stuck at a distance of 90 mm one to the other, in order to avoid the overlap effect on the ECFM signal. A control tube containing only galinstan is used as a reference to enlighten the influence of the beads on the measurements.
The ECFM is composed of three coaxial coils mounted on a PEEK polymer ring (inner diameter 31 mm, outer diameter 35 mm): a primary coil P (length 20 mm, inner diameter 35 mm) and two secondary coils S1 and S2 (length 10 mm, diameter 35 mm) on either sides (Fig. 1b). Each coil is composed of two layers of winding (copper wire of 0.4 mm in diameter).
The ECFM is fixed to an uniaxial displacement controller piloted by the computer 2 (Fig. 2) and translates vertically along the tube at velocities from 1 mm/s to 1000 mm/s. Hence (by referentia1l change), the ECFM probes a two-phase plug-flow. For each measurement, the ECFM is translated back and forth several times.
A lock-in amplifier piloted by the computer 1 (Fig. 2) generates AC signals of given frequency (1000 to 3000 Hz) and voltage (1 V). The transconductance amplifier produces an AC output current i0of constant amplitude (0.5 A) supplied
to the primary coil P. The generated magnetic field produced by the coil P induces eddy currents inside the galinstan, whose distribution is modified by the motion of the liquid metal and by the presence of the insulating beads. The total magnetic flux induces an e.m.f. in the secondary coils S1 and S2. The voltage difference ∆V = VS2− VS1 between the two secondary coils is measured and
Fig. 2. Functional scheme of the experimental setup.
in-phase component ∆Vk and the quadrature component ∆V⊥. We note also the
module |∆V | =p(∆Vk)2+ (∆V⊥)2and the phase Θ = arctan(∆V⊥/∆Vk).
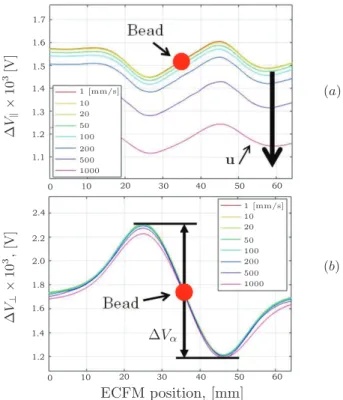
2. Experimental results. Typical demodulated signals of the ECFM are depicted in Fig. 3, where the bead diameter is 5 mm and the current frequency is 2000 Hz for the whole velocity range. The ECFM position coordinate corresponds to the middle of the primary coil. The measured voltage is the voltage difference between the two secondary coils (in-phase and quadrature components). The reproductivity of the results has been tested by measuring the signal for several translations of the ECFM and the mean standard deviation is below 2 µV, which is much smaller than ∆V (∼ 1 mV).
1.7 1.6 1.5 0 10 20 30 40 50 1.4 1.3 1.2 1.1 60 2.4 2.2 2.0 0 10 20 30 40 50 1.8 1.6 1.4 1.2 60 (a) ∆ Vk × 1 0 3 [V ] ECFM position, [mm] u 1 [mm/s] 10 20 50 100 200 500 1000 (b) ∆ V⊥ × 1 0 3 , [V ] ∆Vα 1 [mm/s] 10 20 50 100 200 500 1000
Fig. 3. Demodulated signal: (a) in-phase ∆Vkand (b) quadrature ∆V⊥ components
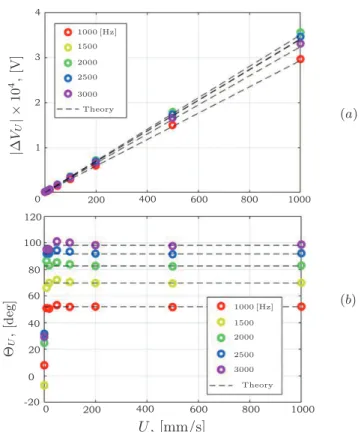
4 3 2 1 0 200 400 600 800 1000 80 60 40 20 0 200 400 600 800 1000 -20 0 120 100 (a) |∆ VU | × 1 0 4, [V ] U , [mm/s] 1000 [Hz] 1500 2000 2500 3000 Theory (b) Θ U , [d eg ] 1000 [Hz] 1500 2000 2500 3000 Theory
Fig. 4. (a) Module |∆VU| and (b) phase ΘU vs. ECFM velocity U .
At 1 mm/s and without bead, the induction due to motion is negligible, and we have ∆Vk≈ ∆V0,kand ∆V⊥≈ ∆V0,⊥. It can be noticed that ∆V0,kand ∆V0,⊥
should be zero for an ideal ECFM. The Lorentz induction in the galinstan, due to its motion, manifests itself in two offsets ∆VU,k and ∆VU,⊥. The presence of
the bead manifests itself by an oscillation of the amplitudes ∆Vα,k and ∆Vα,⊥
centered at the bead position (at 35 mm in Fig. 3).
Fig. 4 depicts the variations of |∆VU| and ΘU versus the ECFM velocity for
the tube without beads. The module |∆VU| varies linearly with velocity, which
is in agreement with [3]. The phase ΘU is invariant for a velocity larger than
20 mm/s. For a velocity smaller than this value, the voltage offset measurement is subject to larger uncertainties due to its small value.
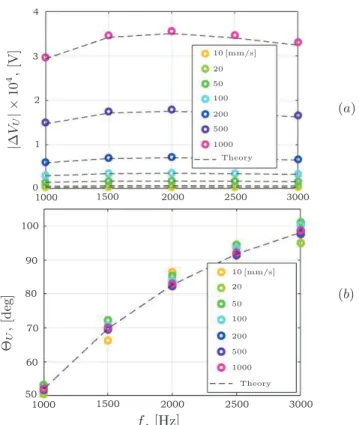
The frequency effect is shown in Fig. 5 for the same tube. The module in-creases with f up to a maximum occuring at 2000 Hz independent of the velocity. The phase ΘU increases monotonically with frequency for the whole range of
ve-locities.
The bead effects are illustrated in Fig. 6 to Fig. 8. Fig. 6 depicts |∆Vα| and
Θα versus the velocity U for a bead of 5 mm in diameter. As in [3], we observe
that |∆Vα| and Θα approximately do not depend on the velocity. This result is
fundamental to decouple the velocity effects and the void fraction effects and is the basis for bubble detection [3]. On the contrary, the oscillation amplitude depends strongly on the frequency, as it is shown in Fig. 7 for a velocity of 1 mm/s. As the frequency rises, |∆Vα| increases as a consequence of the intensification of the
current density in the galinstan (Faraday induction law). On the other hand, Θα
3 4 2 3000 2500 2000 1500 1000 0 1 80 90 70 3000 2500 2000 1500 1000 50 60 100 (a) |∆ VU | × 1 0 4, [V ] f , [Hz] 10 [mm/s] 20 50 100 200 500 1000 Theory (b) Θ U , [d eg ] 10 [mm/s] 20 50 100 200 500 1000 Theory
Fig. 5. (a) Module |∆VU| and (b) phase ΘU vs. frequency f .
1.2 1.0 0.8 0.6 0 200 400 600 800 1000 0.4 1.6 1.4 0 -10 -20 -30 0 200 400 600 800 1000 -40 20 10 (a) |∆ Vα | × 1 0 3, [V ] U , [mm/s] 1000 [Hz] 1500 2000 2500 3000 (b) Θα , [d eg ] 1000 [Hz] 1500 2000 2500 3000
Fig. 6. (a) Module |∆Vα| and (b) phase Θα vs. ECFM velocity U (bead diameter
1.5 2.0 1.0 3000 2500 2000 1500 1000 0 0.5 3000 2500 2000 1500 1000 0 -10 -20 -30 -40 20 10 (a) |∆ Vα | × 1 0 3, [V ] f , [Hz] 2 [mm] 3 4 5 (b) Θ α , [d eg ] 2 [mm] 3 4 5
Fig. 7. (a) Module |∆Vα| and (b) phase Θα vs. frequency f (U = 1 mm/s).
Fig. 8 depicts |∆Vα| and Θα of the oscillation amplitude versus the bead
volume for a velocity of 1 mm/s. |∆Vα| increases with the volume of the bead.
The phase Θα of the oscillation decreases as the bead volume increases, and this
decrease is even more important as the frequency increases. 3. Discussion.
3.1. Analytical solution for a single phase flow. The analytical solution of a coil surrounding a static metal cylinder can be found in [6]. Here, we extend the solution to the case of a coil crossed by single-phase liquid metal in stationary motion. The current in the primary coil (and, therefore, the vector potential A) is taken as a sinusoidal function of the time i0= i′0ejωt, where ω is the pulsation.
The induction equation of the vector potential is nondimensionalized with the diameter of the metal cylinder D as the spatial unit and 1/ω as the time unit. The nondimensional induction equation of the vector potential A in the metal is given by ΩD ∂A ∂t = ∇ 2 A+ Rm [u × (∇ × A)] , (1) where ΩD = µ0σωD2 is the dimensionless frequency, Rm = µ0σU0D is the
mag-netic Reynolds number, with µ0being the vacuum permeability, σ is the electrical
conductivity of the metal, and U0 is the characteristic velocity of the flow.
As the vector potential is sinusoidal versus time, we have ∂A
∂t = jA.
It is assumed that the ECFM crossed by the single phase flow is axially symmetric. The current crossing the primary coil is then strictly orthoradial and the vector
1.5 2.0 1.0 80 60 40 20 0 0.5 80 60 40 20 0 0 -10 -20 -30 -40 20 10 (a) |∆ Vα | × 1 0 3, [V ] Bead volume, [mm3 ] 1000 [Hz] 1500 2000 2500 3000 (b) Θ α , [d eg ] 1000 [Hz] 1500 2000 2500 3000
Fig. 8. (a) Module |∆Vα|. (b) Phase Θα. |∆Vα| and Θαvs. bead volume (U = 1 mm/s).
potential has a single nonzero component in the θ cylindrical coordinate noted A = A(r, z). The spatial Fourier transform in the z-coordinate of Eq. (1) expanded in the θ coordinate leads to
∂2˜ A ∂r2 + 1 r ∂ ˜A ∂r − ˜ A r2 − (2πζ) 2˜ A + j2πζRm ˜A − jΩDA = 0,˜ (2)
where ˜A = ˜A(r, ζ) is the Fourier transform of A(r, z) along the z-coordinate and ζ is the spatial frequency. Eq. (2) is a modified Bessel equation of the first order regarding the r-variable. The exact solution of ˜A is obtained for each ζ:
˜
A(r, ζ) = C1(ζ)I1(r, ζ) + C2(ζ)K1(r, ζ), (3)
where C1(ζ) and C2(ζ) are the coefficients determined by the boundary conditions,
and I1(r, ζ) and K1(r, ζ) are the modified Bessel functions of the first and second
kind, respectively. The vector potential A(r, z) is then obtained using the inverse Fourier transform. The current density in the metal is deduced by Ohm’s law and the voltage induced in the secondary coils is known by Faraday’s law.
The term j2πζRm ˜A in Eq. (2) corresponds to the Lorentz induction due to the motion of the metal. The term −jΩDA in Eq. (2) corresponds to the Faraday˜
induction due to the time variations of the field. One can see that both Faraday and Lorentz induction terms have only an imaginary part. Therefore, the vector potential A in the metal is phase-shifted relative to the current i0, which explains
the phase shifts in Fig. 5. As Rm ≪ 1, the Lorentz induction plays barely on the phase shift. This explains why ΘU is not dependent on the velocity in Fig. 4
and Fig. 5. Moreover, the lower the frequency, the lower the Faraday induction and the lower the phase shift (with regard to the reference signal). With the reference
10 0 -10 -20 -30 1.70 1.65 1.60 1.55 1.50 1.75 20 30 10 0 -10 -20 -30 2.6 2.4 2.2 2.0 1.8 2.8 20 30 (a) ∆ V × 1 0 3, [V ] ECFM position, [mm] Experimental Magnetic dipole (b) ∆ V × 1 0 3 , [V
] ExperimentalMagnetic dipole
Fig. 9. (a) f = 1000 Hz. (b) f = 2000 Hz. Bead perturbations observed in the measured signal (bead diameter 5 mm, ECFM velocity 1 mm/s, frequency 1000 Hz and 2000 Hz, bead center–wall distance 3 mm).
signal (current in the primary coil) being a cosine, the phase shift ΘU shall equal
to 0 as the frequency tends to zero, which seems to be the case in experimental results (up to the limit of the frequency range).
3.2. Theoretical model of the bead perturbation. To account for the effect of the bead, we propose to mimic its presence by a magnetic dipole oriented along the z-axis with a magnetic moment m. The moment is an empirical function of the bead diameter D, the distance h between the bead and the wall and the frequency f , on the one hand, and of the spatial distribution of the current density j(z) in the metal (known from the analytical solution), on the other hand. For the fixed D, h and f , the dependence of the moment m with j(z) observed in the experiments can be approximated by a square root function
m(z) = C(D, h, f ) s
j(z)
j(z = 0). (4) Fig. 9 shows the perturbation observed in the measured signal and the per-turbation due to a magnetic dipole for a bead of 5 mm in diameter with its center at 3 mm to the wall, at a velocity of 1 mm/s, at a frequency of 1000 Hz (left) and 2000 Hz (right).
4. Conclusions. In this paper, the ability of the eddy-current flowmeter to detect an inclusion in the form of an insulating bead inside a liquid metal has been attested by the experiment. A parametric study has been performed varying the size of the inclusion, the excitation frequency of the the eddy-current flowmeter and the relative motion of the liquid metal to the eddy-current flowmeter. The signal response to the motion versus the velocity follows a linear trend, which
is in agreement with the literature and with the analytical solution. The signal response to the passing of a bead appears to be invariant versus velocity but highly dependent on the frequency and inclusion size. A theoretical solution for the vector potential in a moving liquid metal (plug flow) subject to an AC magnetic field has been developed. The effect of a non-conducting particle is modeled by a magnetic dipole advected by the flow. The intensity of the dipole varies with the square root of the local current density at the position of the particle. This simple model can be interesting to simulate the effect of several bubbles in a more complex flow. It remains to corellate the magnetic moment with the geometrical parameters.
Acknowledgements. The project is funded by the French Atomic Energy Comission (CEA). The authors greatly acknowledge the help of Gregory Ehses and Herv´e Ayroles for the development of the experimental setup.
References
[1] R.C. Baker. Electromagnetic flowmeters for fast reactors. Progress in Nuc-lear Energy, vol. 1 (1977), pp. 41–61.
[2] S. Sureshkumar, M. Sabih, S. Narmadha et al. Utilization of eddy cur-rent flow meter for sodium flow measurement in FBRs. Nuclear Engineering and Design, vol. 265 (2013), pp. 1223–1231.
[3] T. Gundrum, P. B¨uttner, A. Peyton, B. Dekdouk, T. Wondrak, and S. Eckert. Contactless inductive bubble detection in a liquid metal column. In:Proc. the 8th Conference on Electromagnetic Processing of Materials (EPM2015) (October 2015, Cannes, France).
[4] M. Kumar, W. Bergez, Ph. Tordjeman, M. Cavaro. Void effects on eddy current distortion in two-phase liquid metal. Review of Scientific In-struments, American Institute of Physics, vol. 86 (2015), no. 10, pp. 06104. [5] M. Kumar, W. Bergez, Ph. Tordjeman, R. Arinero, and K. Paumel.
Magnetic flux distortion in two-phase liquid metal flow: model experiment. Journal of Applied Physics, vol. 119 (2016), no. 118.
[6] C.V. Dodd, and W.E. Deeds. Analytical solutions to eddy-current probe coil problems. Journal of Applied Physics, vol. 39 (1968), no. 6.