HAL Id: halshs-00966367
https://halshs.archives-ouvertes.fr/halshs-00966367
Preprint submitted on 26 Mar 2014
HAL is a multi-disciplinary open access
archive for the deposit and dissemination of sci-entific research documents, whether they are pub-lished or not. The documents may come from teaching and research institutions in France or abroad, or from public or private research centers.
L’archive ouverte pluridisciplinaire HAL, est destinée au dépôt et à la diffusion de documents scientifiques de niveau recherche, publiés ou non, émanant des établissements d’enseignement et de recherche français ou étrangers, des laboratoires publics ou privés.
Are Remittances More Effective Than Aid To Reduce
Child Mortality ? An Empirical Assessment using Inter
and Intra-Country Data
Lisa Chauvet, Flore Gubert, Sandrine Mesplé-Somps
To cite this version:
Lisa Chauvet, Flore Gubert, Sandrine Mesplé-Somps. Are Remittances More Effective Than Aid To Reduce Child Mortality ? An Empirical Assessment using Inter and Intra-Country Data. 2009. �halshs-00966367�
Are Remittances More Effective Than Aid
To Reduce Child Mortality ?
An Empirical Assessment using Inter and Intra-Country Data
Lisa CHAUVET
IRD DIAL Flore GUBERT IRD DIAL Paris School of Economics
Sandrine MESPLE-SOMPS IRD DIAL
Novembre 2009
G-MonD
Working Paper n°10
Are Remittances More Effective Than Aid To Reduce Child Mortality?
An Empirical Assessment using Inter and Intra-Country Data
Lisa Chauvet Flore Gubert Sandrine Mesplé-Somps
IRD, UMR 225 DIAL IRD, UMR 225 DIAL IRD, UMR 225 DIAL
et Ecole d'Economie de Paris
Summary – This paper analyzes the respective impact of aid, remittances and medical brain drain on child mortality using panel and cross-country quintile-level data on respectively 84 and 46 developing countries. Our results show that remittances reduce child mortality and that the impact of health aid is non-linear, suggesting that health aid is more effective in the poorest countries. By contrast, medical brain drain is found to have a harmful impact on child mortality. Last, remittances seem to be more effective in reducing mortality for children belonging to the richest households, whereas neither pro-poor nor anti-poor effect is found for health aid.
Key words – Child Mortality, Remittances, International Migration, Foreign Aid, Low and
Middle Income Countries
Acknowledgements: we wish to thank participants at the ABCDE World Bank Conference, AFSE Annual Meeting, CSAE Conference, EUDN Conference for their useful comments. We also thank Giovanni Andrea Cornia for useful discussions.
1. Introduction
Poverty reduction is increasingly put forward as the main objective of official development assistance (ODA) to developing countries. Both national leaders and the international community have indeed pledged to meet by 2015 a series of poverty reduction targets known as the Millennium Development Goals (MDGs).i The pursuit of these MDGs, however, calls
for a substantial increase in the provision of basic services to the population of the developing world that ODA alone cannot accomplish. The Monterrey Consensus following the 2002 United Nations International Conference on Financing for Development has thus highlighted
the need to find new sources of financing and the idea that more private funds should be invested in developing countries has received strong support since then.
Given this context and their ever-increasing volume, international migrant remittances have attracted a lot of attention in recent years. According to the latest World Bank estimates (see Ratha, Mohapatra, Vijayalakshmi & Zhimei, 2007), recorded remittances to developing countries reached $240 billion in 2007. Their actual size is even larger when transfers going through informal channels are taken into account. In 36 out of 153 developing countries, remittances are larger than all capital flows, public and private, and voices have already been raised here and there to call for a progressive substitution of official aid by remittances.
Little is known, however, about the respective effectiveness of aid and remittances in alleviating poverty. Despite a burgeoning literature examining the impact of ODA on aggregate welfare, there exists to our knowledge almost no study analyzing to what extent aid and remittances may substitute in terms of external flows, and how they are related to inequality and poverty reduction. Exceptions include Chauvet and Mesplé-Somps (2007) who analyze the distributive impact of trade flows, foreign direct investment (FDI), official aid and migrants’ remittances using Milanovic’s World Income Distribution database. They find that FDI increases intra-country disparities, while remittances tend to decrease them. They also find that trade and aid have a non-linear relationship with income distribution. Rajan and Subramanian (2005) compare the respective impacts of aid and remittances on developing countries’ competitiveness. They provide evidence for an adverse effect of aid on competitiveness due to the overvaluation of the exchange rate induced by large aid inflows. Their analysis also shows that remittances do not create similar adverse effects, since remittances tend to adjust when the exchange rate is overvalued.
The objective of this paper is to analyze the respective impact of aid and remittances on human development as measured by infant or child mortality rates. To what extent do aid and remittances contribute to reduce child mortality disparities between countries? What about their respective impact on child mortality disparities within countries? How do remittances compare to aid when migration costs, namely brain drain, are accounted for? Here is the list of questions this paper seeks to answer.
We choose basic indicators of human welfare instead of a monetary measure of poverty for three reasons. First, comparable cross-country data on monetary poverty over time are extremely scarce. Second, child health figures prominently in the list of MDGs. Donors have indeed committed themselves to reduce by two thirds the mortality rate among children under five (Goal 4). To this end, they have devoted an increasing share of official aid to the health sector. There is however very few empirical evidence on the effectiveness of increased aid flows on health outcomes in recipient countries. Whether donors are right to prioritize the health sector in the intra-country allocation of aid is thus an unanswered question that needs to be addressed. Third, the relationship between migration and health is increasingly emphasized in the microeconomic literature and donor agencies regularly report the success of most of their projects and programs in the health sector. It is therefore interesting to investigate whether successful health interventions from the donors’ or the migrants’ side at the micro-level translate into improved health outcomes at the macro-micro-level and whether Paul Mosley’s micro-macro paradox also applies to the health sector.
Our empirical strategy relies on two econometric exercises. We first examine the respective impact of aid, remittances and medical brain drain on child health indicators using panel data on a sample of 84 developing countries. This first econometric exercise raises substantial methodological issues such as measurement errors and endogeneity of our core explanatory variables, which we try to address in the paper. Keeping in mind the inherent weaknesses of
this macro approach, our econometric results suggest that both remittances and health aid significantly reduce infant and child mortality rates. The impact of health aid is non-linear, though, suggesting that aid to the health sector is likely to be more effective in the poorest countries. By contrast, medical brain drain, as measured by the expatriation rate of physicians, is found to have a harmful impact on health outcomes.
We then assess the respective effectiveness of aid and remittances in reducing mortality disparities within countries using cross-country quintile-level data. Results of this second econometric exercise show that remittances are effective in reducing infant and child mortality rates, but much more so for the richest quintiles. This result suggests that while remittances contribute to improve mean health outcomes in recipient countries, they tend to increase intra-country health inequality. The impact of health aid, by contrast, is hardly ever significant in our within-country regressions.
The remainder of the paper is organized as follows. Section 2 reviews the macro-literature on the poverty and inequality impact of aid and remittances. The data, method of estimation and results of the cross-country and intra-country analyses are presented in Section 3 and 4 respectively. Section 5 offers concluding remarks and discusses the policy implications of our findings.
2. The Impact of Aid and Remittances on Poverty and Inequality: A Literature Review
2.1. Poverty and Inequality Impact of Aid
From the early 1960s to the mid 1990s, the literature investigating the macro-impact of aid almost exclusively focused on the link between aid and growth. The emerging picture from this literature is that aid can enhance growth, but that this result is very fragile and highly
dependent on the choice of data, sample composition and estimation methods (Roodman, 2007). The adoption of the United Nations Millennium Declaration by UN members in 2000 and the obligation taken up by donors to financially support developing countries’ efforts to achieve the eight Millennium Development Goals by 2015 have progressively shifted the focus from the aid-growth nexus to the relationship between aid flows and welfare or poverty indicators.
The few existing studies belonging to this strand of the literature have adopted quite standard cross-country growth regression approaches, and replaced growth with an indicator of welfare or poverty as the dependent variable (see, e.g., Boone, 1996; Mosley, Hudson & Verschoor, 2004; Gomanee, Morrissey & Mosley, 2005; Gomanee, Girma & Morrissey, 2005). Since comparable cross-country data on poverty over time are extremely scarce, most studies have concentrated on the effectiveness of aid in improving human development indicators such as infant or under-five mortality rate, life expectancy or primary schooling. In a famous paper, Boone (1996) finds no evidence that aid succeeds in improving human development indicators in recipient countries. While aid could reduce infant mortality either through an increase in private consumption or through greater provision of public services to the poor, his results suggest that aid increases the size of recipient governments, but that it has no impact on basic measures of human indicators. Boone’s paper has been much criticized on two grounds. First, some authors have argued that the welfare impact of aid is not direct but goes through its impact on the amount of government spending allocated to social areas. Mosley, Hudson and Verschoor (2004) estimate a system of three equations with poverty, aid and pro-poor expenditure as their dependent variables. They find that aid is associated with higher levels of pro-poor spending, and that such spending is associated with lower levels of headcount poverty. Aid is also found to increase health spending which in turn decreases infant mortality. Gomanee, Girma and Morrissey (2005) reach the same type of conclusion
using quantile regressions. In a companion paper, however, Gomanee, Morrissey and Mosley (2005) find evidence that aid improves welfare indicators and this effect is predominantly through direct impacts. Other authors opposed to Boone’s conclusions have argued that while it may be true that aggregate aid has not impact on health, particular types of aid among which health aid are effective in improving human development indicators (see, e.g., Masud & Yontcheva, 2005; Dreher, Nunnenkamp & Thiele, 2006; Michaelowa & Weber, 2007; Mishra & Newhouse, 2007). Mishra and Newhouse (2007) in particular rely on a large dataset covering 118 countries over the 1973-2004 period to measure the effect of health aid on infant mortality. They find that increased health aid is associated with a significant reduction in infant mortality. The estimated effect of health aid is small, however, since doubling health aid within a country would reduce infant mortality in the next five-year period by only 2%. As an additional result, they do not find any significant impact of overall aid. Masud and Yontcheva (2005) use data on nongovernmental (NGO) and bilateral aid and assess the effectiveness of these financial flows on two social indicators, namely infant mortality and adult illiteracy. Their underlying assumption is that NGOs intervene at the grassroots level and could be more effective to alleviate poverty than other types of aid. Using an unbalanced panel of 58 countries from 1990 to 2001, they find that health expenditure per capita reduces infant mortality as does greater NGO aid per capita. By contrast they do not find any significant impact of total bilateral aid on infant mortality.
Overall, as for the literature examining the aid impact on growth, the few existing papers examining the links between aid and aggregate welfare as measured by human development indicators do not allow to draw clear conclusions. Some papers find no impact at all while some other papers find evidence that aid decreases infant mortality rates, either directly or indirectly through higher levels of pro-poor spending. This lack of consensus in the macro
literature is surprising given the number of successful health interventions financially supported by international assistance (Levine & the What Works Working Group, 2004).
2.2. Poverty and Inequality Impact of Remittances
Despite the increasing size of remittances, empirical macro-evidence on the poverty or inequality impact of these financial flows is even scarcer than that related to aid. Here again, this lack of evidence stems mainly from the absence of reliable and comparable cross-country data on several relevant variables and the absence of long-series that are required if use is to be made of the latest macroeconometric tools. Consequently, most of the empirical literature is confined largely to a few case-studies on villages or countries based on microeconometric data (see, e.g., Lachaud, 1999; Leliveld, 1997; Adams, 2004, 2006).
At the cross-national level, there are, to our knowledge, only four recent studies that have looked at the poverty impact of remittances (Adams & Page, 2005; World Economic Outlook, 2005; Gupta, Patillo & Wagh, 2007; Acosta, Calderon, Fajnzylber & Lopez, 2008). In addition, despite strong micro-evidence on a positive impact of remittances on education and health (see, e.g., Kanaiaupuni & Donato, 1999; Cox-Edwards & Ureta, 2003; Hildebrandt & McKenzie, 2005 and Mansuri, 2007), no one has ever investigated the impact of remittances on human development indicators at a macroeconomic level. Adams and Page (2005) use a panel of 71 low-income and middle-income countries to test whether countries producing more international migration or receiving more international remittances have less poverty. After instrumenting for the potential endogeneity of remittances, they find that a 10% increase in per capita official remittances leads to a 3.5% decline in the share of people living in poverty. Using a broader sample of 101 countries, World Economic Outlook (2005) provides further evidence that remittances have an effect on poverty, even though this effect is rather
small: on average, a 2.5 percentage point increase in the remittances to GDP ratio is associated with less than a 0.5 percentage point decrease in poverty. As argued by the authors, this (disappointing) result could be due to the fact that average income and inequality are included as regressors next to remittances. Since these variables are themselves likely to be influenced by remittances, the true impact of remittances on poverty could actually be larger. Using a sample of 76 countries in which Sub-Saharan countries are substantially represented, Gupta, Patillo and Wagh (2007) adopt the same methodology as that of Adams and Page (2005) and model poverty as a function of mean income, some measures of income distribution and remittances. Their findings indicate that a 10% rise in remittances is associated with about a 1% fall in the incidence of poverty. Last, Acosta, Calderon, Fajnzylber and Lopez (2008) use both cross-country and household survey data to assess the impact of remittances on growth, poverty and inequality in Latin America. Their cross-country estimates suggest that remittances have a positive and statistically significant effect on growth on average, but that they tend to increase the level of income inequality. The effect for the average Latin American country is different, however, since an increase in remittances tends to be associated with lower levels of inequality. Turning to their micro-econometric analyses, their findings suggest that the poverty and inequality impact of remittances strongly varies across Latin American countries, depending on whether recipients are concentrated at the bottom or at the top of the distribution of non-remittances income.
In what follows, our aim is to provide additional insights into the question of whether aid and remittances as sources of external financing are effective in improving child health outcomes.
The aim of this section is to assess the impact of health aid and remittances on child mortality, using panel data on a sample of 84 countries from 1987 to 2004 (Table A1 in Appendix provides the full list of countries included in the sample). After a brief presentation of the empirical strategy and description of the data, results of our baseline model are discussed. The analysis is then pushed further by testing for non-linearities in the aid-health relationship, and investigating the impact of the medical brain drain on health outcomes.
3.1. Model and Data
To explore the relative impacts of aid and migration on child mortality, we estimate a model of the following form:
, ,( 1, 3) ,( 1, 3) ,( 1, 3) ,
LnMortalityi t i t LnXi t t LnRemittancesi t t LnHealth aidi t t i t
(1)
Mortalityi,t is either the under-five or the infant mortality rate from the World Development
Indicators (WDI, 2006). Under-five mortality rate is the probability (per 1000) that a newborn baby will die before reaching the age of five, if subject to current age-specific mortality rates. Infant mortality rate is the number of infants dying before reaching one year of age, per 1000 live births in a given year.
Since our dependent variables are bounded, we use a logarithmic transformation. To ease interpretation of our results and account for potential non-linearities, all our independent variables are also log-linearized.
We measure Health aidi,t using aid commitments to the health sector as defined by the
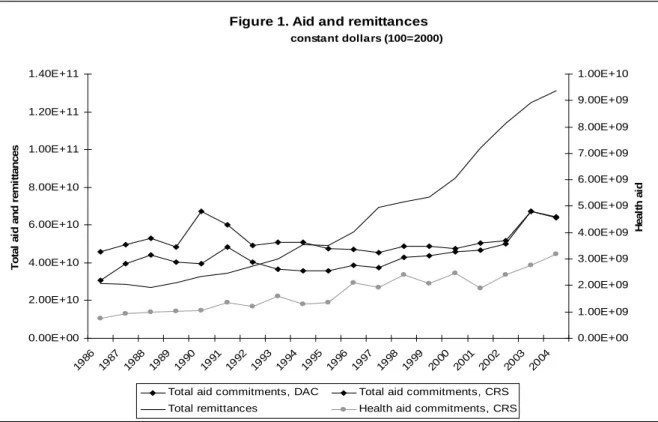
provide data on aid commitments with a high degree of disaggregation by purpose (sector). Its main disadvantage, though, is that the data is only reliable for recent years, as reflected in Figure 1 by the large underreporting of aid in the CRS data compared to those of the Development Assistance Committee (DAC). As noted by Mishra and Newhouse (2007), the extent of underreporting varies by sector, donor and time period and therefore missing data are omitted from the sample rather than considered as zero health aid. We also restrict our sample to relatively recent observations, starting in the mid-eighties. Figure 1 also shows that the share of aid commitments to the health sector has gradually increased since the eighties: at that time health aid was around 2% of total commitments, while it is now around 5%. This increase in health aid reflects the switch in donors’ priorities – notably from aid to infrastructures to aid to social sectors – which goes along with the adoption of the Millennium Development Goals. Health aidi,t is expressed in per capita constant terms (using DAC
deflator).
Remittancesi,t are defined as current transfers by migrants who are employed for more than a
year in another country in which they are considered residents (WDI, 2006). We use the same deflator for remittances as for aid in order to transform this variable into per capita constant terms. As shown by Figure 1, workers’ remittances have been increasing both in absolute and in relative terms since the mid-eighties: while they only accounted for around 60% of total aid commitments in the eighties, they have represented more than 200% of aid commitments since 2000, reflecting the growing importance of this financing for developing economies. This growth in remittances is partly due to the rise in the number of international migrants worldwide. But it also indicates that over the last years people have been shifting from informal to formal channels to send funds. This potentially important source of measurement error is addressed in our econometric analysis. First, we include a time trend, t, in our list of
unobservable heterogeneity among countries (i) hoping to account for some omitted
variables that could explain simultaneously the increasing trend in remittances and the decreasing trend in child and infant mortality. Finally, this latter issue is also tackled through the instrumentation of remittances (see 3.2).
[Figure 1 about here]
Following the existing literature on cross-country determinants of child health outcomes, equation (1) controls for a set of relevant socioeconomic variables, Xi,t. Since Ravallion
(1993), and Pritchett and Summers (1996), a consensus has emerged concerning the negative relationship between child mortality and national income. Female education – measured either by educational attainment or illiteracy rates – has also been shown to be negatively correlated with child mortality (Filmer & Pritchett, 1999; Anand & Bärnighausen, 2004; Fay, Leipziger, Wodon & Yepes, 2005; McGuire, 2006; Ravallion, 2007). We measure income per capita in PPP constant terms (WDI, 2006) and female education using the average years of schooling of the female population aged 15 and over (Barro & Lee, 2000).
Anand and Bärnighausen (2004) show that the density of human resources in the health sector is significantly correlated with child health indicators. We proxy human resources for health with the number of physicians (per 1000) provided by Bhargava and Docquier (2008).
Other cross-country determinants of child health have been identified in the literature, such as the size of the population (Mishra & Newhouse, 2007), the share of urban population (Masud & Yontcheva, 2005; Fay, Leipziger, Wodon & Yepes, 2005; Ravallion, 2007), inequality indicators (Filmer & Pritchett, 1999; McGuire, 2006; Fay, Leipziger, Wodon & Yepes, 2005; Ravallion, 2007, Cornia, Rosignoli & Tiberti2008) and poverty rates (Anand & Bärnighausen, 2004), but none were significant in our analysis. Two other variables – ethnic fragmentation and whether the country is predominantly Muslim – were also significantly correlated with
infant mortality in Filmer and Pritchett (1999) and McGuire (2006). Both are time invariant and could not be introduced in our fixed effects analysis.iii
Equation (1) is estimated on a panel of 84 developing countries, among which 35 African countries, from 1987 to 2004 (the full list of countries included in the sample is provided in Table A1 in Appendix). Child health data is leaping every four or five years (1990, 1995, 2000 and 2004). The right-hand side variables are measured in logarithm and are averaged over three years from t-1 to t-3. This is true for all variables but education, because Barro and Lee (2000) database on education is also leaping every five years and is available only up to 2000. We therefore use the 2000 level of education to explain 2004 mortality, etc. We control for unobservable heterogeneity with country fixed effects, i. We also include time dummies
t.
3.2. Endogeneity of Aid, Remittances and Income
There are two potential sources of endogeneity of aid and remittances to child and infant mortality rates. First, aid and remittances are given purposively and both donors and migrants are likely to take into account the situation of child health when allocating their flows. Even if aid is determined at the macro-level and remittances are determined at the micro-level both are likely to reflect, to some extent, the chances of survival of children. Second, there could be some omitted variables which affect aid, remittances and child mortality. For example, natural disasters are likely to induce an increase in both child mortality rates and aid and remittances inflows.
We therefore instrument health aid and workers’ remittances.iv As instruments for health aid,
we use a set of variables that capture historical and cultural relationships between developing countries and donor/destination countries. These variables are more likely to be exogenous to
child mortality than any recipient/origin countries’ own characteristics. More specifically, we use the total aid budget of the five main donors weighted by cultural distance between receiving and donor/destination countries (whether they have the same religion) and by geographic distance (distance to Washington, Brussels and Tokyo).v As an instrument for
health aid, we also use health aid lagged twice. Workers’ remittances are instrumented using the ratio of broad money supply (M2) to GDP, as countries that are more financially developed have been found to receive larger remittances. Income per capita is also endogenous to child mortality (Pritchett & Summers, 1996; Filmer & Pritchett, 1999). It is instrumented using twice lagged income per capita.
We also suspected education to be endogenous to health indicators. We tested this hypothesis. It turned out that the exogeneity of education could not be rejected by our test, a result which can partly be explained by the fact that education in t-5 (or t-4) is used to explain health outcomes in t.
The excludability and relevance of our instruments being legitimate concerns here, tests for their validity (Sargan test of overidentification, test of underidentification, partial R squared) have been systematically performed. vi
3.3. Estimation of the Baseline Model
Our estimation of the baseline model proceeds in three steps. Equation (1) is first estimated with simple OLS. We then introduce country fixed effects to take into account unobservable heterogeneity in our sample. Finally aid, remittances and income are instrumented using 2SLS including country fixed effects and time fixed effects.vii Instrumentation equations are
Regressions (1)-(6) of Table 1 present the estimations of the baseline model when the dependent variable is either the under-five mortality rate or the infant mortality rate. Income per capita is highly significant and tends to decrease child mortality. The impact is quite strong: the coefficients of income in regressions (3) and (6) suggest that a one percent increase in income decreases child mortality by around 0.56 percent and infant mortality by around 0.49. The coefficients of income per capita are interestingly close to the coefficients found by Pritchett and Summers (1996) in their IV estimations of infant mortality (around 0.3) using a different set of instruments. They are even closer for the fixed effect estimations (0.31 in Pritchett and Summers).
[Table 1 about here]
Surprisingly, the number of physicians is not significant in Table 1 except in OLS estimations. When significant, it is negative, suggesting that more doctors imply lower child and infant mortality rates. Anand and Bärnighausen (2004) find a strong impact of doctor and nurse density on various health indicators, which in their case is more robust than in our regressions. Again, only in OLS estimations does female education have a significant impact on child and infant mortality rates. In Table 1, the negative impact of the time dummies – 1990 is the omitted time dummy – reflects the decreasing trend in child and infant mortality rates over the last two decades.viii
Finally aid and remittances both have a negative coefficient in regressions (1)-(6), but contrary to Mishra and Newhouse (2007), we find no significant impact of health aid, at this stage of our empirical analysis. By contrast, remittances are found to be strongly significant in most regressions, with the expected sign. When instrumented, the coefficient of remittances is
multiplied by more than three: a one percent increase in remittances decreases child mortality by 0.12 percent and infant mortality by 0.10 percent.
3.4. Non-Linearities in the Aid-Health Relationship
As a next step to our analysis we explore in more detail the relationship between health aid and child health indicators. So far, we find no significant impact of health aid commitments. However, a relative consensus has emerged in the literature regarding the fact that aggregate aid disbursements impact macro outcomes, such as economic growth, in a non-linear way.ix
Similarly, the impact of health aid on child mortality rates may be linear. This non-linearity may be due to constrained absorptive capacity. A way to proxy constrained absorptive capacity in the health sector is through an interaction of health aid with income per capita: health aid would be relatively more effective in richer countries because they have a higher capacity to absorb aid. The interaction term between health aid and income is introduced into equation (1). It is instrumented using the same set of instruments as those for health aid and income per capita.
Results are presented in columns (1) and (2) of Table 2. The absorptive capacity hypothesis is not supported by our results. The impact of health aid is non-linear, but the non-linearity suggests that aid to the health sector is more effective in poorer countries. The threshold in income per capita corresponding to a switch to harmful aid is around 4,600US$ per capita (in PPP). Interestingly, most African countries belong to the decreasing part of the relationship between health aid and health outcomes.
It is worth noting that our baseline specification implies that we capture the direct effects of aid and remittances on child mortality. Another channel through which aid and remittances
could impact health outcomes is through their impact on GDP per capita. Since GDP per capita is included among our set of regressors, this indirect impact is not taken into account. Assuming that both remittances and aid tend to improve income, we therefore probably underestimate the impact of these sources of financing on child health indicators.
[Table 2 about here]
An alternative way of testing the constrained absorptive capacity hypothesis is to introduce the square of health aid into the regression. A quadratic relationship between health aid and child mortality would reflect marginal decreasing return to aid – after a given threshold of aid received, an additional dollar of aid is less effective, because the country no longer has the capacity to absorb it. Aid square is never significant when introduced in any of the regressions.x Moreover, its sign is negative, as is that of health aid. The absence of a quadratic
relationship between health aid and mortality confirms our previous finding of no absorptive capacity constraints of aid to the health sector. Health aid seems to be more effective where the prospects of improvements in mortality indicators are higher i.e. in poorer countries. Finally, we have explored whether the results using health aid disbursements are similar to those with aid commitments. The CRS does not provide a reliable disaggregation of disbursements by sector. Thus we proxy aid disbursements to the health sector by weighting total net disbursements with the share of health commitments in total commitments. Results are available on request. They suggest that using health aid commitments or disbursements leads to very similar results.xi
Our baseline model suggests that migrants’ remittances help improving health outcomes such as child mortality rates in developing countries. We now turn to analyzing the counterpart of workers’ remittances: the impact of the brain drain induced by migration on child and infant mortality rates in developing countries. More specifically, we explore the impact of the
medical brain drain (MDB). Bhargava and Docquier (2008) provide a rich dataset containing
information on the expatriation rate of physicians. We therefore introduce this latter variable into our model. It is averaged over three year sub-periods and transformed in logarithm. Child mortality rate and medical brain-drain may be correlated to omitted variables – such as the quality of health infrastructures. We therefore instrument this variable using the same set of instruments as for aid and remittances.xii
Regressions (3) and (4) of Table 2 present the results when MBD is introduced into the analysis. The coefficient of MBD is highly significant and has the expected positive sign: a one percent increase in the rate of expatriation of physicians increases child and infant mortality rates by around 0.5%. The expatriation of human resources in the health sector has a direct harmful impact on health outcomes in developing countries.xiii
Interestingly, the MBD does not really affect the impact of health aid on health outcomes. The threshold of income for which the relationship between aid and child health switches from negative to positive remains similar to that found in regressions (1) and (2) (between 4,600 and 4,800$), and the slope does not change a lot, suggesting that the health improving impact of aid is not altered when the MBD is taken into account.
3.6. Impact of total aid on child mortality
In this sub-section, we explore whether health outcomes are only influenced by aid to the health sector or whether the total amount of aid received also matters. There are different
alternative routes through which aid may influence health outcomes such as child mortality rates. Education, notably education of mothers, has been shown to be a major determinant of child mortality rates. Thus, aid targeted to education may have an indirect impact on health outcomes. Roads and infrastructures linking rural areas to hospitals may also contribute to decreasing child mortality rates. The same is true for water supply, electricity. Hence aid to infrastructures may also indirectly impact child mortality rates. More generally, the fungibility of aid implies that even if aid is not targeted to the health sector, it relaxes the budget constraint of the government which can choose to spend more to the health sector than it would have without aid. Total aid may therefore be associated with lower child mortality rates.
We explore the impact of total aid in Table A3 in Appendix. More specifically, we distinguish between aid commitments to the health sector and other aid commitments.xiv Other aid is
introduced in our baseline model (regressions 1 and 4) as well as in the specifications including the interaction term of aid with income (regressions 2 and 5) and the medical brain drain (regressions 3 and 6). In Table A3 other aid is not instrumented, but the results are very similar when we correct for the potential endogeneity of this variable – using the same set of instruments as for health aid. Table A3 suggests that if any, the impact of aid on health outcome in developing countries goes mainly through providing aid to the health sector. Total aid does not seem to have any impact in Table A3, whereas aid to the health sector and its interaction with income remain significant. The level of income for which the health aid starts to increase child mortality rates is between 4200 and 4800 US$. Introducing other aid into the estimations does not alter the impacts of remittances and of the medical brain drain.
In this section, we investigate the intra-country impact of aid and remittances on child and infant mortality rates, by analyzing to what extent these transfers are targeted or not to the poorest. The discussion begins with a description of the data and of the empirical strategy and ends with comments on our main findings.
4.1. Model and Data
We use the World Bank’s comprehensive database of Health, Nutrition and Population (HNP) statistics that compile development indicators from Demographic and Health Survey (DHS) by asset quintiles xv within countries (Gwatkin et al., 2007). In what follows, we use an
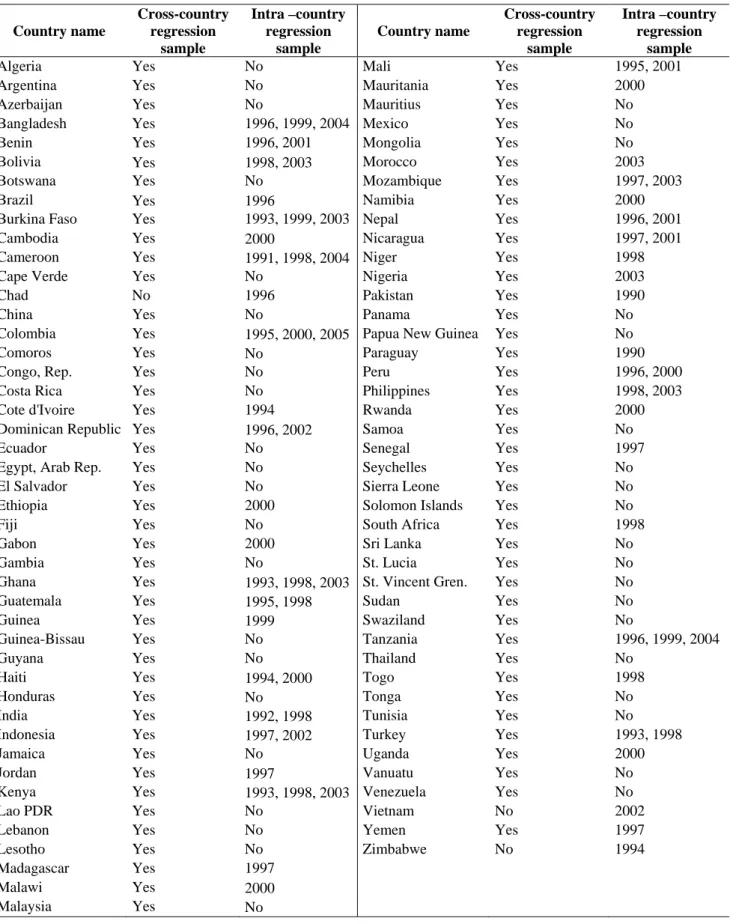
updated HNP database in which some countries have multiple year data (the list of countries and years is provided in Table A1 in Appendix).xvi This temporal dimension of the panel
makes it possible to assess the impact of country-specific variables such as GDP per capita, aid, and remittances (that vary over time) in a model including country fixed effects. The dataset covers 46 developing countries among which 26 are in Africa, with five asset quintiles for each country-year, giving a total of 370 country-time-quintile observations.
Table 3 provides summary statistics on mortality rates. It suggests that there are strong mortality disparities within country that are correlated with asset inequality. Households belonging to the poorest asset quintile have the highest mean infant and child mortality rates. For instance, child mortality is twice as high for the poorest quintile as for the richest one. It is also worth noting that the differences in mean health indicators between the poorest and richest quintiles (within variation) are always smaller than the ranges across countries within each quintile (between variation).
The intra-country model to be estimated is very similar to the cross-country model presented in the previous section in the sense that control variables are the same and are expressed in log-linear form. The baseline model may therefore be written as follows:
, , ,( 1, 3) ,( 1, 3) ,( 1, 3)
LnMortalityj i t i LnXi t t LnHealth aid Lni t t Remiti t t
15 5 5 ,( 1, 3) ,( 1, 3) , , 2 2 2 * Ln * Ln jt j t j j i t t j j i t t j i t j j j
q q Health aid q Remit
(2)where qj are quintile dummy variables and t are three time dummies (before 1997,
between 1997 and 2000, and after 2000).
The set of control variables, Xi,(t-1,t-3), includes GDP per capita in PPP constant terms, the
number of physicians per 1,000 inhabitants, female education using the average years of schooling of the female population aged 15 and over and the medical brain drain. These variables are averaged over three years from t-1 to t-3 and are transformed in logarithm. In order to test whether the impact of health aid and remittances differs between quintiles, LnHealth aid and LnRemit are interacted with quintile dummies q2 to q5, the poorest quintile
being the reference. The other control variables, such as GDP per capita, are not interacted with quintile dummies in order to limit the number of instruments when the IV specification is used. Finally, we control for country fixed effects as well as for quintile fixed effects and time trend by crossing quintile dummies and time dummies.
As in the cross-country analysis, the potential endogeneity of income, aid, remittances, and medical brain drain variables is controlled for using an IV specification. Instruments include lagged GDP per capita, ratio of lagged broad money supply (M2) to GDP, lagged health aid per capita, and total aid budgets of France, Japan, UK and USA in constant dollars weighted by geographic distance (distance to Washington, Brussels and Tokyo). We also include as instruments lagged GDP per capita and lagged health aid per capita interacted with quintiles
4.2. Estimation Results
Even though controlling for endogeneity and countries’ unobserved heterogeneity is likely to provide more reliable results (as in regressions 3 and 6), Table 4 also presents the results of simple OLS and fixed-effects regressions.
[Table 4 about here]
As suggested by Table 4, the impact of our control variables is quite similar to the one found using our cross-country specification. GDP per capita tends to decrease infant and child mortality rates. The coefficient (IV estimator) of this variable suggests that an increase of 1 percent of GDP per capita decreases child and infant mortality by around 0.6 percent. As in the previous specification, the number of physicians per 1,000 inhabitants and female education are found to have no significant impact on mortality rates. This last result is not in accordance with Ravallion (2007) who finds a significant negative impact of female education whatever the child health indicators chosen (of which the infant and child mortality rates). This lack of significant impact may result from the fact that the education variable we use is less precise than the one used by Ravallion: we use the Barro and Lee’s indicator (the national average years of schooling of the female population aged 15 and over), whereas Ravallion (2007) uses the average number of years of female schooling per quintile of the HNP database.
Turning to our variables of interest, our results suggest that migrants’ remittances have a significant impact (remittances and remittances interacted with quintile dummies are jointly significant in all estimations). Their impact on mortality rates is found to be greater for the
richest quintiles than for the poorest ones. This result suggests that remittances tend to increase health disparities within countries, and is in line with other microeconomic evidence which suggests that remittances may increase within-country inequality (Adams, 2006; Barham & Boucher, 1998).
By contrast, neither anti-poor nor pro-poor impact is found for health aid. This finding contrasts with that of Fielding, McGillivray and Torres (2008) who estimate a system of simultaneous equations on several welfare measures including health outcomes. They find a significantly negative impact of total aid (in percentage of GDP) on child mortality and an increased effectiveness of aid in reducing child mortality of the richest quintile.
Finally, contrary to the inter-country analysis, the medical brain drain does not seem to have a direct significant impact on child mortality.
V. Conclusion
For several years, it has been asserted that achieving Millennium Development Goals by 2015 will require increased external financing coupled with an improved targeting effectiveness in favor of the poorest population. In this context, international migrants’ remittances have been increasingly put forward as a promising source of external financing. Nevertheless, empirical assessments of the respective impact of aid and remittances on aggregate welfare as measured either by poverty in monetary terms or human development indicators are rather scarce. In this paper, we chose to focus on various child health outcomes, namely under-five mortality (Goal 4), and infant mortality to examine the direct impact of aid granted to the health sector and remittances on these human development indicators. Given our primary focus, we have chosen not to enter the debate on the relative importance of direct versus indirect (via government pro-poor expenditure) impact of aid. To complete our diagnosis, we
pushed our analysis further and investigated the “net” impact of migration that is to say the effectiveness of migration including the effect of the medical brain drain. We also examined the intra-country allocation of aid and migrants’ remittances.
Our results for health aid are in line with the literature examining the welfare impact of aid using cross-country data in the sense that they suggest a non-robust relationship between aid and welfare. While the impact of health aid is found to be significant in our cross-country regressions (but only when aid is interacted with income per capita), this result vanishes when cross-country quintile level data are used.
On the other hand, and for the first time, the trade-off between the gains from migration and its costs is underlined. As suggested by our paper indeed, the global impact of migration is weaker when the negative effect of medical brain drain is accounted for. Moreover, remittances are found to be more beneficial for children belonging to the richest households. This result is in line with other microeconomic evidence which suggest that remittances may increase within-country inequality. It is different from Chauvet and Mesplé-Somps (2007), however, who find a pro-poor impact of remittances.
The small estimated impact of health aid and remittances net of “brain drain costs” might well explain why child mortality rates have no substantially improved for three decades as asserted by Murray et al. (2007), despite the growing volume of health aid and migrants’ remittances. This does not mean that official assistance is inefficient. Nor does it mean that private remittances should substitute for aid. It means that further investigation into the micro-level determinants of child mortality rates is needed to improve our understanding of the bad performances of child health outcomes in most developing countries and in Africa in particular.
Acosta, P., Calderon A., Fajnzylber, P., & Lopez, H. (2008). What is the Impact of international Remittances on Poverty and Inequality in Latin America?, World Development 36(1): 89-114
Adams, R.H. (2004). Remittances and Poverty in Guatemala, World Bank Policy Research Working Paper 3418.
Adams, R.H. (2006). Remittances and Poverty in Ghana, World Bank Policy Research Working Paper 3838.
Adams, R.H. & Page, J. (2005). Do International Migration and Remittances Reduce Poverty in Developing Countries?, World Development 33(10): 1645-1669.
Anand, S., & Bärnighausen.T. (2004). Human Resources and Health Outcomes: Cross-country econometric study, www.thelancet.com 364: 1603-1609.
Barro, R.J., & Lee, J-W. (2000). International Data on Educational Attainment: Updates and
Implications. CID Working Paper 42, Harvard University.
Barham, B., & Boucher, S. (1998) Migration, Remittances and Inequality: Estimating the Net Effects of Migration on Income Distribution. Journal of Development Economics 55 (3):307– 331.
Bhargava, A., & and Docquier, F. (2007) A New Panel Data Set on Physicians’ Emigration Rates (1991-2004) http://www.ires.ucl.ac.be/CSSSP/home_pa_pers/docquier/oxlight.htm. Boone, P. (1996). Politics and the Effectiveness of Foreign Aid, European Economic Review, 40: 289-329.
Chauvet, L. & Mesplé-Somps, S. (2007). Impact des financements internationaux sur les inégalités des pays en développement, Revue Economique 58: 735-744.
Cornia, G.A., & Menchini, L. (2006). Health Improvements and Health Inequality during the Last 40 Years, UNU-WIDER Research Paper n° 2006/10, 24 p.
Cornia, G.A., Rosignoli, S., & Tiberti, L. (2008). Globalization and Health, UNU-WIDER Research Paper n° 2008/74, 42 p.
Cox-Edwards, A., & Ureta, M. (2003). International Migration, Remittances and Schooling. Evidence from El Salvador, Journal of Development Economics 72(2): 429-461.
Dalgaard, C-J., Hansen, H., & Tarp, F. (2004). On the Empirics of Foreign Aid and Growth,
Economic Journal 114(496): F191-F217.
Fay, M., Leipziger, D., Wodon, Q., & Yepes T. (2005). Achieving Child-Health-Related Millenium Development Goals: The Role of Infrastructure, World Development 33(8): 1267-1284.
Fay, M., Leipziger, D., Wodon, Q., & Yepes T. (2007). Achieving Child-Health-Related Millenium Development Goals: The Role of Infrastructure - A Reply, World Development 35(5): 929-930.
Fielding, D., McGillivray, M., & Torres, S. (2008). Achieving Health, Wealth and Wisdom: Links Between Aid and the Millennium Development Goals, in Mark McGillivray (Ed.)
Achieving the Millenium Development Goals, Palgrave McMillan, 208 p., forthcoming.
Filmer, D., & Pritchett, L. (2001). Estimating wealth effects without expenditure data or tears: an application to educational enrolments in states of India, Demography, 38(1): 115-132. Filmer, D., & Pritchett, L. (1999). The Impact of Public Spending on Health: Does Money Matter?, Social Science and Medicine 49: 1309-1323.
Gomanee, K., Morrissey, O., Mosley, P. & and Verschoor, A. (2005). Aid, Government Expenditure, and Aggregate Welfare, World Development, 33(3): 355-370.
Gomanee, K., Girma, S., & Morrissey, O. (2005). Aid, Public Spending and Human Welfare: Evidence from Quantile Regressions, Journal of International Development 17: 299-309 Gupta, S., Pattillo, C., & Wagh, S. (2007). Impact of Remittances on Poverty and Financial Development in Sub-Saharan Africa, IMF Working Paper WP/07/38, 43p.
Gwatkin, D. R., Rutsein, S., Johnson, K., Eldwan, S., Wagstaff, A., & Amouzou A. (2007).
Socio-Economic Differences in Health, Nutrition, and Population Within Developing Countries, An Overview. Produced by the World Bank in collaboration with the Government
of the Netherlands and Swedish International Development Cooperation Agency, Washington DC.
Hansen, H., & Tarp, F. (2001). Aid and Growth Regressions, Journal of Development
Economics 64(2): 547-570.
Hildebrandt, N., & McKenzie, D. (2005). The effects of migration in child health in Mexico, Policy Research Paper Series 3573, Washington D.C.,World Bank.
Kanaiaupuni, S.M., & Donato, K.M. (1999). Migradollars and Mortality: The Effects of Migration on Infant Survival in Mexico, Demography 36: 339-53.
Lachaud, J-P. (1999). Envois de fonds, inégalité et pauvreté au Burkina Faso, Revue Tiers
Monde 160: 793-827.
Leliveld, A. (1997). The Effects of Restrictive South African Migrant labor Policy on the Survival of Rural Households in Southern Africa: A Case Study from Rural Swaziland, World
Development 25(11): 1839-49.
Lensink, R., & White, H. (2001). Are There Negative Returns to Aid?, Journal of
Development Studies 37(6): 42-65.
Levine, R., & the What Works Working Group (2004). Millions Saved: Proven Successes in
Masud, N., & Yontcheva, B. (2005). Does Foreign Aid Reduce Poverty? Empirical Evidence from Nongovernmental and Bilateral Aid, IMF Working Paper 05/100, Washington D.C. Mansuri, G. (2007). Migration, School Attainment and Child Labor: Evidence from rural Pakistan, Policy Research Paper Series 3945, Washington D.C., World Bank.
McGuire, J.W. (2006). Basic Health Care Provision and Under-5 Mortality: A Cross-National Study of Developing Countries, World Development 34(3): 405-425.
Mishra, P., & Newhouse D.L. (2007). Health Aid and Infant Mortality. IMF Working Paper 07/100, IMF, Washington D.C.
Mosley, P., Hudson, J. & Verschoor, A. (2004). Aid, poverty Reduction and the ‘new conditionality’, The Economic Journal 114: 217-243.
Murray, C.L., Laakso, T., Shibuya, K., Hill, K., & Lopez, A.D. (2007). Can we achieve Millennium Development Goal 4? New analysis of country trends and forecasts of under-5 mortality to 2015, www.thelancet.com, 370(September 22): 1040-1054.
Pritchett, L., & Summers, L. (1996). Wealthier is Healthier, Journal of Human Resources 31(4): 841-868.
Rajan, R.G., & Subramanian, A. (2005). What Undermines Aid’s Impact on Growth?, IMF Working Paper WP/05/126, 54p.
Ratha, D., Mohapatra, S., Vijayalakshmi, K.M. & Zhimei X. (2007). Remittance Trends 2007, Migration and Development Brief 3, Development Prospects Group, Migration and Remittances Team, November 2007.
Ravallion, M. (1993). Human Development in Poor Countries: On the Role of Private Incomes and Public Services, Journal of Economic Perspectives 7(1): 133-150.
Ravallion, M. (2007). Achieving Child-Health-Related Millenium Development Goals: The Role of Infrastructure – A Comment, World Development 35(5): 920-928.
Roodman, D. (2007). Macro Aid Effectiveness Research: A Guide for the Perplexed, Center for Global Development, Working Paper 135, 21p.
Tavares, J. (2003). Does Foreign Aid Corrupt?, Economics Letters 79: 9-106.
World Economic Outlook (2005). Globalization and External Imbalances, Washington DC: International Monetary Fund.
Appendix
[Tables A1, A2 and A3 about here]
i
The eight Millennium Development Goals are: 1) to halve extreme income poverty; 2) to achieve universal primary education; 3) to promote gender equality; 4) to reduce by two-thirds the under-five mortality rate; 5) to reduce by three-quarters the maternal mortality rate; 6) to reduce the incidence of AIDS; 7) to promote sustainable development and to halve the percentage of people without access to safe drinking water; 8) to set up a global partnership for development involving more generous, more widespread official development assistance.
ii
CRS data is available at:
http://www.oecd.org/document/0/0,2340,en_2649_34447_37679488_1_1_1_1,00.html.
iii
There has also been an intense debate concerning the impact of public spending on child mortality. Because one of our core independent variable is health aid, and since the impact of health aid goes through the route of public spending, we exclude this variable from our analysis.
iv
Note that the introduction of country fixed effects contributes to solving, although imperfectly, the omitted variable bias.
v
Tavares (2003) and Rajan and Subramanian (2005) use similar instruments for aid and/or remittances.
vi
Tests of overidentification and underidentification are reported in each table. Test for weak instruments, excludability and partial R squared are available upon requests.
vii
Following the literature on the determinants of mortality rates and contrary to Mishra and Newhouse (2007), we do not estimate a system of moment equations using Generalized Method of Moments (GMM) with a lagged dependent variable. The main reason is that the number of time periods is too small.
viii
See Cornia and Menchini (2006), and Cornia, Rosignoli and Tiberti (2008) for a detail analysis of infant and child mortality trends around the world since the 1960s.
ix
The kind of non-linearity is still debated, though. Some authors argue that the relationship is quadratic (Hansen & Tarp, 2001; Lensink & White, 2001). Other claim that aid’s impact depends on economic policy (Burnside & Dollar, 2000), on the vulnerability to external shocks (Guillaumont & Chauvet, 2001), on export price shocks (Collier & Dehn, 2001), on the fact of being a tropical country (Dalgaard, Hansen & Tarp, 2004).
x
Results are available from authors on request.
xi
We also re-run all our regressions using aggregate aid disbursements instead of health aid disbursements, but the variable was never significant, suggesting that not all types of aid affect health outcomes. Results are available upon request.
xii
It is worth noting that estimations where the medical brain drain is not instrumented lead to very similar results to those of Table 2.
xiii
Note that our estimations may under-estimate this impact as the MBD variable provided by Bhargava and Docquier (2008) measures only physicians brain drain but not other medical personnel emigration (nurses, midwife).
xiv
Other aid is constructed as total aid commitments minus commitments to the health sector (in constant per capita terms). This variable is an average over (t-1, t-3) and is transformed in logarithm.
xv
Asset quintiles are computed using the first principal component in an analysis of the correlations between various consumer durables and other household characteristics, following a method proposed by Filmer and Pritchett (2001).
xvi
Fay, Leipziger, Wodon & Yepes (2005), Ravallion (2007), and Fielding, McGillivray and Torres (2008) have used the HNP database to analyze the determinants of child-health outcomes, but only in cross-section.
Source of the data: OECD-DAC, OECD-CRS, WDI (2006).
Figure 1. Aid and remittances constant dollars (100=2000) 0.00E+00 2.00E+10 4.00E+10 6.00E+10 8.00E+10 1.00E+11 1.20E+11 1.40E+11 198 6 1987 198 8 198 9 1990 1991 199 2 199 3 1994 199 5 199 6 1997 1998 199 9 200 0 2001 200 2 200 3 2004 To ta l a id a n d r e m itta nc e s 0.00E+00 1.00E+09 2.00E+09 3.00E+09 4.00E+09 5.00E+09 6.00E+09 7.00E+09 8.00E+09 9.00E+09 1.00E+10 He a lt h a id
Total aid commitments, DAC Total aid commitments, CRS
Table 1. Impact of health aid and remittances on child and infant mortality, baseline model.
Child mortality Infant mortality
OLS Within 2SLS OLS Within 2SLS
(1) (2) (3) (4) (5) (6)
GDP per capita (a) -0.522*** -0.233** -0.562** -0.440*** -0.184** -0.489** (0.096) (0.093) (0.255) (0.085) (0.084) (0.227) Number of physicians per 1,000 -0.132** -0.0440 0.0449 -0.0912* -0.0310 0.0499 (0.051) (0.039) (0.054) (0.047) (0.036) (0.049) Female educational attainment -0.200** -0.0135 -0.0095 -0.191** 0.0179 0.0053 (0.088) (0.089) (0.099) (0.078) (0.082) (0.092) Dummy for missing education var. -0.195* -0.0723 -0.220 -0.185** -0.0076 -0.171
(0.104) (0.130) (0.184) (0.0844) (0.114) (0.170) Remittances per capita (a) -0.049** -0.041*** -0.123*** -0.041* -0.031*** -0.105**
(0.024) (0.013) (0.045) (0.022) (0.011) (0.041) Health aid per capita (a) -0.0102 -0.0101 -0.0149 -0.0067 -0.0084 -0.0045
(0.022) (0.0095) (0.025) (0.022) (0.009) (0.023) Year = 1995 -0.058** -0.085*** -0.049** -0.082*** (0.027) (0.021) (0.023) (0.019) Year = 2000 -0.053 -0.169*** -0.037 -0.052 -0.169*** -0.043 (0.041) (0.039) (0.035) (0.036) (0.036) (0.032) Year = 2004 -0.102** -0.238*** -0.071 -0.105** -0.240*** -0.082* (0.048) (0.050) (0.052) (0.043) (0.0451) (0.046) Constant 8.539*** 6.251*** 7.606*** 5.498*** (0.753) (0.917) (0.673) (0.827)
Fixed effects No Yes Yes No Yes Yes
Observations 296 296 233 296 296 233
Number of countries 84 84 84 84 84 84
R-squared 0.758 0.551 0.268 0.724 0.545 0.303
Sargan (p-value) 0.225 0.237
Underidentification test (p-value) 0.139 0.139
Income instF-Stat (p-value) 0.000 0.000
Aid instF-Stat (p-value) 0.098 0.098
Remit. instF-Stat (p-value) 0.000 0.000
Notes: Robust standard errors in parentheses. All variables except the education variable are averages over three-year periods, from t-1 to t-3, measured in logs. * significant at 10%; ** significant at 5%; *** significant at 1%. In equations 1 and 4, standards errors are clustered by country. (a) Instrumented regressors in equations 3 and 5. Instruments include twice lagged GDP per capita, twice lagged aid, and instruments for aid and remittances in the tradition of Tavares (2003), namely total aid budgets of the five largest donors (USA, Japan, France UK, Germany) in constant dollars weighted by cultural (same religion) and geographical distance variables. The ratio of broad money supply (M2) to GDP is also included as an instrument for remittances. Tests of excludability of the instruments are available upon request.
Table 2. Alternative specifications, 2SLS with fixed effects.
Dependent variable Child
mortality Infant mortality Child mortality Infant mortality 2SLS estimations (1) (2) (3) (4)
GDP per capita (a) -0.191 -0.131 -0.384 -0.296
(0.295) (0.271) (0.313) (0.272) Number of physicians per 1,000 0.0205 0.0264 0.0307 0.0351 (0.0701) (0.0645) (0.0637) (0.0574) Female educational attainment -0.0993 -0.0816 -0.252 -0.212
(0.157) (0.147) (0.176) (0.154) Dummy for missing education variable -0.409 -0.354 -0.617** -0.532*
(0.298) (0.278) (0.311) (0.275) Remittances per capita (a) -0.137** -0.119** -0.142*** -0.123***
(0.0540) (0.0506) (0.0493) (0.0447) Health aid per capita (a) -1.266** -1.215** -1.019** -1.003** (0.541) (0.509) (0.516) (0.468) Health aid per capita x Income per capita (a) 0.150** 0.145** 0.120* 0.119**
(0.0647) (0.0611) (0.0617) (0.0561)
Medical Brain Drain (a) 0.513** 0.440**
(0.242) (0.216)
Year = 2000 -0.016 -0.023 -0.016 -0.023
(0.051) (0.048) (0.042) (0.039)
Year = 2004 -0.063 -0.074 -0.106* -0.111**
(0.068) (0.062) (0.062) (0.056)
Fixed effects Yes Yes Yes Yes
Observations 233 233 233 233
Number of countries 84 84 84 84
Sargan (p-value) 0.506 0.508 0.931 0.861
Underidentification test (p-value) 0.215 0.215 0.140 0.140 Income instrumentation F-Stat (p-value) 0.000 0.000 0.000 0.000 Aid instrumentation F-Stat (p-value) 0.098 0.098 0.098 0.098 Aid x GDP instrumentation F-Stat (p-value) 0.104 0.104 0.104 0.104 Remittances instrumentation F-Stat (p-value) 0.000 0.000 0.000 0.000 Medical BD instrumentation F-Stat (p-value) 0.059 0.059 Notes: Robust standard errors in parentheses. All variables except the education variable are averages over three-year periods, from t-1 to t-3, measured in logs. * significant at 10%; ** significant at 5%; *** significant at 1%. (a) Instrumented regressors. Instruments include twice lagged GDP per capita and aid as well as instruments for aid and remittances in the tradition of Tavares (2003), namely total aid budgets of the five largest donors (USA, Japan, France UK, Germany) in constant dollars weighted by cultural (same religion) and geographic distance variables. The ratio of broad money supply (M2) to GDP is also included as an instrument for remittances. Tests of excludability of the instruments are available upon request.
Table 3. Summary statistics
Variable Observations (a) Mean Std. Dev. Min Max
Infant mortality (b) Full sample 370 72.63 34.22 11.90 187.70 Poorest quintile 74 87.37 31.70 32.00 187.70 Second quintile 74 83.05 33.22 23.80 152.30 Third quintile 74 76.92 34.50 19.70 157.20 Fourth quintile 74 66.42 32.58 11.90 142.00 Richest quintile 74 49.38 24.97 13.80 97.20 Child Mortality (c) Full sample 370 115.77 67.59 14.20 354.90 Poorest quintile 74 142.30 63.23 39.10 297.90 Second quintile 74 135.14 69.65 27.30 354.90 Third quintile 74 122.72 69.61 23.50 348.30 Fourth quintile 74 104.44 64.95 14.20 314.90 Richest quintile 74 74.22 46.46 15.80 183.70 Notes:
(a) country-time observations
(b) Infant mortality: number of deaths to children under twelve months of age per 1,000 live births, based on experience during the ten years before the survey.
(c) Child mortality: number of deaths to children under five years of age per 1,000 live births, based on experience during the ten years before the survey.
Table 4. Intra-country specification with interaction terms.
Child mortality (CMR) Infant mortality (IMR)
(1) (2) (3) (4) (5) (6) OLS Within IV OLS Within IV GDP per capita (a) -0.298*** -0.513*** -0.624*** -0.277*** -0.517*** -0.578**
(0.0958) (0.186) (0.208) (0.0711) (0.193) (0.228)
Number of physicians per 1,000 -0.175*** 0.0128 -0.00526 -0.0856 0.0741 0.0690 (0.0629) (0.0699) (0.0803) (0.0513) (0.0727) (0.0900) Female educational atta. -0.223*** 0.0283 -0.579 -0.242*** 0.196 -0.384
(0.0759) (0.277) (0.557) (0.0534) (0.289) (0.536)
Dum. for missing educ. var. (b) -0.0208 -0.0851
(0.129) (0.0929)
Medical brain drain (a) 0.0180 -0.108 0.295 0.0213 -0.0859 0.323
(0.0338) (0.154) (0.484) (0.0277) (0.161) (0.468)
Health aid per capita (a) -0.0277 -0.00738 -0.0266 -0.0307 -0.00541 -0.00369 (0.0412) (0.0353) (0.0762) (0.0395) (0.0367) (0.0734) Health aid p.c. x 2ndquintile(a) 0.0398** 0.0398 0.0489 0.0295 0.0295 0.0543
(0.0164) (0.0241) (0.0454) (0.0189) (0.0251) (0.0472) Health aid p.c. x 3rd quintile (a) 0.0574** 0.0574** 0.0706* 0.0501* 0.0501** 0.0798*
(0.0261) (0.0241) (0.0423) (0.0267) (0.0251) (0.0421) Health aid p.c. x 4th quintile (a) 0.0797** 0.0797*** 0.107** 0.0763** 0.0763*** 0.0964*
(0.0318) (0.0241) (0.0479) (0.0321) (0.0251) (0.0498) Health aid p.c. x 5th quintile (a) 0.0483 0.0483** 0.103* 0.0541 0.0541** 0.120**
(0.0375) (0.0241) (0.0573) (0.0379) (0.0251) (0.0578) Remittances p. c. (a) 0.0405 0.0422 -0.0114 0.0326 0.0537 -0.0161
(0.0302) (0.0323) (0.0718) (0.0230) (0.0336) (0.0700) Remit. p.c. x 2nd quintile (a) -0.0378*** -0.0378** -0.0618* -0.0407*** -0.0407** -0.0440
(0.00953) (0.0151) (0.0350) (0.0117) (0.0157) (0.0347)
Remit. p.c. x 3rd quintile (a) -0.0591*** -0.0591*** -0.124*** -0.0543*** -0.0543*** -0.0957*** (0.0150) (0.0151) (0.0325) (0.0143) (0.0157) (0.0305) Remit. p.c. x 4th quintile (a) -0.0790*** -0.0790*** -0.146*** -0.0723*** -0.0723*** -0.118***
(0.0160) (0.0151) (0.0333) (0.0152) (0.0157) (0.0319) Remit. p.c. x 5th quintile (a) -0.0827*** -0.0827*** -0.166*** -0.0662*** -0.0662*** -0.134***
(0.0214) (0.0151) (0.0411) (0.0225) (0.0157) (0.0397)
Constant 6.968*** 8.170*** 6.572*** 7.847***
Table 4. (continued)
Fixed effects No Yes Yes No Yes Yes
Quintile X period dummies Yes Yes Yes Yes Yes Yes
Observations 370 370 370 370 370 370
R-squared 0.833 0.786 0.733 0.800 0.716 0.662
Number of id 46 46 46 46
Joint significance of aid var. 0.171 0.024 0.213 0.211 0.042 0.173 Joint significance of remit. var. 0.000 0.000 0.000 0.000 0.000 0.000
Underidentification test (p-value) 0.000 0.000
Sargan (p-value) 0.679 0.615
Instrumentation equation F-Stat (p-value)
Income 0.000 0.000 Fem. edu. 0.000 0.000 Aid 0.047 0.047 Aid X q2 0.047 0.047 Aid X q3 0.047 0.047 Aid X q4 0.047 0.047 Aid X q5 0.047 0.047 Remittances 0.000 0.000 Remit. X q2 0.000 0.000 Remit. X q3 0.000 0.000 Remit. X q4 0.000 0.000 Remit. X q5 0.000 0.000
Medical brain drain 0.000 0.000
Notes: Robust standard errors in parentheses. All variables except the education variable are averages over three-year periods, from t-1 to t-3, measured in logs. * significant at 10%; ** significant at 5%; *** significant at 1%. (a) Instrumented regressors in equations 3, 6. Instruments include lagged GDP per capita, ratio of lagged broad money supply (M2) to GDP, lagged health aid per capita, and total aid budgets of France, Japan, UK and USA in constant dollars weighted by geographic distance (distance to Washington, Brussels and Tokyo). We also include lagged GDP per capita and lagged health aid per capita interacted with quintiles q2 to q5 among the instruments. Tests of excludability of the instruments are available upon request.
Table A1. List of countries Country name Cross-country regression sample Intra –country regression sample Country name Cross-country regression sample Intra –country regression sample
Algeria Yes No Mali Yes 1995, 2001
Argentina Yes No Mauritania Yes 2000
Azerbaijan Yes No Mauritius Yes No
Bangladesh Yes 1996, 1999, 2004 Mexico Yes No
Benin Yes 1996, 2001 Mongolia Yes No
Bolivia Yes 1998, 2003 Morocco Yes 2003
Botswana Yes No Mozambique Yes 1997, 2003
Brazil Yes 1996 Namibia Yes 2000
Burkina Faso Yes 1993, 1999, 2003 Nepal Yes 1996, 2001
Cambodia Yes 2000 Nicaragua Yes 1997, 2001
Cameroon Yes 1991, 1998, 2004 Niger Yes 1998
Cape Verde Yes No Nigeria Yes 2003
Chad No 1996 Pakistan Yes 1990
China Yes No Panama Yes No
Colombia Yes 1995, 2000, 2005 Papua New Guinea Yes No
Comoros Yes No Paraguay Yes 1990
Congo, Rep. Yes No Peru Yes 1996, 2000
Costa Rica Yes No Philippines Yes 1998, 2003
Cote d'Ivoire Yes 1994 Rwanda Yes 2000
Dominican Republic Yes 1996, 2002 Samoa Yes No
Ecuador Yes No Senegal Yes 1997
Egypt, Arab Rep. Yes No Seychelles Yes No
El Salvador Yes No Sierra Leone Yes No
Ethiopia Yes 2000 Solomon Islands Yes No
Fiji Yes No South Africa Yes 1998
Gabon Yes 2000 Sri Lanka Yes No
Gambia Yes No St. Lucia Yes No
Ghana Yes 1993, 1998, 2003 St. Vincent Gren. Yes No
Guatemala Yes 1995, 1998 Sudan Yes No
Guinea Yes 1999 Swaziland Yes No
Guinea-Bissau Yes No Tanzania Yes 1996, 1999, 2004
Guyana Yes No Thailand Yes No
Haiti Yes 1994, 2000 Togo Yes 1998
Honduras Yes No Tonga Yes No
India Yes 1992, 1998 Tunisia Yes No
Indonesia Yes 1997, 2002 Turkey Yes 1993, 1998
Jamaica Yes No Uganda Yes 2000
Jordan Yes 1997 Vanuatu Yes No
Kenya Yes 1993, 1998, 2003 Venezuela Yes No
Lao PDR Yes No Vietnam No 2002
Lebanon Yes No Yemen Yes 1997
Lesotho Yes No Zimbabwe No 1994
Madagascar Yes 1997
Malawi Yes 2000
Table A2. Instrumentation equations
Instrumentation equation for : GDP per capita Health aid per capita Remittances per capita Number of physicians per 1,000 0.019 -0.647** 0.568*
(0.023) (0.317) (0.305)
Female educational attainment 0.020 0.713 0.052
(0.062) (0.755) (0.824)
Dummy for missing education variable -0.029 1.004 -1.920
(0.099) (1.288) (1.331)
Year = 2000 0.046 0.579 -0.359
(0.038) (0.612) (0.304)
Year = 2004 0.159* -0.051 1.128*
(0.085) (0.947) (0.604)
Twice lagged health aid per capita 0.007 -0.223* 0.087*
(0.005) (0.119) (0.046)
Twice lagged GDP per capita 0.338*** -0.070 -0.157
(0.084) (0.674) (0.435)
M2/GDP -0.006 0.448 0.139
(0.041) (0.385) (0.330)
Total aid budget of France x Same religion 0.230 -0.522 3.807***
(0.147) (1.344) (0.901)
Total aid budget of France x Distance -0.00002 0.0004 0.00003
(0.00002) (0.0003) (0.0002)
Total aid budget of UK x Same religion -0.321** 0.137 -4.328***
(0.158) (1.757) (1.021)
Total aid budget of UK x Distance -0.00002 0.0002 0.0001
(0.00001) (0.0002) (0.0001)
Total aid budget of Germany x Same religion -0.350 -2.214 -6.710***
(0.229) (2.426) (1.571)
Total aid budget of USA x Same religion 0.175 0.351 2.189***
(0.114) (1.538) (0.758)
Total aid budget of USA x Distance 0.000003 0.00005 -0.0001***
(0.000005) (0.00007) (0.00004)
Total aid budget of Japan x Same religion -0.125 -4.095 6.815*
(0.243) (2.959) (4.031)
Total aid budget of Japan x Distance 0.00002 0.00003 0.0003*
(0.00002) (0.0002) (0.0001)
Fixed effects Yes Yes Yes
Observations 233 233 233
F-Statistic (p-value) 0.000 0.061 0.000