City Browser: A User Study to Optimize a
Naturalistic Voice Navigation System
by
Shannon Colette Roberts
Submitted to the Department of Mechanical Engineering in Partial Fulfillment of the Requirements for the
Degree of Bachelor of Science
at the
MASSACHUSETTS INSTITUTE OF TECHNOLOGY May 2009
© 2009 Shannon Colette Roberts All rights reserved
The author hereby grants MIT permission to reproduce and to distribute publicly paper and electronic copies of this thesis document in whole or in part
in any medium now known or hereafter created.
Signature of Author……… Department of Mechanical Engineering May 8, 2009
Certified by……… Joseph F. Coughlin Director, AgeLab and New England University Transportation Center Thesis Supervisor
Accepted by………... Professor J. Lienhard V Collins Professor of Mechanical Engineering Chairman, Undergraduate Thesis Committee
(this page intentionally left blank)
City Browser: A User Study to Optimize a
Naturalistic Voice Navigation System
by
Shannon Colette Roberts
Submitted to the Department of Mechanical Engineering on May 8, 2009 in partial fulfillment of the requirements for the Degree of Bachelors of Science in
Mechanical Engineering
Abstract
Advanced automotive technology such as adaptive cruise control and navigation systems are becoming ever more popular. With all of the technology to aid the driver, it is difficult to recognize when the technology used to inform the driver is more of a distraction than a benefit. Specifically, the user interaction associated with navigation systems has not been perfected. In response, the Computer Science and Artificial Intelligence Laboratory at MIT has created City Browser, an in-vehicle naturalistic navigation system that allows the user to search an online database for points on interest and to find directions.
To gain feedback on the operation of the system in order to improve it for consumer use, a user study was conducted with over 90 participants. Each subject was also separated into different demographic groups as to quantify the difference of age and gender on system interaction. During the course of the experiment, three different forms of data collection were obtained: self report questionnaires, audio recordings, and physiology measurements such as heart rate, breathing rate, and skin conductance.
The results indicate that users’ feel the system is enjoyable, useful, and easy to learn. At the same time, users were also displeased with the voice of the system and felt that operating the system required a high level of concentration. The system had a response accuracy of 54.7% and had tendency to recognize the voice of 25-34 and 45-54 year old males better than other demographic group. The physiological measurements taken from the study were deemed to be inconclusive for determining the task difficulty and hence, more testing and analysis is needed. Overall, the City Browser system has proven to be practical in allowing users access to real time directions and points of interest in the greater Boston area. The results from this user study will allow the system to continually develop into a product for consumer use.
Thesis Supervisor: Joseph Coughlin
Title: Director, AgeLab and New England University Transportation Center
(this page intentionally left blank)
Acknowledgments
The author gratefully acknowledges the help and support she has received throughout the development of her thesis project.
First, the author would like to thank her thesis supervisor, Joseph Coughlin. If it were not for him, the City Browser project would not have been possible. She would also like to recognize the work of her fellow colleagues at the MIT AgeLab. Without the guidance and instruction from Jarrod Orszulak, Bryan Reimer, and Bruce Mehler, the City Browser project would not have been as successful as it was. The author also appreciates the individual contributions including data collection and editing via physiological records, survey coding, and transcription from Eugenia Gisin, Jacob Wamala, Tina Stutzman, Michael Thompson, and Katharine Binder as well as subject recruitment by Katie Godfrey.
In addition to the MIT AgeLab, the author thankfully acknowledges the computer programming for the City Browser project done by Alexander Gruenstein and Sean Liu of the MIT Computer Science and Artificial Intelligence Laboratory (CSAIL).
(this page intentionally left blank)
Table of Contents
Abstract………..3 Acknowledgements………5 1 Introduction………8 1.1 Background………..8 1.2 Purpose………...10 2 Experimental Design………112.1 City Browser Interface………...11
2.2 Data Collection………..………14
2.3 Subject Selection and Recruitment………18
2.4 Procedure………...19
2.5 Pilot Study………..21
3 Results………...23
3.1 Survey Responses………..23
3.2 Utterance Transcription Analysis………..26
3.3 Physiology Analysis………..30 4 Discussion……….31 4.1 Discussion of Results……….31 4.2 Conclusion……….33 4.3 Future Work………...34 5 References……….36 6 Appendix………...37 7
(this page intentionally left blank)
1 Introduction
1.1 Background
Vehicle technology development is an area of increasing research as more advanced systems are now standard in automobiles. Many newer model cars have features such as lane departure warnings, rear parking assist cameras, blind spot detection, and adaptive cruise control. With all of the technology to aid and inform the driver, it is hard to know when the distractions caused by such devices outweigh the advantages (Meyer). A potential solution to this problem is extensive user testing—allowing the general public to view and critique new automotive technology before its release into the public domain.
A particular area of interest is automotive navigation systems. With portable navigation systems, in-vehicle navigation systems, as well as cellular phones equipped with GPS navigation
capabilities, many vehicle owners have access to real time directions. Even though there have been many technological advances with navigation systems, the user interaction with such systems has not been perfected. Most systems require a certain sequence of actions in order to achieve the end goal of directions or information regarding points of interests. To alleviate the difficulty of learning a defined set of commands, some interface designers have decided to use spoken language as user’s main communication with the system (Gruenstein). However, current speech recognition systems are not able to distinguish between all types of words and hence require the user to enter information via a certain set of formulaic commands, bit by bit. For example, if the user wishes to find an Italian restaurant near their current location, the user would have to say “Boston”—indicating the current location, then “Restaurants”—indicating the
specific point of interest, and finally “Italian”—indicating the type of restaurant. As the typical owner of high-end vehicles that contain built-in navigation systems are older adults who are less technologically savvy, the adaptation to such systems must be relatively simple, but this is not always the case (Coughlin).
In response to these demands, The Computer Science and Artificial Intelligence Laboratory (CSAIL) at MIT has developed City Browser, a naturalistic voice recognition system which has
been implemented through the use of a tablet PC, a cellular phone, the world wide web, and a vehicle. City Browser is a conversational interface that allows the user to search the online database for restaurants, hotels, museums, and subway stations in the greater Boston area. It also allows users to gather detailed information such as restaurant rating and cost as well as to find addresses on a map, and attain driving directions. City Browser is different from current
navigation systems in its conversational interaction with the user. With the naturalistic interface of the City Browser system, if the user wants to find Italian restaurants near their current
location, he/she would say “Show me Italian restaurants near where I am” instead of entering the information bit by bit, as in the aforementioned example. After the system displays several Italian restaurants, the user can further refine the results by saying “Are any of these expensive?” which utilizes the conversational approach.
1.2 Purpose
The goal of the user study is to optimize the naturalistic voice recognition navigation system for automotive use. By gathering consumer feedback on the operation of the system, analyzing it, and providing the information to CSAIL, the user experience can be improved. In addition to improving the human machine interface, by gathering users from different age groups and
genders, the effect of age and gender can be quantified. After measuring each user’s response via self-report surveys, audio recordings, and physiological data, the difficulty of system operation as well as the user response can also be quantified. If deemed to be successful, these design parameters can be used in future studies to determine the viability of new advanced systems.
2 Experimental Design
2.1 City Browser Interface
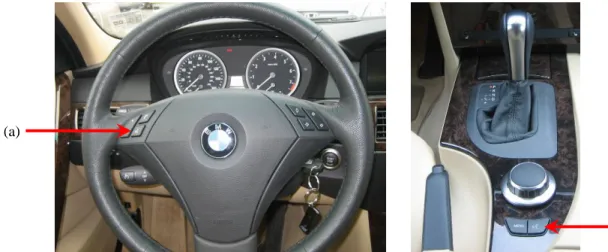
The version of City Browser used for this study is incorporated into a 2006 BMW 530xi sedan. The interaction with the user is via the car’s built in display located above the instrument panel, the sound system, and the iDrive controller located behind the gear shifter (see Figure 1).
(a)
(b)
Figure 1: Interior of vehicle (a) in-vehicle display; (b) iDrive controller
The user activates the system using one of two dedicated speech buttons: one located on the left side of the steering wheel and one located behind the iDrive controller (Figure 2).
(a)
(b)
Figure 2: Speech buttons (a) steering wheel speech button; (b) iDrive speech button
Speech is obtained through an array microphone attached to the driver’s sun visor (Figure 3).
Figure 3: Array microphone used to detect user’s voice
In addition to speech recognition, the user controls the system using the iDrive controller (Figure 1b). The controller spins both clockwise and counter-clockwise, moves laterally north, south, east, and west, and pushes down. Using these commands, the user can scroll through lists, move through various screens, and press down to select items. The features accessible by this
movement will be discussed later.
The two forms of feedback given to the user are auditory—from the vehicles sound system—and visual—using the vehicle’s built in display (Figure 3). Once the user speaks to the system, the system responds with an auditory command that does one of four things: properly answers the question posed; answers the question posed with incorrect information; asks the user for more information; states that it does not understand what was asked. The system also displays information on the car display related to the auditory command. As a system response, the
display shows a results screen of options for the user (Figure 4c). For example, if the user wishes to find restaurants near his/her current location, the system will display a screen with a list of all restaurants in the area along with a map showing their location. The screen remains unchanged if the system asks for more information or when the system states that it does not understand the last request.
When not speaking to the system, the user controls the display screen with the iDrive controller. The first screen is a map screen which shows a full map view of the area (Figure 4a). After a question is posed, the map screen shows the area near what was requested. The next available screen is the main screen (Figure 4b). It is on this screen where the user sees both a map of the area as well as the results list in response to what was asked of the system. Once an option from the list is selected, the results screen appears giving more detailed information on the selection (Figure 4c). The final screen is a help screen which gives context- based speech suggestions on what the user can say to the City Browser system (Figure 4d). The help screen is always
available, but after the system rejects the user input two times, suggestions automatically appear. For example, if the user asks the system for Italian restaurants, but the system rejects the user input, the system will automatically navigate the display to the help screen and display speech suggestions related to restaurants.
Figure 4: Screen shots of the in-vehicle display (a) map screen; (b) main screen; (c) results screen; (d) help screen
2.2 Data Collection
To gauge the subjects’ feedback on use of the City Browser system, three different forms of data are collected: self-report surveys/questionnaires, audio recordings, and physiological data.
Before the user interacts with the system, subjects are asked to complete a pre-experiment questionnaire (Appendix A). The questionnaire contains general questions about the subjects’ demographics such as gender, age, occupation, and income level. It also asks subjects about their general driving habits such as how many miles they typically drive in a year and which type of car they most drive. Since the focus of the project is on navigation systems, a good portion of the questionnaire asks the subjects about their experience using navigation systems as well as voice recognition systems. Even if subjects do not regularly use a navigation system, there are a variety of questions about technology usage which can serve as an indicator for their familiarity with advanced systems. As a self-report measure to gauge the subjects’ current state, the questionnaire ends with the “state” form of the State-Trait Anxiety Inventory which asks the subject about their current feelings such as satisfaction level, self-confidence, security, etc.
At the conclusion of the study, subjects also complete a post-experiment questionnaire (Appendix A). To compare the self-report measures of current state from the pre-experiment questionnaire, the first questions asked are about the subject’s feelings. The next set of questions refer to the subject’s feelings while using the navigation system as well as their general
impression of the system such as speed, clarity, accuracy, etc. The data from both surveys is inputted into SPSS—a statistical software program that analyzes trends of data.
In addition to the self-report measurements from the surveys, all audio is recorded during the course of the experiment while the subject is in the vehicle. In this way, each task can be
analyzed for the number of utterances required for completion as well as if the system response. Each utterance that is spoken for each task can also be analyzed for length, number of words, voice inflection, etc.
To monitor subjects’ bodily responses, physiological sensors are used to detect heart rate, skin conductance, and breathing rate. According to “Attaching Sensors and Checking Signal Quality for Physiological Monitoring”, an unpublished reference manual from the MIT AgeLab as well as a personal interview with Bruce Mehler, the Director of Applications and Development at NeuroDyne Medical Corporation, heart rate measurements are obtained using a
photoplethysmograph (PPG) sensor placed on the tip of the index finger on the left hand (figure 5).
Figure 5: Placement of PPG sensor
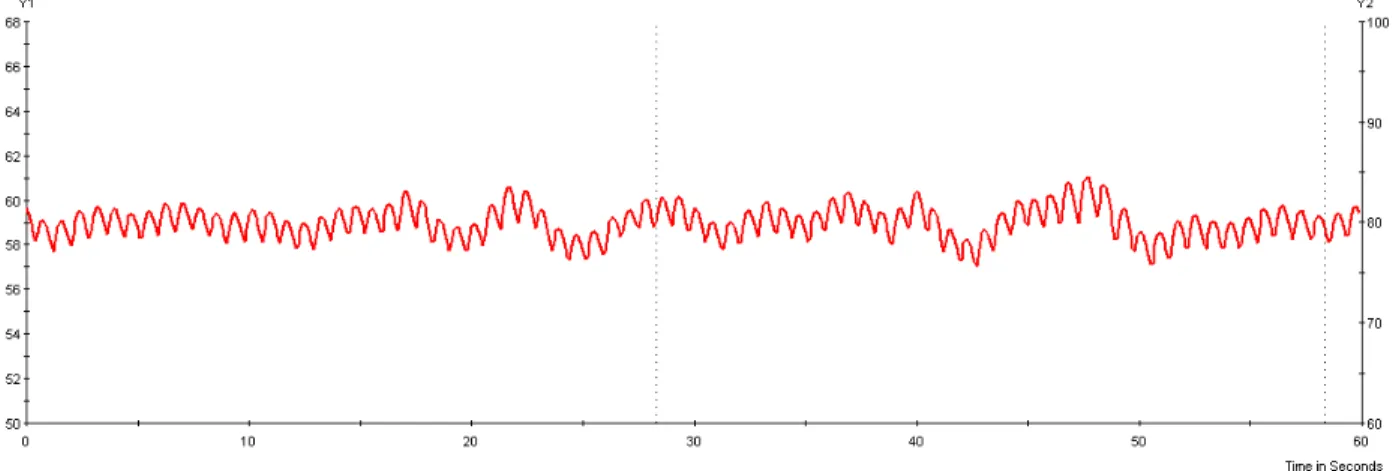
The PPG sensor contains an infrared light source which illuminates the skin and a photo detector which monitors the returning light. Since living tissue is transparent to infra-red and whole blood cells absorb light, as the volume of blood changes, the amount of light reflected back to the photo detector changes as well. The resulting waveform can then be monitored to observe the rise and fall of pulsatile blood flow with each heartbeat. An example waveform is given in Figure 5. The waveforms can then be analyzed to determine the interval between blood flow peaks and the resulting instantaneous heart rate.
Figure 6: Example of PPG waveforms
Electro dermal activity (also known as the galvanic skin response or GSR) is monitored as skin conductance. The electrical properties of the skin of the palms, fingers, and the soles of the feet change as sweat gland activity increases and decreases as a function of emotional arousal. These state changes are monitored by passing a small current through the skin and measuring changes in conductivity. By placing gold plated electrodes on the middle and ring finger of the left hand where sweat gland activity is high, the resulting emotional arousal is found by measuring the conductivity between the two fingers (Figure 6).
Figure 7: Placement of skin conductance sensors
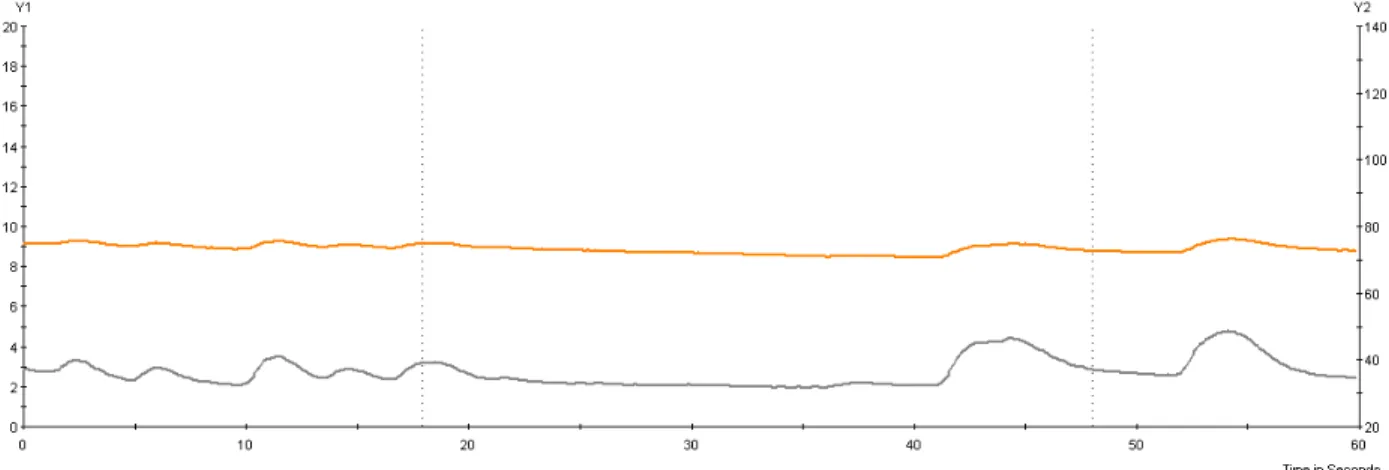
Both skin conductance level (SCL) and the derivative skin conductance response (SCR) are measured. SCL values are interpreted as a base level for arousal and SCR values are known to highlight momentary increases in activity. In the example graph below, the orange trace represents SCL and the gray trace is SCR.
Figure 8: Example of SCL and SCR graphs
Measurements for the subject’s breathing rate are acquired using a respiration belt. By placing the respiration belt below the subject’s rib cage, when a subject breathes, the tension in the belt changes (see figure 8).
Figure 9: Placement of breathing belt
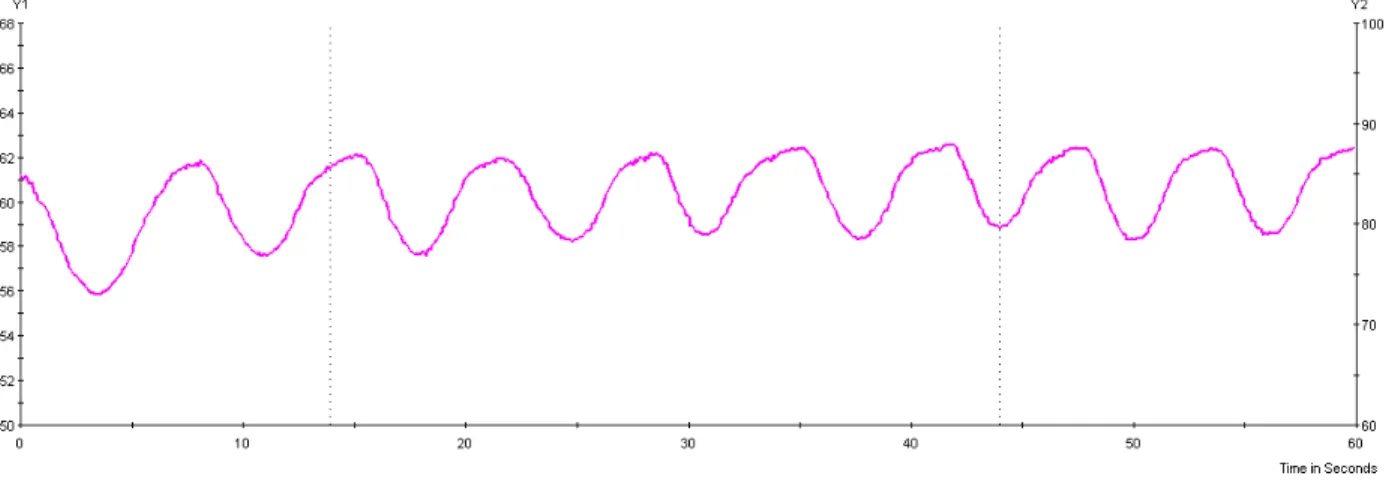
The cycle of breathing is captured with a varying resistance value that corresponds to tension changes. A graph of the breathing belt measurements is below. Dips in the graph indicate when the subject inhales while high peaks indicate when a subject has exhaled.
Figure 10: Example of graph produced from breathing belt
All three signals—PPG, skin conductance, and breathing rate—are processed using a MEDAC System /3 instrumentation unit and NeuGraph software (NeuroDyne Medical Corporation, Cambridge, MA) with a data sampling rate of 250 samples per second. While skin conductance and respiration are relatively slow moving signals, the high sampling rate was necessary to provide sufficient resolution of the PPG waveform for detecting wave peaks and consequently calculating heart rate (“Attaching Sensors”; Mehler).
2.3 Subject Selection and Recruitment
To evaluate the impact of age and gender on the device interaction, subjects are chosen from three different age groups: 25-34 years old, 45-54 years old and over 65 years of age. A
minimum age of 25 years old is selected in order to ensure that most subjects were out of college and into full-time careers or graduate school. From there, each age group spanned over 10 years with 10 years difference between each age group. Subjects are also recruited as to have an even gender balance. Since interaction with the system is for navigation purposes, each subject is required to have a valid driver’s license for over three years and to drive more than once a week. The speech recognition used for the City Browser system is currently optimized for recognizing
native English speakers and hence, subjects are required to have English as their first language. Individuals with pacemakers or taking beta-blocker medication are not allowed to participate since their heart rate response would be artificially induced.
2.4 Procedure
Once the subject arrives for the experiment, a research assistant gives him/her a basic outline of the City Browser experiment. After the subject listens to the overview and agrees to participate in the study, he/she is asked to read and sign an informed consent that is approved by the local institution review board. The informed consent provides a written description of the different stages of the experiment, risks to the subject, confidentiality, and exact measures recorded during the study. To provide an even greater benefit for automotive research, subjects are also asked to sign the Health Insurance Portability and Accountability Act (HIPAA) document that allows the data collected for the study to be released to researchers outside of MIT. This form is optional and is not required for participation in the study. In order to monetarily compensate participants for their participation, MIT requires information such as address and social security number for tax purposes. Next, the research assistant asks the subject a variety of question to ensure their eligibility for participation. If the subject does not meet the eligibility requirements or does not sign the informed consent, he/she cannot participate in the study.
After the research assistant verifies the eligibility requirements, the next step in the protocol is the placement of the physiological sensors. The first sensor to be attached is the respiration belt, followed by the PPG sensor and lastly, the skin conductance sensors. To allow the subjects to adapt to the sensors, they are asked to complete a pre-experiment questionnaire with the sensors already attached. In this way, any nervous feelings the subject has about wearing the sensors are allayed over time.
While the subject is completing the pre-experiment questionnaire, the research assistant begins to set up the vehicle for usage. Once the subject completes the questionnaire, the subject enters the instrumented vehicle. While in the vehicle, all audio is recorded. There are also two cameras in the vehicle that record the subject’s hand movement while using the iDrive system as well as
their facial response. The various navigation screens from the City Browser system are also recorded.
To introduce and instruct the subject on how to operate the City Browser system, he/she listens to an audio clip that describes the motions needed to complete tasks (Appendix B). If the subject has difficulty using the system during the training exercise, the research assistant clarifies in a way similar to an interactive tutorial—the subject cannot move on to the next part of the instructions until they demonstrate an understanding of the current material. After the training exercise, the research assistant gives the subject each of the ten tasks on note cards one at a time. Note cards were chosen over auditory commands from the research assistant as to not bias the subject’s pronunciation of the establishments. Each task asks the subject to find an
establishment, gather more information, and/or get directions (Appendix C). Two sample tasks are given in Table 1.
Table 1: Two tasks that subjects were asked to complete along with possible solutions (S indicates System; U indicates User)
Tasks You’re supposed to go to Chelmsford to meet a friend at a restaurant called Garlic Bistro. Find out their phone number, so you can call them to make a reservation.
Your aunt is in town and you want to take her to the Museum of Fine Arts. Get directions to the museum.
Possible Solutions
U: Show me restaurants in Chelmsford. S: There are 20 restaurants in
Chelmsford.
U: [Uses iDrive controller to browse the list and selects the Garlic Bistro.] S: Garlic Bistro is located at 121 Drum Hill Road in Chelmsford. It serves thai food. The phone number is 978-454-8336.
U: Find the Museum of Fine Arts in Boston.
S: The Museum of Fine Arts is located at 465 Huntington Avenue. The phone number is 617-267-9300.
U: Get directions there.
S: Here are driving directions from this location to the Museum of Fine Arts. [Shows directions on the map.]
For each participant, the tasks are given in the same order with a 25-second pause in between each task. The tasks are also ordered to vary the difficulty level between Easy and Hard with the first three tasks designed to help the subject become familiar with the system. The graph below displays the task difficulty.
Figure 11: Graph of task difficulty with a value of one meaning the task is Easy, a value of two to indicate the task is of Medium difficulty, and a value of three meaning the task is Hard
While completing the tasks, the research assistant sits in the back of the vehicle to monitor the physiological equipment and the subject’s performance. If after 3 minutes the subject makes no progression on completing a task, the research assistant asks the subject to move on to the next task. Once all ten tasks are given, the subject is given the post-experiment questionnaire. After the subject completes the questionnaire, the research assistant debriefs the subject and removes the physiological sensors. With the conclusion of the experiment, the research assistant
compensates the subject for his/her time and travel and is able to give general feedback on the subject’s performance as well as answer any general questions the subject may have.
2.5 Pilot Study
Before the experimental study took place with subjects from the greater Boston area, a small pilot study was conducted with 33 participants from the local MIT community. The goal of the pilot study was to gain initial feedback on the system as well as the protocol to improve the system before full-scale use. The subject population consisted of 22 females and 11 males of whom 13 were college-age students (ages 19-21), 10 were post-college age adults (ages 22-30), and 10 were middle-aged adults (ages 40-56). During this pilot study, subjects went through a similar protocol as described in section 2.3. However, subjects were not asked to sign the HIPAA
consent nor the payment form because they were not compensated. They also were asked to complete twelve tasks instead of ten.
The results of the pilot study indicated that 24 subjects completed all 12 tasks, five subjects completed 11 tasks, one subject completed 10 tasks and two subjects completed five tasks. Most participants enjoyed using the system and the biggest complaint was the sound from the speech synthesizer. A total of 396 tasks were presented requiring 1651 utterances. The speech
recognition word error rate was 31.9% when all utterances were included. If the two subjects who completed five tasks are excluded, the speech error rate was reduced to 26.4%. Overall, subjects completed most of the tasks with ease, but a few tasks presented some difficulty.
The goal of the task arrangement was to orient the subjects to the system at first and then vary the difficulty between hard and easy in the subsequent tasks. The outcome of the pilot study indicated that the original task ordering was not as predicted and hence, the tasks were reordered for the experimental study. In addition to the reordering of tasks, two tasks were deleted in order to shorten the overall length of the experiment. By analyzing these same parameters as well as the self-report responses from surveys and physiological measurements with a larger sample size, the subject’s interaction with the system should be able to be grouped depending on subject demographics.
3 Results
3.1 Survey Responses
Using 12 subjects from each demographic group, a total of 72 subjects were analyzed from the original subject pool which contained over 90 participants. Even though the minimum
requirement was for each subject to drive at least once a week, 75% of the subjects drove between five to seven days a week. In addition to driving experience, most subjects also had a fair amount of experience with technology. All but one subject used a computer and over 80% of subjects went online using a computer more than twice a day. Ninety-seven percent of subjects used a cell phone with the majority of them using it at least once a day. However, the subject pools experience with voice recognition systems was not as favorable. Thirty-four percent of subjects encountered voice recognition system between one to four days a week and 38% encountered them a few days a month.
Of all of the subjects who participated, only 30% already owned a navigation system. Of those 30%, the vast majority of them owned portable, touch-screen, after-market navigation systems. Only one subject operated their navigation system using voice activation. Subjects tended to use their navigation system when traveling to unfamiliar places or on personal trips. Eighty-four percent of subjects also prefer to receive directions both verbally and visually.
After interacting with the City Browser system, the majority of subjects had mixed feelings about their interaction with the system according to the results of question three of the post-experiment questionnaire (Appendix A). With a value of one meaning not at all and ten meaning all of the time, values of six and above were assumed to mean they agreed with the statement. A summary of the subjects response broken into demographic groups are in the table below.
Table 2: Number of subjects who agreed with feelings toward the system’s interaction; subjects rated each feeling using a 1-10 scale with a value of one indicating “not at all” and ten indicating “all of the time”; values of six and above were deemed to mean the subject was in agreement with the statement
Demographic Group
Feeling Total 25-24 year
old Males 25-34 year old Females 45-54 year old Males 45-54 year old Females 65-74 year old Males 65-74 year old Females Confused 13 (18%) 1 3 2 0 3 4 Excited 28 (39%) 4 6 8 4 2 4 Bored 5 (7%) 1 1 1 0 2 0 Frustrated 24 (34%) 2 5 5 4 4 4 Curious 61 (86%) 11 9 12 11 8 10 Rushed 9 (13%) 2 0 2 1 2 2 Interested 62 (87%) 10 8 11 11 11 11 Surprised 39 (55%) 9 4 7 10 6 3 Irritated 17 (24%) 1 5 2 2 3 4
In addition to asking about the subject’s feelings toward the system, question nine of the post-experiment questionnaire asked to indicate if they agreed or disagreed with statements
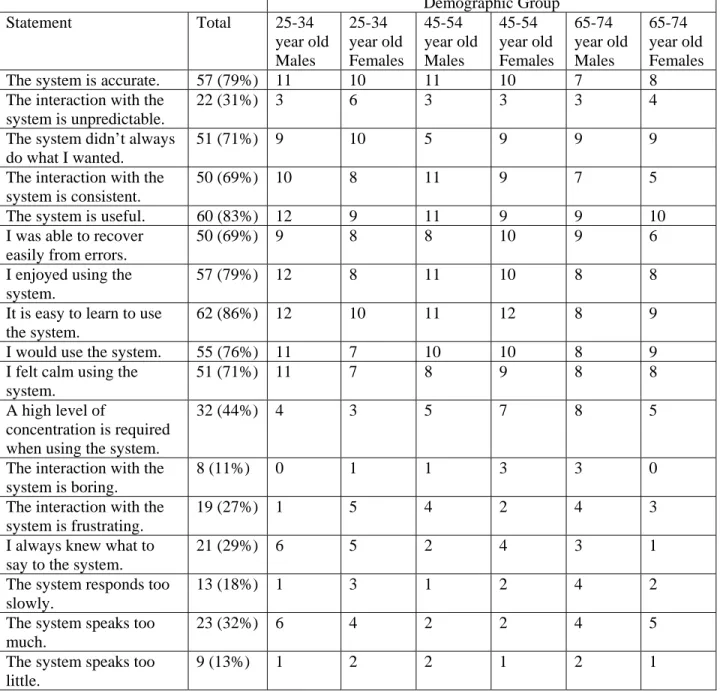
concerning general aspects of the system. With a value of one indicating that the subject strongly agreed and seven indicating the subject strongly disagreed, values of three and below were interpreted as an agreement with the statement. A summary of the subject’s responses are in the table below.
Table 3: Number of subjects who agreed with statements concerning system’s interaction; subjects rated each statement using a 1-7 scale with a value of one indicating “strongly agree” and seven indicating “strongly disagree”; values of three and below were deemed to mean the subject was in agreement with the statement
Demographic Group Statement Total 25-34 year old Males 25-34 year old Females 45-54 year old Males 45-54 year old Females 65-74 year old Males 65-74 year old Females
The system is accurate. 57 (79%) 11 10 11 10 7 8
The interaction with the system is unpredictable.
22 (31%) 3 6 3 3 3 4
The system didn’t always do what I wanted.
51 (71%) 9 10 5 9 9 9
The interaction with the system is consistent.
50 (69%) 10 8 11 9 7 5
The system is useful. 60 (83%) 12 9 11 9 9 10
I was able to recover easily from errors.
50 (69%) 9 8 8 10 9 6
I enjoyed using the system.
57 (79%) 12 8 11 10 8 8
It is easy to learn to use the system.
62 (86%) 12 10 11 12 8 9
I would use the system. 55 (76%) 11 7 10 10 8 9
I felt calm using the system.
51 (71%) 11 7 8 9 8 8
A high level of
concentration is required when using the system.
32 (44%) 4 3 5 7 8 5
The interaction with the system is boring.
8 (11%) 0 1 1 3 3 0
The interaction with the system is frustrating.
19 (27%) 1 5 4 2 4 3
I always knew what to say to the system.
21 (29%) 6 5 2 4 3 1
The system responds too slowly.
13 (18%) 1 3 1 2 4 2
The system speaks too much.
23 (32%) 6 4 2 2 4 5
The system speaks too little.
9 (13%) 1 2 2 1 2 1
Question four of the post-experiment questionnaire also asked subjects if they liked each separate aspect of the system—the iDrive knob, the in-vehicle display, and the voice from the speech synthesizer. With a value of one indicating the subject disliked the device and a value of ten indicating the subjects liked the device, values of six and above were interpreted as liking the device. A summary of responses are in the table below.
Table 4: Number of subjects who approved of the system components; subjects rated each component using a 1-10 scale with a value of one indicating “strongly dislike” and ten indicating “strongly like”; values of six and above were deemed to mean the subject liked the component
Demographic Group
Device Total 25-34 year
old Males 25-34 year old Females 45-54 year old Males 45-43 year old Females 65-74 year old Males 65-74 year old Females Display 50 (70%) 10 8 9 7 9 7 Knob 55 (77%) 10 9 11 9 9 7 Voice 10 (14%) 0 1 2 4 3 0
Since the experiment was carried out in a parking lot under non-driving conditions, question ten of the post-experiment questionnaire also asked subjects how difficult they perceived the tasks to be compared to normal driving conditions. With a value of one indicating that the subject
believed the tasks were not at all difficult and a value of ten indicating that the tasks were very difficult, values of six and above were deemed as difficult. A summary of the responses are in the table below.
Table 5: Number of subjects who stated the tasks were difficult compared to normal driving tasks; subjects rated the difficulty using a 1-10 scale with a value of one indicating “not at all difficult” and ten indicating “very difficult”; values of six and above were deemed difficult
Total Number of Subjects
Overall 22 (32%)
25-34 year old Males 3 25-34 year old Females 5 45-54 year old Males 4 45-54 year old Females 2 65-74 year old Males 5 65-74 year old Females 3
3.2 Utterance Transcription Analysis
For task completion, once again, 12 subjects from each demographic group were chosen to be analyzed for a total of 72 subjects. Each task is considered complete if the subject is able to achieve the objective displayed on each note card. Below is a graph showing the number of subjects who completed each tasks separated by age and gender.
Figure 12: Number of subjects who completed each task separated by demographic group
In addition to task completion, audio recordings revealed the number of utterances per task. As stated before, the system responds to the user with an auditory command that does one of four things: properly answers the question posed; answers the question posed with incorrect
information; asks the user for more information; or states that it does not understand what was asked. By labeling the responses that ask the user for more information as correct and labeling the responses stating the system did not understand as rejections, there are three possible outcomes for every utterance: correct, incorrect, or reject. In this way, the number of utterances per task can be counted and analyzed according to the system response.
In a similar manner as task completion, there were 71 subjects analyzed: 12 subjects according to age and gender with the exception of the 45-54 year old female group which had 11 subjects. Overall, there were 1405 utterances spoken with an average of 3.6 utterances per task. The response accuracy—ratio of correct responses to total responses—was 54.8% and the word error
rate—ratio of errors to total number of words in each utterance—was 32.9%. Below is a graph showing the system response (correct, incorrect, or reject) in terms of the average number of utterances per task. Assuming that the number of utterances per task corresponds to the difficulty of each task, the graph in Figure 13 can also be used as a measure of task difficulty to compare to Figure 11.
Figure 13: Average number of utterances per task separated by system response
The system response was also broken down into demographic groups to determine which group spoke the most utterances per task. Below is a graph summarizing the results.
Figure 14: Average number of utterances per task separated by demographic group
A table summarizing the average difference in terms of system response per gender is below. The average number of utterances of females was subtracted from the average number of utterances by males. A negative number indicates that males had fewer utterances than females and vice versa. A more detailed table including the system response per demographic group and per task is in Appendix D.
Table 6: Average difference in system response utterances between genders; a negative value indicates that makes had fewer utterances than females
Demographic Group 25-34 Year Olds (Males-Females) 45-54 Year Olds (Males-Females) 65-74 Year Olds (Males-Females) Total (Males-Females) Correct 0.2833 0.1212 -0.325 -0.1788 Incorrect -0.5583 -0.1129 -0.083 -0.7378 Reject -0.6833 -0.5379 -0.192 -1.2962 Total -0.9583 -0.5296 -0.6 -2.2129 29
3.3 Physiology Analysis
As a pilot study, six subjects from each demographic group were analyzed according to their physiological measures, in particular heart rate. With this data, it is hoped to find a correlation between increased task difficulty and increased heart rate. Below is a table summarizing the average heart rate in beats per minute per subject and per task. A more detailed table with exact heart rates for every subject is in Appendix E.
Table 7: Average heart rate (in beats per minute) per task separated into demographic groups
Task Number Demographic Group 1 2 3 4 5 6 7 8 9 10 25-34 Year Old Males 71.26 72.26 79.85 72.37 71.99 72.41 71.28 72.39 72.82 72.83 25-34 Year Old Females 82.77 79.47 78.95 80.88 79.76 79.73 80.68 80.01 79.47 79.89 45-54 Year Old Males 83.54 81.53 72.87 78.99 79.04 81.59 81.42 81.54 80.76 79.45 45-54 Year Old Females 67.77 67.38 71.06 67.26 66.58 67.32 66.68 67.55 66.46 66.35 65-74 Year Old Males 73.17 72.96 72.02 72.17 72.00 72.32 71.71 73.94 72.79 73.78 65-74 Year Old Females 73.73 73.23 67.03 73.24 72.44 72.75 71.85 72.35 71.79 70.68
A few heart rates spikes or dips such occurred during the 3rd task for all groups except the 25-34 year old females and the 65-74 year old males. This can be explained with a simple error during the data editing process.
4 Discussion
4.1 Discussion of Results
According to the feelings associated with the system from the self-report responses in Table 2, most subjects were generally pleased with the system. Less than a quarter of all subjects felt confused, bored, rushed, or irritated with the system. In addition, more than half of all subjects felt curious, interested, and surprised with the system interaction. In particular, 45-54 year old males seemed more curious, excited, and interested with the system than other participants did.
Concerning statements regarding the system interaction presented in Table 3, overall, subjects said the system was accurate, useful, enjoyable, and easy to learn. It also appears as if 45-54 year old males as well as 25-34 year old males had a slight affinity toward the system. At the same time, many subjects also said the system did not always do what they wanted and only a small percentage of people actually felt as if they knew what to say to the system. This could indicate that even though the system is resourceful and inventive, the actual accuracy of the system response needs to be improved.
With respect to each component of the system, nearly a 75% majority of participants liked both the in-vehicle display and the iDrive knob. However, less than 25% of the participants liked the sound of the voice from the speech synthesizer (Table 4). On the comments section of the post-experiment questionnaire, more than one participant stated that the voice sounded like that of a non-native English speaker.
One of the most important questions asked on the post-questionnaire required the subjects to compare the task difficulty with everyday driving. Thirty-two percent of subjects said the tasks were more difficult than everyday driving (Table 5), and 44% of subjects stated that the system required a high level of concentration (Table 3). At the same time, many people commented that in order to properly operate the system while driving, they would have to pull the car off the road.
In terms of task completion, subjects had the most difficulty completing task number two and task number six. Task number 2 was difficult because subjects were still become familiar with the system and the system had trouble recognizing the word Indian—not the fault of the user. Task six proved to be the most difficult because it required the system to understand an exact address, find directions to that address, and find a nearby restaurant. This task required the most work from the user as well as the system because more than one utterance was needed to
complete the task and because each utterance was linked to another. Task number one was the next most difficult task in terms of completion because it is the first time the user interacts with the system without the help of the tutorial or the research assistant. Tasks number four, eight, and nine proved to be of medium difficulty because it sometimes required the user to say the exact name of an establishment. Tasks five and seven were of the same difficulty because they
required the user to do the same thing twice—find directions to a museum. Task ten was found to be one of the easiest task because by the time the subject reaches task ten, he/she most likely feels very comfortable with the system. Task three proved to be the easiest task because it asked the user to do almost an identical operation as required during the training exercise.
In regards to the system response, the response accuracy of the system was only 54.8% which indicates that the system only responded correctly around half of the time. This tendency for only a fair system response negatively influenced the user’s self-report ratings of the system. At the same time, a portion of the low response accuracy can be accounted for by simple errors such as releasing the speech button before the sentence is completed or by mispronunciations of words due to regional accents. The general trend with response accuracy was for the system to reject or respond with an incorrect answer around half of the time except for task three where the response accuracy was much higher. The higher response accuracy for task three is most likely because task three is almost identical to the training exercise.
With respect to gender, Table 6 demonstrates the fact that males performed better than females in terms of yielding correct responses from the system. This could indicate that the system favors the pitch and tone of the male voice over that of females. At the same time, the fact that males performed better than females can also indicate that males pronounce their words more clearly. The difference in system response across different ages shows that 25-34 year olds spoke fewer
utterances per task than both the 45-54 and 65-74 year olds—who each spoke roughly the same number of utterances per task (Appendix D).
The physiological data was expected to show a positive correlation with task difficulty, i.e.—an increased heart rate equals a more difficult task, but according to the average heart rate
information from Table 7, that was not the case. If the sudden jumps during task three are ignored, the average heart rate across all demographic groups stayed very constant through all ten tasks. In fact, all demographic groups besides the 25-34 and 65-74 year old males showed a slight decrease in heart rate as time progressed. This is probably because the subjects were becoming more familiar with the operation of the system. Since the original assumption was that there was a positive correlation with task difficulty and heart rate, a relatively stable heart rate could indicate that the workload also remained stable.
4.2 Conclusion
Currently, there are not many products on the market similar to City Browser and hence, the development of such a system is necessary to the future of the navigation system market. The self-report questionnaires indicate that the users believe the system is very useful and inventive with its goal of providing a naturalistic and conversational navigation system. A few specific components of the system such as the voice from the speech synthesizer need to be improved. The user interface also needs to be more intuitive in that many subjects felt that a high level of concentration was required to operate the system. In addition, the system also has a tendency to favor the voice of young to middle aged males over females. In terms of using physiological recordings as a design measure, further testing and analysis with the equipment need to be pursued. The overall results indicate that the automobile could be an appropriate environment for the City Browser system once it is refined. However, since the typical drivers of mid size luxury vehicles are middle-aged to older males, if the system was targeted for this demographic, less development is necessary.
The City Browser user study can also have an even greater benefit to the automotive industry. Normally, when a consumer purchases a new vehicle with advanced technology, their main form
of instruction is via the car manual. One of the benefits of this study was the introduction audio that was played for subjects to instruct them on how to use the system. If a similar interactive tutorial was provided for consumers who purchase new vehicles, the learning curve for such systems could be greatly decreased.
4.3 Future Work
After the conclusion of the City Browser experimental study, there have been interests in many areas of future research. In addition to recording the task completion as well as the number of utterances per task, the amount of time it takes to complete a task was also monitored. This data can then be compared across demographic groups to determine task difficulty. With the
physiological measures, only average heart rate across demographic groups was analyzed to observe how it compared to task difficulty. To further analyze the task difficulty, each subject’s heart rate along with their skin conductance and breathing rate can be correlated with task completion and difficulty on a case by case basis. In this way, a more in-depth analysis using physiological measures as an indicator of task difficulty can be constructed. Since a potion of both the pre and post-questionnaire surveys are dedicated to recording the subject’s feelings, a comparison between the two surveys could yield a correlation with the subject’s success with the system. For example, if the subject’s feelings were more negative on the post-experiment
questionnaire than on the pre-experiment questionnaire, then it could indicate that the subject was not successful or that it required more utterances in order to complete the tasks or that the subject had an increased heart rate or breathing rate while completing the tasks.
Before the system can be released for wide scale use, another study needs to be conducted with more subjects from a wider age range that allows users to utilize the system under real driving conditions such as traffic, interstate highways and through neighborhoods. Video recording equipment that tracks eye gaze movement should also be included to measure how many times the user must look away from the road in order to operate the system. In addition to another study, the system should be expanded as to include more than just restaurants, hotels, museums, and subway stations in the greater Boston area. Points of interests such as gas stations and public parking should be added as well as a larger geographic area which users can search. More areas
of future research are also discussed in City Browser: Developing a Conversational Automotive HMI, a paper from the proceedings of the Conference on Human Factors in Computing Systems.
References
“Attaching Sensors and Checking Signal Quality for Physiological Monitoring”, Unpublished Manual. MIT AgeLab. 9 Feb. 2007.
Coughlin, Joseph. “Not Your Father’s Auto Industry? Aging, the Automobile, and the Drive for Product Innovation. Generation: Journal of the American Society on Aging. 2004-2005: 38-44.
Gruenstein, Alexander, et al. City Browser: Developing a Conversational Automotive HMI. Proc. of Conference on Human Factors in Computing Systems. 4 April-9 April 2009, Boston, MA. 2009.
Mehler, Bruce. Personal interview. 2 April 2009.
Meyer, Joachim. “Designing In-Vehicle Technologies for Older Drivers.” The Bridge. Spring 2009: 21-26.
6 Appendix Appendix A: Questionnaires
Pre Experiment Questionnaire
Please fill in blanks or circle the one best response unless otherwise noted. If more space is needed, please note the question number and continue on the back of each sheet. Remember, filling out this questionnaire is voluntary. Skipping any question that makes you feel
uncomfortable will not exclude you from the study.
Health Information
1. What is your date of birth? _________ (month / year) 2. Are you: MaleFemale
3. Thinking about how you feel today, how would you describe your current physical well-being? a. Excellent b. Very Good c. Good d. Fair e. Poor
4. Thinking about how you feel today, how would you describe your current mental well-being? a. Excellent b. Very Good c. Good d. Fair e. Poor
5. Have you been diagnosed with high blood pressure? Yes (Please continue with Question 5a)
No (Please go to Question 6)
5.a If yes, are you taking medications for the treatment of this condition?
Yes No
5.b If yes, what is the name of the medicine? __________________________
5.c Is the medicine a beta-blocker? Yes No 6. On a scale of 1 to 10 with 1 being very awake and 10 being extremely drowsy, how do
you feel right now?
1 2 3 4 5 6 7 8 9 10 Very Extremely Awake Drowsy
Driving History
7. How often do you drive a car or other motor vehicle?a. 5 - 7 days a week b. 1 - 4 days a week c. A few days a month d. A few times a year e. Never
8. Over the last year how many miles did you drive? a. Under 1000 b. Between 1001 and 5000 c. Between 5001 and 10000 d. Between 10001 and 15000 e. Between 15001 and 20000 f. Over 20000
g. None (Please inform the research assistant) h. I don’t know
Questions About Vehicles You Have Driven
9. Please indicate the make, model and year of the vehicle(s) that you currently drive and the approximate number of years you have owned / driven it? (Please start with the car you drive most often; multiple cars can be listed.)
Make (e.g., Toyota) Model (e.g., Prius) Year (e.g., 2004) Years driven (e.g., 1)
10. Do you own a navigation (GPS) system? a. Yes (Skip to Question 13) b. No
11. Have you considered purchasing a navigation (GPS) system? a. Yes
b. No
12. Please describe why you haven’t purchased a GPS system.
________________________________________________________________________ ________________________________________________________________________ ________________________________________________________________________ ________________________________________________________________________
If you don’t use a GPS system, please skip to Question 25
Please answer the following questions with respect to the navigation system that you use most often.
13. Is the navigation system you use a portable system (e.g., Garmin, Magellan, TomTom, iPhone, Blackberry, cell phone), a factory system installed from the manufacturer, or an aftermarket device that was installed after the vehicle was purchased?
a. Portable
b. Factory installed
c. Installed as an aftermarket device
14. Is the navigation system in the car you drive most often? a. Yes
b. No
15. How often do you use your navigation system? a. Every day
b. Several times a week c. Several times a month d. Less than once a month e. Never
16. How often do you input destinations into your navigation system while you are actually driving?
a. Always b. Often
c. Occasionally d. Never
e. My system does not allow me to enter destinations while my car is in drive 17. How do you enter destination information into the navigation system? (If your system
allows several ways, please indicate your preferred method.) a. Touch Screen
b. Voice activation c. Keypad
d. Rotating input device
e. Buttons on dashboard or navigation system
f. Other (please specify):______________________________
18. Which scenario best describes when you use your navigation system (circle all that apply):
a. Everyday driving such as short familiar trips b. When traveling to unfamiliar places
c. When taking long trips (over an hour) d. Finding different routes to avoid traffic
e. Finding destinations for work as my job requires me to travel f. Personal trips and travel
g. Points of interest such as hotels, restaurants, etc.
h. Other (please specify): _____________________________
19. How would you prefer to receive driving directions from your navigation system? a. Verbal directions from the navigation system
b. Visual directions from the display of the navigation system c. Both verbally and visually
20. Does your navigation system allow you to search for places of interest? a. Yes
b. No (Skip to Question 24)
c. I don’t know (Skip to Question 24)
21. Do you ever use your navigation system to search for places of interest? a. Often
b. Occasionally c. Never
22. On a scale of 1 to 7 where 1 is very easy and 7 is very difficult, how easy is it to use your navigation system?
1 2 3 4 5 6 7
Very Easy Very
Difficult
23. On a scale of 1 to 7 where 1 is not at all frustrating and 7 is very frustrating, how frustrating is it to use the navigation system in your car?
1 2 3 4 5 6 7
Not at all Very
frustrating frustrating
24. How often are you satisfied with the results your navigation system gives you? a. Always b. Often c. Occasionally d. Never
Technology Experience
25. On a scale of 1 to 10 with 1 being very inexperienced and 10 being very experienced, how would you rate your experience with technology?
1 2 3 4 5 6 7 8 9 10
Very Very Inexperienced
Experienced
26. Do you use a cell phone? a. Yes
b. No (Skip to question 28) 27. How often do you use a cell phone?
a. More than five times a day
b. Daily, but fewer than five times a day c. A few times a week
d. A few times a month e. Only for emergencies 28. Do you use an mp3 player or iPod?
a. Yes
b. No (Skip to question 30)
29. How often do you use an mp3 player or iPod? a. Daily
b. A few times a week c. A few times a month d. A few times a year 30. Do you use a computer?
a. Yes
b. No (Skip to question 33)
31. How often do you use a computer? a. More than twice a day b. Once or twice a day c. Almost every day d. A few times a week e. A few times a month f. A few times a year g. Less than once a year 32. How often do you go online?
a. More than twice a day b. Once or twice a day c. Almost every day d. A few times a week e. A few times a month f. A few times a year g. Less than once a year h. Never
33. Please circle all of the kinds of voice recognition systems you have previously interacted with:
a. Using directory assistance over the telephone
b. Using voice activation to place a call through an in car phone system c. Using voice activation to place a call through your cell phone
d. While placing a call to customer service e. While placing a phone order
f. While asking for an address or point of interest while using a navigation system g. Other (please specify)__________________
34. How often do you encounter voice recognition systems (e.g., automated caller directories, in vehicles, on the PC, directory assistance, etc.)?
a. Multiple times a day b. 5 – 7 days a week c. 1 – 4 days a week d. A few days a month e. A few times a year
f. Less than a few times a year
35. On a scale of 1 to 10, with 1 being very unsatisfied and 10 being very satisfied, how satisfied are you with your experiences with voice recognition systems?
1 2 3 4 5 6 7 8 9 10
Very Very
Unsatisfied
Satisfied
Demographics
36. Please describe the highest level of formal education you have completed: a. Some high school
b. High school graduate c. Some college
d. College graduate
e. Some graduate education
f. Completed graduate or professional degree (e.g., MA, MS, MBA) 37. Are you: (Please circle all that apply)
a. A full time student b. A part time student c. Unemployed d. Retired
e. Employed full time f. Employed part time
g. Full time caregiver (e.g. children or elderly) h. Part time caregiver (e.g. children or elderly) 38. Are you:
a. Married b. Divorced c. Widowed
d. Single living with partner e. Single never married
39. What best describes your total household income? a. Less than $25,000 b. $25,000 – $49,999 c. $50,000 – $74,999 d. $75,000 – $99,999 e. $100,000 – $124,999 f. $125,000 – $149,999 g. $150,000 or more h. I don’t know
Current State
40. A number of statements which people have used to describe themselves are given below. Read each statement and then circle the appropriate number to the right of the statement to indicate how you feel right now, that is, at this moment. There are no right or wrong answers. Do not spend too much time on any one statement but give the answer which seems to
describe your present feelings best.
Not at all Somewhat Moderately so Very much so a. I feel calm……….. 1 2 3 4 b. I feel secure………... 1 2 3 4 c. I am tense……….. 1 2 3 4 d. I feel strained……… 1 2 3 4 e. I feel at ease……….. 1 2 3 4 f. I feel upset………. 1 2 3 4
g. I am presently worrying over possible
misfortunes……… 1 2 3 4 h. I feel satisfied……… 1 2 3 4 i. I feel frightened……….. 1 2 3 4 j. I feel comfortable……… 1 2 3 4 k. I feel self-confident……… 1 2 3 4 45
Not at all Somewhat Moderately so Very much so l. I feel nervous……….. 1 2 3 4 m. I am jittery………. 1 2 3 4 n. I feel indecisive……….. 1 2 3 4 o. I am relaxed……… 1 2 3 4 p. I feel content………... 1 2 3 4 q. I am worried……… 1 2 3 4 r. I feel confused………. 1 2 3 4 s. I feel steady………. 1 2 3 4 t. I feel pleasant………... 1 2 3 4
41. On a scale of 1 to 10 where 1 is not at all stressed and 10 is very stressed, how would you rate your stress level right now?
1 2 3 4 5 6 7 8 9 10
Not at all Very Stressed
Stressed
Post Experiment Questionnaire
Please circle the one best response. Remember, filling out this questionnaire is voluntary. Skipping any question that makes you feel uncomfortable will not exclude you from the study.
1. On a scale of 1 to 10 where 1 is not at all stressed and 10 is very stressed, how would you rate your stress level right now?
1 2 3 4 5 6 7 8 9 10
Not at all Very Stressed Stressed
2. A number of statements which people have used to describe themselves are given below. Read each statement and then circle the appropriate number to the right of the statement to indicate how you feel right now, that is, at this moment. There are no right or wrong answers. Do not spend too much time on any one statement but give the answer which seems to describe your present feelings best.
Not at all Somewhat Moderately so Very much so a. I feel calm……….. 1 2 3 4 b. I feel secure………... 1 2 3 4 c. I am tense……….. 1 2 3 4 d. I feel strained……… 1 2 3 4 e. I feel at ease……….. 1 2 3 4 f. I feel upset………. 1 2 3 4
g. I am presently worrying over possible
misfortunes……… 1 2 3 4 h. I feel satisfied……… 1 2 3 4 i. I feel frightened……….. 1 2 3 4 j. I feel comfortable……… 1 2 3 4 k. I feel self-confident……… 1 2 3 4 l. I feel nervous……….. 1 2 3 4 47
Not at all Somewhat Moderately so Very much so m. I am jittery………. 1 2 3 4 n. I feel indecisive……….. 1 2 3 4 o. I am relaxed……… 1 2 3 4 p. I feel content………... 1 2 3 4 q. I am worried……… 1 2 3 4 r. I feel confused………. 1 2 3 4 s. I feel steady………. 1 2 3 4 t. I feel pleasant………... 1 2 3 4
Using the Navigation System
3. On a scale of 1 to 10, with 1 meaning did not feel at all affected and 10 meaning severely affected, please indicate how often you felt affected by each of the following while completing the tasks:
Not at all All of the time
a. Confused 1 2 3 4 5 6 7 8 9 10 b. Excited 1 2 3 4 5 6 7 8 9 10 c. Bored 1 2 3 4 5 6 7 8 9 10 d. Frustrated 1 2 3 4 5 6 7 8 9 10 e. Curious 1 2 3 4 5 6 7 8 9 10 f. Rushed 1 2 3 4 5 6 7 8 9 10 g. Interested 1 2 3 4 5 6 7 8 9 10 h. Surprised 1 2 3 4 5 6 7 8 9 10 i. Irritated 1 2 3 4 5 6 7 8 9 10 48
4. Thinking about using the navigation system, on a scale of 1 to 10, with 1 being disliked, 5 being neutral and 10 beingliked, please indicate how much you liked or disliked each of the following:
Disliked Neutral Liked
a. The display 1 2 3 4 5 6 7 8 9 10
b. The rotational knob 1 2 3 4 5 6 7 8 9 10 c. The sound of the
voice 1 2 3 4 5 6 7 8 9 10
5. On a scale of 1 to 10 with 1 being very clear and 10 being very confusing, how clear were the instructions you received on the system?
1 2 3 4 5 6 7 8 9 10
Very Very
Clear Confusing 6. On a scale of 1 to 10 with 1 being very easy and 10 being very difficult, how easy was it
to get the information you requested?
1 2 3 4 5 6 7 8 9 10
Very Very
Easy Difficult
7. On a scale of 1 to 10 where 1 is not well at all and 10 is very well, how well do you feel the system understands what you’re saying?
1 2 3 4 5 6 7 8 9 10
Not Very Well Well
8. How would you best describe the speed of the system? a. Very slow b. Slow c. Just right d. Very quick e. Too fast 49
9. On a scale of 1 to 7, with 1 being strongly agree and 7 being strongly disagree, how much do you agree or disagree with the following statements.
Strongly Strongly Agree Disagree a. The system is accurate 1 2 3 4 5 6 7 b. The interaction with the system is unpredictable 1 2 3 4 5 6 7 c. The system didn't always do what I wanted 1 2 3 4 5 6 7 d. The interaction with the system is consistent 1 2 3 4 5 6 7 e. The system is useful 1 2 3 4 5 6 7 f. I was able to recover easily from errors 1 2 3 4 5 6 7 g. I enjoyed using the system 1 2 3 4 5 6 7 h. It is easy to learn to use the system 1 2 3 4 5 6 7 i. I would use this system 1 2 3 4 5 6 7 j. I felt calm using the system 1 2 3 4 5 6 7 k. A high level of concentration is required when using
the system
1 2 3 4 5 6 7
l. The interaction with the system is boring 1 2 3 4 5 6 7 m. The interaction with the system is frustrating 1 2 3 4 5 6 7 n. I always knew what to say to the system 1 2 3 4 5 6 7 o. The system responds too slowly 1 2 3 4 5 6 7 p. The system speaks too much 1 2 3 4 5 6 7 q. The system speaks too little 1 2 3 4 5 6 7
10. On a scale of 1 to 10 with 1 being not at all and 10 very much, how difficult were these tasks on average compared to things you usually do while driving?
1 2 3 4 5 6 7 8 9 10
Not at All Difficult
Very Difficult 11. In purchasing a new car, rank the four features below in order of importance, where 1 is
the most important feature in purchasing a new car and 4 being the least important:
Value/price _________
Brand recognition _________
Performance (safety, driving, etc) _________ State of the art electronics (navigation, stereo, hands
free cell phone, etc) _________
12. Would you consider purchasing an aftermarket portable navigation system such as a Garmin, TomTom, Magellan, etc.?
a. Yes b. No c. Maybe
d. I already own such a device
13. Would you consider purchasing a cell phone with navigation and points of interest capabilities such as an iPhone or a BlackBerry?
a. Yes b. No
c. My current cell phone already has this capability
14. Would any of the following reasons keep you from purchasing a factory installed navigation system in your next car? (Please circle all that apply.)
a. Additional cost
b. Already own a portable system
c. Not necessary, I know where I’m going
d. Other (please specify): _____________________________________ e. None of these reasons would keep me from purchasing such a system 15. How much did the sensor equipment distract you from focusing on the tasks?
a. Not at all b. A little bit c. Quite a bit d. All of the time
16. How much stress did you feel from having the sensor equipment on your body? a. No stress at all
b. Some stress
c. Quite a bit of stress d. Extreme stress
17. How nervous did having the sensor equipment attached to you make you feel while you were completing the tasks?
a. Not nervous at all b. Somewhat nervous c. Quite nervous d. Extremely nervous
18. Please use the space below to write any additional comments or suggestions you have regarding your experiences in today’s study.
_____________________________________________________________
_____________________________________________________________
_____________________________________________________________
_____________________________________________________________
Appendix B: Training Exercise Script Played for Subjects to Introduce them to the System
Thank you for helping to test City Browser. Today, you’ll use City Browser to get information about points of interest like restaurants, hotels, and museums; to find addresses on a map; and to get directions. You’ll be handed a series of written scenarios to guide you.
Before we begin, I’m going to briefly walk you through using City Browser.
In the screen in front of you, City Browser shows a map with your current location. A small blue triangle indicates the position of the car, and which way it’s facing.
You can control what you see on the screen by using the iDrive controller, which is a silver knob located to your right near the gear shifter. You can use your hand to spin the controller, and to shift it left, right, forward, and back. You can also push down on it like a button.
Now, find the controller and put your right hand on it.
PAUSE [research assistant verifies]
First, try pushing it to the right, away from yourself. This should bring you to a help screen, which shows suggestions of things you might want to say to City Browser.
PAUSE [research assistant verifies]
Now, try spinning the controller clockwise. You should be able to scroll down the list this way. To scroll back up, spin the controller counter-clockwise.
PAUSE [research assistant verifies]
To get back to the main screen, push the controller to the left, towards yourself. Try pushing the controller to the left now.
PAUSE [research assistant verifies]
Great. Now push the controller to the left once more. The map should now fill the screen.
PAUSE [research assistant verifies]
You can zoom in and out on the map by spinning the controller. Let’s try it now: spin the controller both clockwise and counterclockwise.
PAUSE [research assistant verifies]
Great. To get back to the main screen, just push the controller to the right again.
PAUSE [research assistant verifies]