Publisher’s version / Version de l'éditeur:
Vous avez des questions? Nous pouvons vous aider. Pour communiquer directement avec un auteur, consultez la première page de la revue dans laquelle son article a été publié afin de trouver ses coordonnées. Si vous n’arrivez pas à les repérer, communiquez avec nous à PublicationsArchive-ArchivesPublications@nrc-cnrc.gc.ca.
Questions? Contact the NRC Publications Archive team at
PublicationsArchive-ArchivesPublications@nrc-cnrc.gc.ca. If you wish to email the authors directly, please see the first page of the publication for their contact information.
https://publications-cnrc.canada.ca/fra/droits
L’accès à ce site Web et l’utilisation de son contenu sont assujettis aux conditions présentées dans le site LISEZ CES CONDITIONS ATTENTIVEMENT AVANT D’UTILISER CE SITE WEB.
Building Research Note, 1979-06
READ THESE TERMS AND CONDITIONS CAREFULLY BEFORE USING THIS WEBSITE. https://nrc-publications.canada.ca/eng/copyright
NRC Publications Archive Record / Notice des Archives des publications du CNRC :
https://nrc-publications.canada.ca/eng/view/object/?id=1d5c42fe-3e8f-4cf6-9896-31de6cdc429d https://publications-cnrc.canada.ca/fra/voir/objet/?id=1d5c42fe-3e8f-4cf6-9896-31de6cdc429d
NRC Publications Archive
Archives des publications du CNRC
This publication could be one of several versions: author’s original, accepted manuscript or the publisher’s version. / La version de cette publication peut être l’une des suivantes : la version prépublication de l’auteur, la version acceptée du manuscrit ou la version de l’éditeur.
For the publisher’s version, please access the DOI link below./ Pour consulter la version de l’éditeur, utilisez le lien DOI ci-dessous.
https://doi.org/10.4224/40000564
Access and use of this website and the material on it are subject to the Terms and Conditions set forth at
Relative tightness of new housing in the Ottawa area
S e r
TSSN 0701-5232
-h
National R e a r c h Conseil national
RELATIVE TIGHTNESS OF NEW HOUSING
Y
TN THE OTTAWA AREA
R.K. Beach
As part of i t s energy conservation research program, the Division of
B u i l d i n g Research of t h e National Research Council of Canada has spansored a research c o n t r a c t t o investigate the relative a i r tightness of new
houses built and sold Ln the Ottawa area in 1978, There were two principal
purposes: t o evaluate a testing procedure for checking new houses for
compliance with a performance type o f a i r leakage standard; and t o o b t a i n r e l a t i v e tightness data f o r current housing. This Note deals with t h e
l a t t e r o b j e c t i v e .
I n i t i a l contact was made by DBRlNRC with local members of the Housing
and Urban Development Association of Canada, inviting them to participate
in t h e program- Those who agreed were referred to t h e research contractor
whose responsibility it was to make the final selection of houses to be
tested and a19 other arrangements. For technical reasons t e s t i n g was
limited to detached housing units o r to semi-detached and row housing u n i t s not having heated areas separated by a common wall. T h i s effectively
prevented some o f the interested firms from participating, and subsequently
other considerations forced a f e w more who had i n d i c a t e d interest in t h e program to w i t h d ~ a w . In a l l , 80 relative tightness t e s t s were made
involving 6 3 houses and 9 builders.
P r i o r to the research c o n t r a c t , DBR had prepared a d r a f t t e s t
procedure based on the pressure d i f f e r e n c e method o f t e s t i n g whereby a
f a n
i s used to e x t r a c t air from a house
i n
o r d e r Eo produce a n e g a t i v e pressurewithin t h e building. This pressure difference causes a i ~ to infiltrate
through the building envelope at the same rate as it is extracted by the
fan. Details of the test procedure
are
attached as Appendix A.When corresponding values of Q and AP are plotted on l o g - l o g g r a p h
paper t h e data f a l l along a straight line. Thus, t h e relation between rate
of a i r flow, Q, and pressure difference, AP, across t h e building envelope
can be represented by
The slope of the s t r a i g h t l i n e g i v e s the value of n, and t h e value o f the
characteristic values f o r C and
n .
Test data f o r three houses have been p l o t t e d in Figure 1.There are several advantages t o this procedure. l a e n pressure
differences across the building envelope are low, t h e accuyacy of the test
d a t a will be q u i t e low owing to wind and instrument reading e r r o r s . Although
it is a good test, t h e data far house No. 1 show this tendency. It is a l s o
v e r y difficult t o o b t a f n t h e exact pressure d i f f e r e n c e across the building
envelope t h a t is needed if comparisons are to he made of different houses at
a particular pressure difference. As illustrated by houses N o . 26 and 6 3 ,
two houses having t h e same rate of infiltration at one pressure d i f f e r e n c e
can have different r a t e s at o t h e r pressure d i f f e r e n c e s . In houses No. 1 and 26, the v a l u e s of n are similar, 0.670 and 0.669, respectively, so that
the lines a r e almost parallel, i n d i c a t i n g n e a r l y constant r e l a t i v e air tightness independent of pressure difference.
A f u r t h e r advantage o f the procedure is that o n c e the house characteris-
t i c s have been determined its relative tightness can be calculated far any
pressure d i f f e r e n c e . This makes it possible to carry out a test at pressure
differences hlgh enough to mask t h e effect of wind and outside temperature
and base the relative t i g h t n e s s on a pressure difference more representative of that occurring during the h e a t i n g season. For t h i s c o n t r a c t t h e pressure
d i f f e r e n c e chosen was 10 Pa. If subsequent research indicates that another
value should be used, new relative tightness values can e a s i l y be calculated and the t e s z i n g will not have t o be repeated,
The a i r flaw correspanding to a particular pressure difference is a
characteristic o f each house. In o r d e ~ t o e s t a b l i s h a relative t i g h t n e s s v a l u e it i s necessary to have some means
o f
comparing houses. Heating loadcalculations are often based on air leakage expressed in air changes per hour. T h i s f s equivalent to t h e volume rate o f air flow d i v i d e d by t h e
volume o f the house. Those studying t h e air tightness of houses generally
make use of the same terms, and this is satisfactory as long as the volumes of the houses being compared axe known. If they a r e n o t known or t h e t e s t i n g
has been done at d i f f e r e n t pressure differences, then comparison is impossible.
A i r tightness depends on t h e tightness of t h e building envelope o r a i r
barrier rather t h a n the building volume. Dividing t h e volume rate of a i r
flow by t h e area of t h e a i r b a r r i e r gives the r a t e of a i r flow per u n i t area or the average velocity o f the air passing through the building envelope.
This is, at present, t h e most meaningful parameter for comparing the a i ~
tightness of different houses. When details o f houses a r e available, t h e
rate of a i r flow can be converted to air changes p e r hour. Regardless of the
units used, t h e r e l a t i o n between r a t e of a i r flow determined by t h i s test
method and average rate of air leakage d u r i n g t h e h e a t i n g season i s unknown, It is impossible t h e r e f o r e to use these test data d i r e c t l y i n e s t i m a t i n g a
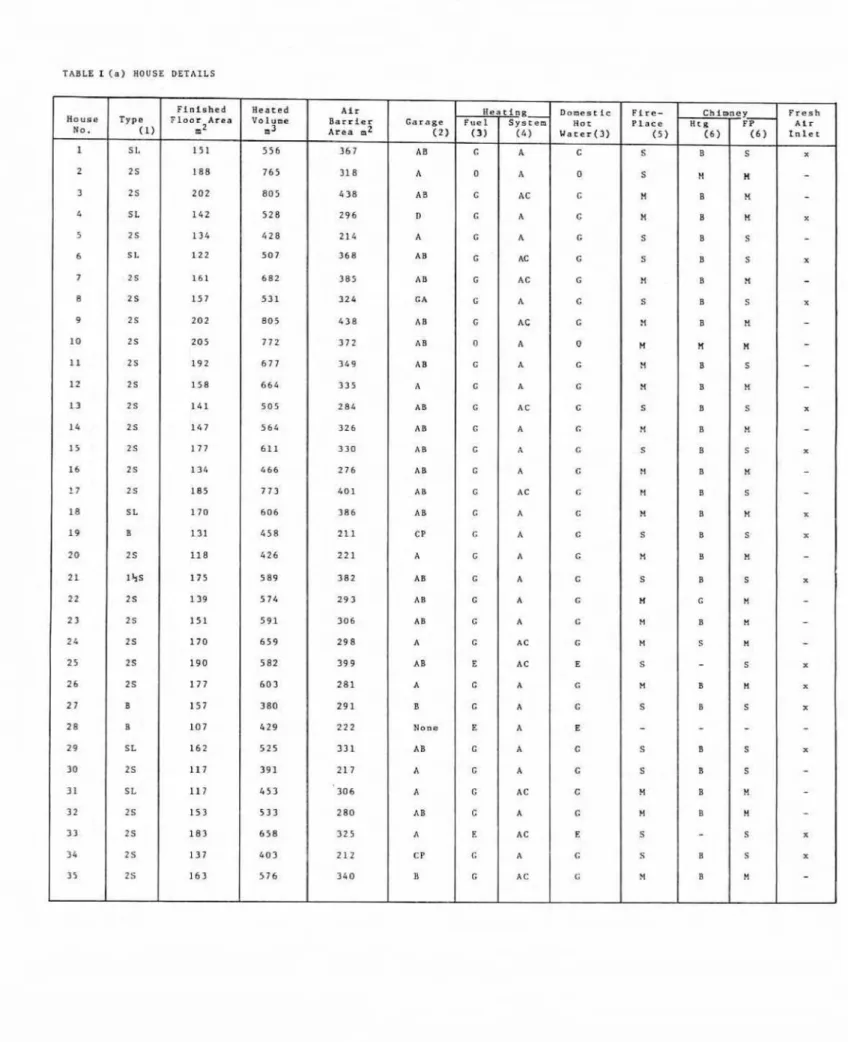
TABLE t ( a 3 H O U S E DETAILS
Finished H e a t e d A i r A e a t i n g Deuestfc Fire- Fresh
House Type ~ l n a r A r e a V o l u m e B e r r i e r Carage P u e l S y s t e m H o t
N O . ( 1 ) m2 m 3
,
~ r e a m2 ( 2 ) ( 3 ) ( Uater(3)--
-
1 S L 1 5 1 5 5 6 36 7 AB C A 6 S B S X 2 2 S 1 8 8 7 6 5 31 8 A 0 PI 0 s H n - 3 2 5 2 0 2 8 0 5 4 38 A B G LC C n B H ITAB1.h I b R O U S E OETAILS ( 1 ) 2 - 2 s t o r e y ( 2 ) A
-
Attached garage s t g r a d e ( 3 ) 0 - b i l 14 - L k s t o r e y AB-
B u f l t i n g a r a g e a t g i a d c G - G a s 5L - S p l L t L e v e l %-
B u i l t in g a r a g e in basement E - E l e c t r i c i t y B - B u n ~ a l o w L S p l i t Level E n t r a n c e CP-
C a r p o r t S - s o l a r & E l e c t r i c i t y D-
Detached G a r a g e H? - B e a t Pump h E I e c t r i c l t y ( L l A - F o r c e d A i r AC - A i r conditioned ( 5 ) B - B Y r n t S-
I n s u l a t e d s t c e l Y - M a s o n r y ( 6 ) S - S t e e l Iining M - M a s o n r yIn
t h i s paper r e l a t i v e tightness is defined as t h e equivalent average velocity of infiltrating a i r equal to t h e volume rate of infiltration under a pressure d i f f e r e n c e of 10 Pa divided by the area of the air barrier. Thearea of the air b a r r i e r is f u r t h e r d e f i n e d as the area o f the building
envelope (ceiling, walls and f l o o r s ) that separates t h e heated volume from
outside conditions. Unheated garages and v e n t i l a t e d crawl spaces are
considered to have outside conditions.
Houses currently b u i l t in t h e Ottawa area vary widely in size, type,
style, finish and constmction detail. Those selected for t e s t i n g were
r e p r e s e n t a t i v e of current censtruction, but owing to t h e many differences
e x i s t i n g and the limited number that could be rested it was impossibl~ to
relate relative tightness to s p e c i f i c details, Pertinent details of the
houses t e s t e d have been t a b u l a t e d i n Table I.
Initially, it was thought t h a t the type of house would b e s i g n i f i c a n t ,
and t h e houses were classified accordingly in four categories: 2-storey,
14-storey, split level, and bungalow, t h e latter including s p l i t level
entrance type houses. Differentiating t h e first three types proved to be
extremely difficult because each type seemed to blend into The other. In the
end t h e decisions tended to be somewhat arbitrary.
S i z e of house is a l s o given, expressed in t h r e e d t f f e r e n t ways, f i n i s h e d f l o o r area, volume, and area of t h e a i r barrier. Both s t y l e and type
of
house affect t h e relations of these factors and t h e r e f o r e the relation of
relative tightness to size. Ta illustrate the differences t h a t do occur
details and t e s t results f o r t h e t h r e e houses used in F i g u r e 4 have been
t a b u l a t e d in Table I1 in order of relative t i g h t n e s s .
The remaining details are those t h a t could cause a s i g n i f i c a n t
difference between t h e t e s t results
and
t h e actual r a t e o f i n f i l t r a t i o n -exfiltration occurring under normal occupancy conditions, for t h e t e s t s were carried nut with chimneys and f r e s h air i n l e t s sealed o f f . Additianal
information such as exterior
finish, number
and location o f exhaust fans, construction details, e l c . , was o b t a i n e d , but space does n o t permit itsinclusion in this report.
'TAFi1.1;. 11 EFFECT OF SIZE FACmR ON RELATll'f TIGHTXTSS
- - - - . - - -
Finished h i s Ucl:lt trr
[louse Type F l d a r Area I'crllune Barrier Cbnst3at C b ~ f f i t i ~ f l t Air ribm 'I i ~lhtrrcc.:
No. m7 n3 Area m7 6 n {)lo n3!k ACJh mn/k
1 SI. 151 551r 367 n.nsao 0.670 0 . 2 7 3 1 . 7 7 11 .?.1.1
T h e 6 3 houses listed are a f a i r sample o f 1978 houses. In some cases t e s t s were c a r r i e d out on two o r three examples
of
t h e same model, andin
o r d e r n o t to bias the test r e s u l t s unduly they were averaged and reported as as i n g l e house. The i n i t i a l t e s t i n g , carried out by the contractor, combined a
learning experience and a proving out o f t h e test prdcedure, both of which
contributed to some questionable results. The procedure was t h e r e f o r e
m o d i f i e d slightly and a number of houses were r e t e s t e d to check t h e e a r l i e r
r e s u l t s . In s u c h cases t h e results were averaged or t h e initial test
discarded.
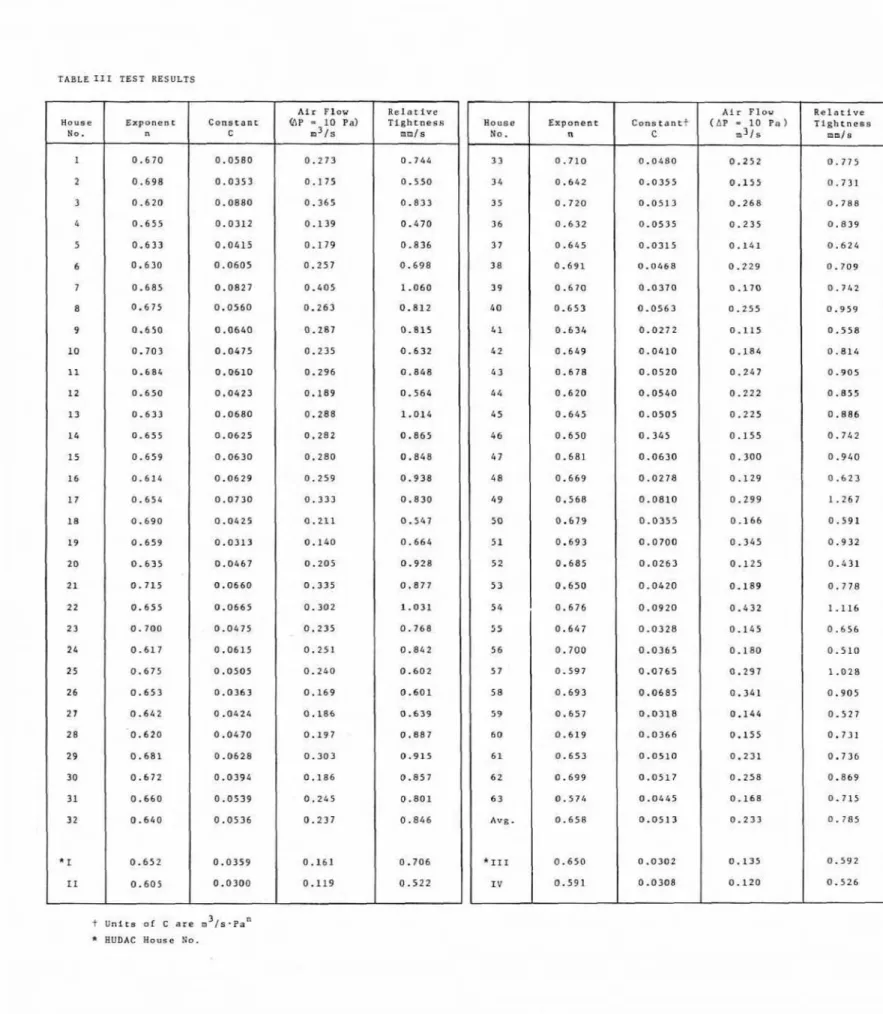
R e s u l t s f o r the 63 representative houses are g i v e n in Table TI1 and
displayed graphically in Figures 2 to 6 . In addition, the f o u r HdDAC s e s e a r c h houses located in Orleans were recently t e s f e d by DBR- Details of
these houses and their t e s t results have a l s o been included in t h e t a b l e s and
f i g u r e s for comparison.
One of t h e more i n t e r e s t i n g aspects of t h e investigation is that there appears to be no s i g n i f i c a n t d i f f e r e n c e in t h e various items t h a t can be
associated w i t h type o f house. Bungalows tend to have slightly lower v a l u e s
of
n,C
and a i r f l o w (QIP), but when the area of the air barrier i sincluded they tend t o have a slightly h i g h e r relative leakage value.
The r a n g e of relative tightness values shown in Figure 5 is about 2 if
extreme cases a r e excluded, but these data cannot be used to p r e d i c t the
amount o f air infiltration-exfiltration that will occur in practice. Subject
to t h e living habits of the occupants, it is f a i r l y c l e a r t h a t the relative
infiltration-exfiltration values will have a r e l a t i o n similar to t h a t of the
relative tightness values.
Undoubtedly t h e most i n t e r e s t i n g aspect of the test results is t h e r e l a t i v e tightness o f houses constructed by d i f f e r e n t b u i l d e r s and t h e i r
relation to t h e experimental WUDAC Houses .(Figure 6 ) . It i s e v i d e n t t h a t each
Imildcr produces houses w i t h i n a characteristic range o f relative t i g h t n e s s
values. The d i f f e r e n c e s cannot be explained by differences i n construction d e r a i l o r f i n i s h because similar details w e r e widely u s e d , although i n a f e w
cases t h e construction detail d i d undoubtedly contribute to the looseness of
t h e envelope. There was a distinct impression t h a t the relative tightness of
a house varied w i t h t h e quality of the workmanship. As several d i f f e r e n t
trades and subtrades are involved, the degree o f supervision and inspection
may a l s o be an i m p o r t a n t factor.
T h e c u r r e n t R e s i d e n t i a l Standards Canada. require -workmanship and d e s i g n
to be equal to goad building practice. Although good building practice i s not
d e f i n e d , t h e results
o f
this series o f tests suggest t h a t some builders a r e better t h a n o t h e r s in r h i s r e s p e c t . I t i s also r e a s o n a b l e t o deduce that bya v o i d i n g some design details and improving the quality o f workmanship,
supervision, and inspection, a s i g n i f i c a n t improvement could be made in t h e
TABLE I11 TEST RESULTS A i r Plow R e l a t i v e 1 0 . 6 7 0 0 . 0 5 8 0 0 . 2 7 3 2 0.698 0 . 0 3 5 3 0 . 1 7 5 3 0 . 6 1 0 0.0880 0.363 4 0 . 6 5 5 0.0312 0 . 1 3 9 5 0.633 0 . 0 4 1 5 0 . 1 7 9 6 0 . 6 3 0 0 . 0 6 0 5 0 . 2 5 7 7 0 . 6 8 5 0 . 0 8 2 7 0 - 1 0 5 6 0 . 6 7 5 0.D561) 0 . 2 6 3 t u n i t s of c e r e r n J t s * ~ a n BUDAC H o u s e No.
S T A T I C P R E S S U R E D I F F E R F N C E A C R O S S B U I L O l N G ENVELOPE AP, Pa F I G U R E 1 SAMPLE T E S T RESULTS S T Y L E O F H O U S E - W 0. HUOAC HOUSES 4 r I ALL TYPES 2 S T O R E Y 1 112 S T O R E Y 2 u B U N G A L O W EXPONENT, n F I G U R E 2 D I I S T R I B U T I O N O F EXPONENT n F O R DIFFERENT S T Y L E S OF H O U S E
STYLE OF HOUSE NO. H U D A C MOUSES 4
d
r ALL T Y P E S 63LL
J.HEI-
J-.
.
..
w w 2 STOREY 38 x K % X & x x x 1 112 STOREY 2 D S P L I T LEVEL 11 A 1 A A A u A B U N G A L O W 1 2 k b ~ L L L *. c L 1 I I S I E I 1 I 1 I 0 0 . 0 1 0 . 0 2 0.03 0.04 0.05 0 . 0 6 0.07 0.08 0 . 0 9 0 . 1 0 C O N S T A N T . C F I G U R E 3 D l S T R l B U T l O N OF C O N S T A M T C F O R DIFFERENT S T Y L E S O F HOUSE S T Y L E OF H O U S ENO.
HUDAC H O U S E S 4 1 1 ALL T Y P E S 6 3 aram
A d m d ~
II 2 STOREY 38 x x 8 & 3 b I x x x k 112 S T O R E Y 2 S P L I T LEVEL 11 A .4 A A 44 AA B U N G A L O W 1 2 L I L L L Y L i k F I G U R E 4S T Y L E O F H O U S E NO. HUDAC M O U S E S 4 1 1 rn ALL T Y P E S 2 S T O R E Y I 112 STOREY 2 f3 S P L I T LEVEL 11 A A " A
34
A B U N G A L O W 1 2 h L 1 L k L i h R E L A T I V E A I R T I G H T N E S S R T , mmEs A T AP-
10 P a F I G U R E 5 Q l S T A l B U T I O N OF R E L A T I V E A 1 R T I G H T N E S S V A L U E S F O R D I F F E R E N T S T Y L E S OF H O U S E B U I l q E A NO. HUDAC H O U S E S 4 1 4 I ALL A 0 C 0 E F G H I 0 D. 2 !l.d 0 . 6 0 . 8 1 . 0 1 . 2 1 . 4 R E L A T I V E A I R T I G H T N E S S R T , rnmlls A T bP-
10 Pa F I G U R E 6 O I S T R I B U T I O N OF R E L A T I V E A I R T I G H T N E S S V A L U E S A T THE R E F E R E N C E P R E S S U R F DIFFERENCE F 0 4 D I F F E R E N T B U l t D l A S A N D S T Y L E S O F H O U S E..- .
* -- -APPENBIX
AE S T PROCEDURE FOR
DETERMINING THE
A I R TIGHTNESS OF HOUSES
BY THE PRESSURE DIFFERENCE METHOa
1. Describe the building and its construction by c i r c l i n g appropriate items
i n
t h e T e s t Report and a t t a c h a 3 by 5 photograph. Prepare a sketch orattach sales brochure on which is sham the floor plan, adjacent
buildings, trees, compass orientation, and l o c a t i o n of chimney f l u e s ,
exhaust fans and the test equipment. Include the location of the point
where the outside pressure tap enters t h e building. Record a l l data
and complete the t e s t r e p o r t (Appendix B].
2. Select the most convenient door or window opening and set up t h e
apparatus in accordance w i t h F i g . A - l . Pass pressure tubes and cables
through the openings as required and s e a l . Ensure t h a t duct j o i n t s and
connections are a i r t i g h t . Mount t h e pressure t a p and locate thermometers
i n suitable locations. Adjust f o r minimum a i r flow and complete the
electrical hook-up.
.
Inspect t h e building and ensure that i n s i d e doors a r e open, e x t e r i o r doors a r e c l o s e d , f i r e p l a c e dampers a r e closed, plumbing t r a p s are full andwindows closed and locked. Switch o f f intake and exhaust f a n s and seal
the openings. Turn d a m the t h e m o s t a t of any f o s s i l f u e l f i r e d furnace or heater and seal t h e chimney. Switch on any a i r circulation f a n . Seal any f i r e p l a c e .
4 . Seal the duct t e m p o r a r i l y and record t h e d i f f e r e n t i a l static pressure
between inside and outside; then unseal t h e d u c t znd record the
d i f f e r e n t i a l s t a t i c pressure again. Switch on t h e fan and a d j u s t t h e
f l o w control to create t h e maximum possible suction pressure to a maximum
of 200 Pa. Record the d i f f e r e n t i a l pressure and the velocity head
i n
t h educt. Readjust the flow c o n t r o l to obtain data at nine more pressure
differences equally spaced on l o g - l o g paper between the maximum pressure
difference and one quarter o f t h e maximum pressure difference. S w i t c h off the fan and record the differential static pressure again.
3
5. Convert the velocity head to f l o w rate Q in m / s by means of a
calibration equation or curve. Calculate t h e imposed pressure d i f f e r e n c e
bP
in
Pa and p l o t against Qon
2 by 3 c y c l e log-log paper with thepressure d i f f e r e n c e as the x axis and t h e air leakage rate as t h e y a x i s .
D r a w a best fit by eye straight line t h r o u g h t h e points to extend from
1 to BOO Pa disregarding any one individual t e s t p o f n t t h a t i s questionable. DetemPne the slope n of t h e straight line and t h e values of
Q
when APis 1 Pa and 10 Pa and record. Calculate and record the r e l a t i v e
I N S I D E AVERAGIMG TUBES WER-ALL WGTH 18 It TO TEST BFNCH LOCATED CLEAR OF BUILDING F I G U R E A 1 R E L A T I V E A I R T t G H T N E S S T E S T SET-WP
APPENDIX B
RELATIVE
T I G m S S V A L EOF
BUILDING ENVELOPEDescription: Bungalow, 1% storey, 2 s t o r e y , s p l i t level, s p l i t level
entrance. Roof: p i t c h , f l a t , mansard. Garage: attached,
built-in. Outside f i n i s h : bk. veneer, stucco, s i d i n g .
Windows: double hung, sashless, awning, casement,
sealed double g I a z i n g . Heating: electric, gas, oil,
heat pump, hot water, warm a i r , air conditioned.
Dm: electric, gas, o i l . Fireplace: masonry, s t e e l l i n e d . Furnace chimney: masonry, i n s u l a t e d steel, B vent.
Fireplace chimney: masonry, i n s u l a t e d s t e e l .
Other Comments:
Date Built:
L o c a t i o n
Date Tested:
Weather office (a] Wind speed h / h {b] Direction
(c] Stagnation pressure kPa (d) Atmas press kPa
E l e v a t i o n of pressure tube entrance above grade m; above
-
floor-
mExt wall area above grade m2 ( S e e Notes)
Roof or a t t i c j c e i l i n g area m 2
Exposed f l o o r area rn 2
Bldg.
envelope area (5 + 6 + 7)m
2Total bldg volume - - m 3
Make up air s i z e
D i f f . static press. acmss
envelope, Pa
Outside temperature
Inside temperature
(a) S t a r t ( b ) End
( c )
Average, OC (a) Start (b] End (c) Average
TEST DATA
Attach log-log graph of t e s t data and report
{ a ) n = (b) C(QL) =
( ~ 1
Q10A t t a c h photograph and sketch p l a n
Date Signature
Notes:
1) Areas and volumes are based
on over-all
measurements ( t o t h e air barrier)and include partitions and f l o o r s .
2) Wall areas exposed to attic space ( s p l i t levels) are to be included in cei 1 ing/ at t ic areas
.
3) A t t a c h rough calculation s h e e t s 4) Conversion v a l u e s : (a] 1 ft = 0 . 3 0 4 8 m (b) 1