HAL Id: hal-02441523
https://hal.archives-ouvertes.fr/hal-02441523
Preprint submitted on 15 Jan 2020
HAL is a multi-disciplinary open access archive for the deposit and dissemination of sci-entific research documents, whether they are pub-lished or not. The documents may come from teaching and research institutions in France or abroad, or from public or private research centers.
L’archive ouverte pluridisciplinaire HAL, est destinée au dépôt et à la diffusion de documents scientifiques de niveau recherche, publiés ou non, émanant des établissements d’enseignement et de recherche français ou étrangers, des laboratoires publics ou privés.
Belin, Joachim Gross
To cite this version:
Bruno Giordano, Caroline Whiting, Nikolaus Kriegeskorte, Sonja Kotz, Pascal Belin, et al.. From categories to dimensions: spatio-temporal dynamics of the cerebral representations of emotion in voice. 2020. �hal-02441523�
1
Title: From categories to dimensions: spatio-temporal dynamics of the
cerebral representations of emotion in voice
Authors: Bruno L. Giordano* 1,2, Caroline Whiting2, Nikolaus Kriegeskorte3, Sonja A. Kotz 4,5,
Pascal Belin 1,2,6*†, Joachim Gross2,7*†
Affiliations:
1 Institut of Neurosciences of la Timone UMR 7289 Centre National de la Recherche
Scientifique and Aix-Marseille University, Marseille, France.
2 Institute of Neuroscience and Psychology, University of Glasgow, Glasgow, UK.
3 Zuckerman Mind Brain Behavior Institute, Columbia University, New York, NY, USA.
4 Faculty of Psychology and Neuroscience, Department of Neuropsychology and
Psychopathology, Maastricht University, Maastricht, The Netherlands.
5 Department of Neuropsychology, Max Planck Institute for Human Cognitive and Brain
Sciences, Leipzig, Germany.
6 Department of Psychology, University of Montréal, Montréal, Canada.
7 Institute for Biomagnetism and Biosignalanalysis, University of Münster, Germany.
*Correspondence should be sent to: BLG (bruno.giordano@univ-amu.fr), PB
(pascal.belin@univ-amu.fr) and JG (joachim.gross@wwu.de ).
2
Abstract:
Whether the human brain represents emotional stimuli as discrete categories or continuous
dimensions is still widely debated. Here we directly contrasted the power of categorical and
dimensional models at explaining behavior and cerebral activity in the context of perceived
emotion in the voice. We combined functional magnetic resonance imaging (fMRI) and
magneto-encephalography (MEG) to measure with high spatiotemporal precision the dynamics
of cerebral activity in participants who listened to voice stimuli expressing a range of emotions.
The participants also provided a detailed perceptual assessment of the stimuli. By using
representational similarity analysis (RSA), we show that the participants’ perceptual
representation of the stimuli was initially dominated by discrete categories and an early
(<200ms) cerebral response. These responses showed significant associations between brain
activity and the categorical model in the auditory cortex starting as early as 77ms. Furthermore,
we observed strong associations between the arousal and valence dimensions and activity in
several cortical and subcortical areas at later latencies (>500ms). Our results thus show that both
categorical and dimensional models account for patterns of cerebral responses to emotions in
voices but with a different timeline and detail as to how these patterns evolve from discrete
categories to progressively refined continuous dimensions.
One Sentence Summary: Emotions expressed in the voice are instantly categorized in cortical
3
Main text:
A persistent and controversial debate in affective sciences is whether emotions are better
conceptualized as discrete categories or continuous dimensions (1, 2). Discrete emotion theories
postulate a small number of modules, each specific to a basic emotional category such as fear or
anger (3, 4). Dimensional theories instead argue that emotions are best described along a number
of continuous dimensions such as valence (reflecting the degree of pleasantness ranging from
negative to positive) or arousal (reflecting the degree of intensity ranging from calm to excited)
(5, 6).
Despite decades of continuous effort this fundamental question is still unresolved (7) and
conflicting behavioral evidence continues to emerge both in intercultural and cross-cultural studies
(8-10). Neuroimaging research on the cerebral bases of emotion, either felt or perceived, has not
unequivocally settled this debate either (11, 12) and meta-analyses of large bodies of evidence can
support either the notion of category-specific modules (13) or that of large-scale networks
representing dimensional attributes (1, 14). Multi-voxel pattern analyses (MVPA) (15) have
identified distributed patterns of cerebral activity allowing classification of felt or perceived
emotions in others into discrete categories as well as estimation of valence and arousal dimensions
(16-24). Yet, whether the brain represents emotional events more as discrete categories or as
continuous dimensions remains unclear, in large part because the predictions of the two major
theoretical positions have so far not been directly compared in a dedicated study integrating
behavior with neuroimaging detailing how cerebral responses evolve in both space and time (8,
4
Here we address this question in humans by combining comprehensive behavioral assessments
with multimodal brain-activity measurements from the same individuals at high spatial and
temporal resolution. We measured cerebral activity using functional magnetic resonance imaging
(fMRI) and magneto-encephalography (MEG) while participants listened to voices that densely
sampled a range of perceived emotion categories and dimensional attributes (Fig. 1 and 2). This
approach allowed measuring the spatiotemporal dynamics of cerebral activity during the passive
perception of emotional stimuli, linking these patterns to overt behavioral responses collected after
scanning and directly comparing the predictions of discrete and continuous models. We applied a
multivariate analysis technique called representational similarity analysis (RSA) (25) to relate the
perceived categorical and dimensional attributes of the stimuli (categorical and dimensional
models derived from behavioral measures) to the multivariate cerebral responses (Fig. S1). With
this approach, we combined multiple behavioral measures with an integrated analysis of spatial
(fMRI) and spatiotemporal (MEG) cerebral activity patterns from the same participants and
obtained robust converging evidence for categorical and dimensional representations of perceived
vocal emotions.
Auditory stimuli consisted of a homogeneous set of emotionally expressive nonverbal
vocalizations obtained by morphing between the recordings of each of two actors (one female, one
male) portraying four different emotions — anger, fear, disgust, and pleasure — as well as a neutral
expression (26) while briefly uttering the vowel /a/. Morphing combined pairs of emotional
vocalizations from the same actor with weights varying in 25% steps from 0 (neutral) to 125%
(emotional caricature) for neutral-emotion morphs and from 0 to 100% between the four expressed
emotions (Fig. 1A), resulting in 39 stimuli per actor (Audio S1-S78). Healthy participants (n=10)
5
a simple repetition detection task that ensured appropriate attention to the stimuli while avoiding
an explicit focus on emotional attributes. The large amount of multimodal imaging data for each
individual (8 sessions each for a total of 80 sessions) was key to adjudicating between overlapping
emotion models with robust analyses. Once scanning was complete they rated the perceived
dissimilarity of all (within-actor) pairs of stimuli in the absence of instructions that would bias the
judgment toward a specific stimulus feature. During the last session, they evaluated the perceived
emotional stimulus attributes by categorizing emotions and rating their valence and arousal (cf.
Supplementary Materials and Methods).
Analysis of behavioral results confirmed that the morphing method reliably modulated perceived
emotion categories and dimensions (see Fig. 1B, C for perceptual effects of morphing and Fig. 2A,
B for visualization of emotion attributes in all stimuli). We quantified the relevance to perceived
stimulus dissimilarity (Fig 2C) of each of three emotion-attribute distances derived from the
categorization and valence and arousal ratings (emotion representational dissimilarity matrices –
RDMs; Fig 2A, B; correlations between emotion RDMs ≥ .19 and ≤ 0.36, standard error of the
mean–s.e.m. ≤ 0.08, T(9) ≥ 4.07, p < 0.05 family-wise error rate – FWE corrected across
correlations). Although larger differences in each of the emotion attributes were associated with
an increase in perceived dissimilarity (r ≥ 0.27, s.e.m. ≤ 0.03, T(9) ≥ 8.01, p < 0.05 FWE corrected
across emotion RDMs), only for categories and arousal such modulation was selective, i.e. was
independent of the variance shared between all emotion attributes (semi-partial correlation – s.p.r
≥ 0.15, s.e.m. ≤ 0.03, T(9) ≥ 8.98, p < 0.05 FWE corrected across emotion RDMs). Importantly,
categories appeared to modulate selectively perceived dissimilarity more strongly than arousal or
valence (unique explained variance contrast for categories vs. arousal or valence ≥ 29.07%, s.e.m.
6
1.58%, T(9) = 4.66; all p < 0.05 FWE corrected across contrasts) and accounted better for
perceptual dissimilarity than both dimensional attributes together (percent explained variance
contrast = 12.89%, s.e.m. = 1.65%, T(9) = 10.28, p = 0.00002). Thus, the behavioral data indicate
that both categories and dimensions influence the perception of the emotional voice stimuli but
that categories have a stronger influence.
Next, we asked where (cerebral location) and when (peri-stimulus latency) stimulus-evoked
cerebral activity was significantly associated with either the categorical or the continuous emotion
models. We first built fMRI RDMs reflecting at each cerebral location (voxel) the pairwise
stimulus-evoked blood oxygenation level signal difference measured via fMRI, measured within
a local sphere centered on that voxel (spatial fMRI searchlight = 6 mm radius). Each fMRI RDM
was tested for a significant correlation with each of the three emotion-attribute RDMs (see Fig.
2A-B correlation maps and Fig. S3 and Table S3 for additional fMRI tests). We used these results
to spatially constraint the subsequent MEG analysis and built MEG RDMs only at those locations
that yielded significant fMRI-emotion RDM correlations (see Fig. 3A for fMRI correlation maps).
The MEG RDMs were derived from pairwise stimulus-evoked magnetic signal difference at the
corresponding source-space location and each peri-stimulus time point between -147 ms and 1060
ms after stimulus onset (spatiotemporal MEG searchlight = 10 mm radius, 53 ms duration and 40
ms overlap between subsequent windows; cf. Supplementary Methods and Fig. S1). The encoding
of variance shared between different emotion attributes, such as the strong valence/arousal
correlation apparent in Fig. 2., was teased apart from the encoding of variance unique to each of
them via semi-partial correlation tests. We then contrasted the unique RDM variance explained by
each of the three emotion attributes and, more importantly, by categories and both dimensional
7
male and female speakers (speaker averaged perceived emotion attributes correlated with RDMs
cross-validated across speakers). Significance testing relied on a group-level permutation-based
approach with cluster mass enhancement and multiple comparisons corrections across the entire
analysis mask (FWE = 0.05) (cf. Supplementary Methods).
Auditory cortices bilaterally showed strong selective encoding of emotion categories from early
latencies (see Fig. 3B for statistical maps and Table S1 for statistical peaks) in both primary (local
MEG encoding peak at 77ms) and secondary (global MEG encoding peak at 117ms) areas of the
superior temporal gyrus (STG; selective encoding extending to 517ms). At later latencies, activity
patterns in these areas where characterized by selective encoding of arousal (237-837ms; global
MEG encoding peak at 717ms, Fig. 3D) and, to a lesser extent, of valence in the right insula
(717-877ms; global peak at 757 ms, Fig. 3C). Activity patterns selectively encoded categorical or
dimensional attributes in several additional cortical and subcortical areas. The left inferior frontal
gyrus (pars triangularis; IFGt) preferentially represented the set of stimuli in terms of discrete
emotions from as early as 117ms after sound onset (IFGt peak at 157 ms, Fig. 3B) potentially
reflecting implicit categorization processes based on feed-forward projections from the temporal
cortex (27). Stimuli were represented in terms of their perceived arousal in the right amygdala (a
subcortical structure involved in the fast detection and afferent processing of emotional signals
(28-32)) only at relatively later latencies: starting from 237ms, (Fig. 3D), then again between
557-597ms (arousal encoding peak) and around 757ms after a brief shift of the arousal-encoding area
towards orbitofrontal cortex (677ms). This temporal and differential evolution of the amygdala’s
response to arousal aligns with the structure’s afferent and efferent projections to subcortical and
8
Thus, converging evidence from three modalities—behavior, fMRI, and MEG—demonstrates that
both the categorical and dimensional models explain patterns of behavioral and cerebral response
to emotions in the voice—but with markedly different spatio-temporal dynamics. This may explain
why previous studies have found evidence in support of either one or the other model (13, 14,
16-24). Our results shed significant light onto the debate by showing that categorical and dimensional
representations unfold along different timelines in different cerebral regions, adding a
much-needed temporal dimension to the picture of cerebral processing of perceived emotion that so far
has remained rather static. We find that the amygdala showed strong associations with the arousal
dimension at latencies within 237-757ms. This is consistent with previous findings of selective
impairments of arousal, but not valence recognition in amygdala lesions (34, 35) and with
neuroimaging of healthy individuals showing representation of arousal but not valence in the
amygdala (36). In contrast, the valence dimension was weakly associated with perceptual
representations and was represented in the brain only at later latencies (>700ms in the insula).
Overall, the selective encoding of dimensional attributes in the amygdala and insula is in
agreement with the involvement of a “salience” network (11) linking the processing of emotional
states and events across species (37, 38) and thought to represent a phylogenetic precursor for
communicative behavior in primates and humans (20, 39, 40). In other cerebral areas, however,
stimulus representations appeared to evolve in time from one model to the other, such as right
auditory cortex that represents stimuli first in terms of their categorical structure at early latencies
and then in terms of their perceived arousal at later latencies, subsequent to their initial encoding
in subcortical structures (Fig. 3E). The representational dynamics observed for the right auditory
9
late attentional modulations resulting from feedback signals transmitted through lateral and medial
cortical connections from the amygdala (39, 41).
Finally, we perfomed a direct comparison of the categorical and continuous models by asking
when and where patterns of neural activity reflected one theoretical account more than the other.
For this, we initially calculated the contrast of RDM variance explained uniquely by each of the
emotion attributes and then contrasted the explanatory power of the categorical and dimensional
models (see Fig. 3E and S3 for contrast maps and Tables S1 and S2 for statistical peaks). The
categorical model uniquely explained significantly more MEG RDM variance than either valence
or arousal or both combined at early latencies (157ms) in the right auditory cortex centered on
mid-STG (mSTG; categories vs. valence contrast significant also at 197 and 357ms). Conversely,
the dimensional model uniquely explained significantly more MEG RDM variance at later
latencies (717-757 ms) in a similar area of the right auditory cortex (arousal vs. categories contrast
significant at 717ms; arousal vs. valence contrast significant at 637-677 ms).
In summary, by enabling a direct contrast of the predictions of the two models, our results provide
crucial insight into the category vs. dimension debate. Statistical comparison of the predictions of
the two models yielded unequivocal evidence for a clear prevalence of the categorical model: the
perceptual structure of the stimuli was more related to categories than dimensions and
spatiotemporal activity patterns in widespread areas of the auditory cortices were associated from
early latencies on (as early as 77ms post-onset) with the categorical stimulus structure. The contrast
of variance uniquely explained by categories and dimensions was significant in the right auditory
cortex around 157ms after stimulus onset. However, dimensional representations become more
prevalent at later latencies in the auditory cortex, subcortical areas, and orbitofrontal cortex,
10
emotional categories well suited to trigger fast adaptive reactions to increasingly fined-grained
representations modulated by valence and arousal. Overall, our results provide a comprehensive
characterization of the spatiotemporal dynamics of perceived emotion processing by the brain and
demonstrate how both categories and dimensions are interwoven into rich and complex
representations initially dominated by categories then progressively refined into dimensions.
References and Notes:
1. K. A. Lindquist, T. D. Wager, H. Kober, E. Bliss-Moreau, L. F. Barrett, The brain basis of emotion: a meta-analytic review. Behav Brain Sci 35, 121-143
2. S. Hamann, Mapping discrete and dimensional emotions onto the brain: controversies and consensus. Trends Cogn Sci 16, 458-466 (2012
3. P. Ekman, in The Science of Facial Expression, J. M. Fernandez-Dols, J. A. Russell, Eds. (Oxford University Press, 2017), pp. 39-56.
4. J. Panksepp, Neurologizing the Psychology of Affects: How Appraisal-Based
Constructivism and Basic Emotion Theory Can Coexist. Perspect Psychol Sci 2, 281-296 (2007).
5. J. A. Russell, L. F. Barrett, Core affect, prototypical emotional episodes, and other things called emotion: dissecting the elephant. J Pers Soc Psychol 76, 805-819 (1999);
6. L. F. Barrett, B. Mesquita, K. N. Ochsner, J. J. Gross, The experience of emotion. Annu
Rev Psychol 58, 373-403 (2007)10.1146/annurev.psych.58.110405.085709).
7. P. Ekman, What Scientists Who Study Emotion Agree About. Perspect Psychol Sci 11, 31-34 (2016).
8. A. S. Cowen, D. Keltner, Self-report captures 27 distinct categories of emotion bridged by continuous gradients. Proc Natl Acad Sci U S A 114, E7900-E7909 (2017).
9. M. Gendron, D. Roberson, J. M. van der Vyver, L. F. Barrett, Cultural relativity in perceiving emotion from vocalizations. Psychol Sci 25, 911-920 (2014).
10. D. A. Sauter, F. Eisner, P. Ekman, S. K. Scott, Cross-cultural recognition of basic emotions through nonverbal emotional vocalizations. Proc Natl Acad Sci U S A 107, 2408-2412 (2010).
11. L. F. Barrett, A. B. Satpute, Large-scale brain networks in affective and social neuroscience: towards an integrative functional architecture of the brain. Curr Opin
Neurobiol 23, 361-372 (2013).
12. S. Hamann, What can neuroimaging meta-analyses really tell us about the nature of emotion? Behav Brain Sci 35, 150-152 (2012).
13. K. Vytal, S. Hamann, Neuroimaging support for discrete neural correlates of basic emotions: a voxel-based meta-analysis. J Cogn Neurosci 22, 2864-2885 (2010).
11
14. H. Kober, L. F. Barrett, J. Joseph, E. Bliss-Moreau, K. Lindquist, T. D. Wager,
Functional grouping and cortical-subcortical interactions in emotion: a meta-analysis of neuroimaging studies. Neuroimage 42, 998-1031 (2008).
15. J. V. Haxby, A. C. Connolly, J. S. Guntupalli, Decoding neural representational spaces using multivariate pattern analysis. Annu Rev Neurosci 37, 435-456 (2014).
16. H. Saarimaki, A. Gotsopoulos, I. P. Jaaskelainen, J. Lampinen, P. Vuilleumier, R. Hari, M. Sams, L. Nummenmaa, Discrete Neural Signatures of Basic Emotions. Cereb Cortex
26, 2563-2573 (2016).
17. P. A. Kragel, K. S. LaBar, Multivariate neural biomarkers of emotional states are categorically distinct. Soc Cogn Affect Neurosci 10, 1437-1448 (2015).
18. A. E. Skerry, R. Saxe, Neural representations of emotion are organized around abstract event features. Curr Biol 25, 1945-1954 (2015).
19. J. Chikazoe, D. H. Lee, N. Kriegeskorte, A. K. Anderson, Population coding of affect across stimuli, modalities and individuals. Nat Neurosci 17, 1114-1122 (2014).
20. S. A. Kotz, C. Kalberlah, J. Bahlmann, A. D. Friederici, J. D. Haynes, Predicting vocal emotion expressions from the human brain. Hum Brain Mapp 34, 1971-1981 (2013). 21. L. B. Baucom, D. H. Wedell, J. Wang, D. N. Blitzer, S. V. Shinkareva, Decoding the
neural representation of affective states. Neuroimage 59, 718-727 (2012).
22. M. V. Peelen, A. P. Atkinson, P. Vuilleumier, Supramodal representations of perceived emotions in the human brain. J Neurosci 30, 10127-10134 (2010).
23. T. Ethofer, D. Van De Ville, K. Scherer, P. Vuilleumier, Decoding of Emotional Information in Voice-Sensitive Cortices. Curr Biol 19, 1028-1033 (2009).
24. E. T. Rolls, F. Grabenhorst, L. Franco, Prediction of subjective affective state from brain activations. J Neurophysiol 101, 1294-1308 (2009).
25. N. Kriegeskorte, M. Mur, P. Bandettini, Representational similarity analysis – connecting the branches of systems neuroscience. Front Syst Neurosci 2 (4), 1-28 (2009).
26. P. Belin, S. Fillion-Bilodeau, F. Gosselin, The "Montreal Affective Voices": a validated set of nonverbal affect bursts for research on auditory affective processing. Behav Brain
Res 40, 531-539 (2008).
27. S. Fruhholz, W. Trost, S. A. Kotz, The sound of emotions-Towards a unifying neural network perspective of affective sound processing. Neurosci Biobehav Rev 68, 96-110 (2016).
28. C. Mendez-Bertolo, S. Moratti, R. Toledano, F. Lopez-Sosa, R. Martinez-Alvarez, Y. H. Mah, P. Vuilleumier, A. Gil-Nagel, B. A. Strange, A fast pathway for fear in human amygdala. Nat Neurosci 19, 1041-1049 (2016).
29. A. Pannese, D. Grandjean, S. Fruhholz, Subcortical processing in auditory communication. Hear Res 328, 67-77 (2015).
30. S. Fruhholz, W. Trost, D. Grandjean, The role of the medial temporal limbic system in processing emotions in voice and music. Prog Neurobiol 123, 1-17 (2014).
31. D. Sander, J. Grafman, T. Zalla, The human amygdala: an evolved system for relevance detection. Rev Neurosci 14, 303-316 (2003).
32. R. Adolphs, Neural systems for recognizing emotion. Curr Opin Neurobiol 12, 169-177 (2002).
33. S. Fruhholz, D. Sander, D. Grandjean, Functional neuroimaging of human vocalizations and affective speech. Behav Brain Sci 37, 554-555; discussion 577-604 (2014).
12
34. G. G. Berntson, A. Bechara, H. Damasio, D. Tranel, J. T. Cacioppo, Amygdala contribution to selective dimensions of emotion. Soc Cogn Affect Neurosci 2, 123-129 (2007).
35. R. Adolphs, J. Russel, D. Tranel, A role for the human amygdala in recognizing emotional arousal from unpleasant stimuli. Psychol Sci 10, 167-171 (1999).
36. C. D. Wilson-Mendenhall, L. F. Barrett, L. W. Barsalou, Neural evidence that human emotions share core affective properties. Psychol Sci 24, 947-956 (2013).
37. A. Touroutoglou, E. Bliss-Moreau, J. Zhang, D. Mantini, W. Vanduffel, B. C. Dickerson, L. F. Barrett, A ventral salience network in the macaque brain. Neuroimage 132, 190-197 (2016).
38. D. J. Anderson, R. Adolphs, A framework for studying emotions across species. Cell 157, 187-200 (2014).
39. L. Pessoa, R. Adolphs, Emotion processing and the amygdala: from a 'low road' to 'many roads' of evaluating biological significance. Nature Rev Neurosci 11, 773-782 (2010). 40. R. Remedios, N. K. Logothetis, C. Kayser, An auditory region in the primate insular
cortex responding preferentially to vocal communication sounds. J Neurosci 29, 1034-1045 (2009).
41. P. Kanske, S. A. Kotz, Emotion speeds up conflict resolution: a new role for the ventral anterior cingulate cortex? Cereb Cortex 21, 911-919 (2011).
Acknowledgments: Supported by UK’s Biotechnology and Biological Sciences Research Council
(grants BB/M009742/1 to JG, BLG, SAK, and PB, and BB/L023288/1 to PB and JG), by the
French Fondation pour la Recherche Médicale (grant AJE201214 to PB), and by Research
supported by grants ANR-16-CONV-0002 (ILCB), ANR-11-LABX-0036 (BLRI), and the
Excellence Initiative of Aix-Marseille University (A*MIDEX). Conceptualization: BLG, PB;
Methodology: BLG, CW, NK, SAK, PB, JG; Software: BLG; Validation: BLG; Formal Analysis:
BLG, CW, JG; Investigation: BLG, CW; Resources: BLG, PB; Data Curation: BLG, CW; Writing
- Original Draft: BLG, CW, SAK, PB, JG; Writing – Review & Editing: BLG, CW, NK, SAK,
PB, JG; Visualization: BLG; Supervision: BLG, PB, JG; Project Administration: JG; Funding
Acquisition: BLG, SAK, PB, JG. We thank Dr. Olivier Coulon and Dr. Oliver Garrod for help
13
Fig. 1:
Emotions in vocal stimuli. (A) Auditory stimuli were generated by morphing recordings of short
emotionally expressive vocalizations from the Montreal Affective Voices (19) portraying a neutral
state and four emotions. Bottom: Euclidean distance matrix between stimuli in morphing space
(each of five space dimensions measures the weight of each of the recorded vocalizations used to
generate the morphed stimuli – dashed lines highlight morphing continua between pairs of
recordings). Top: 2D non-metric MDS projection of the same morphing space. (B) Example of
morphing between three vocalizations expressing different emotions (female speaker) and
categorization responses (mean/error bar = bootstrap group averaged/standard error). (C) Effect of
morphing on perceived emotion attributes: group- and speaker-averaged semi-partial correlation
between morphing parameters (columns) and each of the perceived emotion attributes (rows). * p
14 Fig. 2:
Categorical and dimensional attributes of the perceptual structure of emotions in the voice.
(A) Right = categorical RDM averaged across participants and speakers, showing pairwise
stimulus differences in emotion categorization responses for the vocal stimuli (colors measure the
percent of morphing between non-morphed recordings); left = 2D MDS of categorical RDMs
(non-metric INDSCAL, see Supplementary Methods). Note the strong resemblance with the perceived
voice dissimilarity and MDS in C with the exception of the clustering of Pleasure and Neutral
voices. (B) Dimensional attributes of emotions in voices: group averaged valence and arousal
ratings, and corresponding RDMs and MDS representations. Note the strong valence differences
between negative emotions on the one hand and Pleasure and Neutral, on the other, and the large
arousal differences between Neutral and non-neutral voices. (C) Perceived voice dissimilarity
15
from morphs with the Neutral vocalization, characterized by lower arousal (panel B). (D) Encoding
of vocally expressed emotions in perceptual dissimilarity: bee swarm plot of semi-partial
correlations of emotion attribute RDMs with the perceptual dissimilarity RDM for each
experiment participant and speaker (all p < 0.05 FWE corrected across correlations and contrasts
except for valence semi-partial correlation; significant T(9) ≥ 4.2), and of the percent dissimilarity
variance explained by category and dimension attributes (T(9) = 10.28, p = 0.00002). See Fig. S4
16
Fig. 3:
Encoding of vocally expressed emotions in the spatio-temporal cerebral network. (A)
Non-selective encoding of perceived emotion attributes in fMRI response patterns, as measured by the
17
significance (p < 0.05 FWE = 0.05 corrected across voxels) are represented within a transparent
MNI template (ICBM 152 2009c, see Supplementary Methods). MEG analyses were constrained
spatially within the fMRI correlation masks (see Fig S3 for further fMRI results). (B) Selective
encoding of emotion categories at selected MEG latencies (left) and in fMRI (right), as measured
by the semi-partial rank correlation between category and MEG response RDMs. Statistical maps
thresholded for significance (red asterisk = global spatiotemporal peak of selective-encoding
statistic). The bottom panel shows the time-varying T(9) statistic used to assess the selective
encoding of emotion attributes in selected ROIs. Arrows highlight the peak-effect latency for each
ROI. The horizontal lines denote significant T(9) statistics – temporally overlapping significance
for different ROIs emerge for shared T-statistic spatio-temporal clusters. (C) Selective encoding
of valence and (D) arousal. (E) Contrasts of the MEG RDM variance explained uniquely by the
category vs. dimension encoding model (See Fig. S3 for pairwise MEG contrasts and fMRI
analyses). Also shown are the cerebral MEG RDMs at global contrast peaks. Note the similarity
of the cerebral RDMs in this figure to those for the arousal and categorization behavioral
judgments in Fig. 2. HG-L = left Heschl’s gyrus; m/a STG/MTG = mid/anterior superior/middle
18
List of Supplementary Materials
Supplementary Materials and Methods
Figures S1-S4
Tables S1-S4
Audio S1-S78
19
Supplementary Materials and Methods
Participants Ten right-handed healthy adults (5 female; age from 19 to 38, mean = 25.1)
participated in this study. All participants had normal hearing as assessed by an audiogram,
provided written informed consent, and received financial compensation of £6/hour for their
participation. The study was conducted in accordance with the Declaration of Helsinki and was
approved by the local ethics committee (College of Science and Engineering, University of
Glasgow).
Stimulus material Stimuli consisted of nonverbal emotionally expressive vocalizations from the
Montreal Affective Voices database (26) and were produced by two actors (one male, one female).
Each actor produced five vocalizations (vowel /a/) expressing: anger, disgust, fear, pleasure, and
neutral. Vocalizations normalized in root mean square (r.m.s.) amplitude were then used to
generate the stimulus set by morphing between each pair of vocalizations from the same speaker.
Voice morphing was performed using STRAIGHT (42) in Matlab (Mathworks, Inc, Natick, USA).
STRAIGHT performs an instantaneous pitch-adaptive spectral smoothing in each stimulus for
separation of contributions to the voice signal arising from the glottal source versus
supra-laryngeal filtering. A voice stimulus is decomposed by STRAIGHT into five parameters (f0,
frequency, duration, spectrotemporal density, and aperiodicity) that can be manipulated and
combined across stimuli independently of one another. Time-frequency landmarks to be put in
correspondence across voices during morphing were manually identified in each stimulus, and
corresponded to the frequencies of the first three formants at onset and offset of phonation.
Morphed stimuli were then generated by resynthesis based on the linear (time and aperiodicity)
and logarithmic (f0, the frequency structure and spectrotemporal density) interpolation of these
20
Two types of morphing continua were produced: 1) between neutral and each of the four emotions
(neutral-anger, neutral-disgust, neutral-fear, and neutral-pleasure), and 2) between pairs of
emotions (anger-disgust, anger-fear, anger-pleasure, disgust-fear, disgust-pleasure, and
fear-pleasure). The morphing continuum between neutral and each emotion consisted of 6 stimuli,
progressing in acoustically equal steps of 25% (e.g., neutral 100% neutral 75%/anger 25%
neutral 50%/anger 50% neutral 25%/anger 75% anger 100% anger 125%). The 125%
emotion was generated by extrapolating along the neutral-emotion dimension to create a
caricatured emotion. The morphing continuum between pairs of emotions consisted of 5 stimuli,
again progressing in acoustically equal steps of 25%. In total, 78 stimuli were used in the
experiment, consisting of 39 stimuli for each speaker (cf. Audio Files S1-S78). They were
normalized to the average duration of 796 ms using pitch-preserving time-stretching algorithms,
and then in root mean square amplitude.
Experimental design Each individual took part in 11 experimental sessions. Neuroimaging data
were collected during the first 8 sessions (4 fMRI and 4 MEG; imaging modalities alternated with
fMRI first for half of the participants; MEG at least 3 days after prior fMRI session to avoid
magnetization artefacts). Behavioral data were collected during the last three sessions, perceived
categorical and dimensional emotion attributes being estimated only during the last session to
avoid biases towards either during the rest of the experiment.
On each run of the fMRI and MEG acquisition (20 runs per fMRI session and at least 78 runs per
participant across all of the MEG sessions), participants were presented with all of the stimuli from
one speaker (random speakers order on each pair of subsequent blocks; inter-stimulus interval –
ISI – jittered between 3 and 5 s) while carrying out a one-back repetition detection task (1 repetition
21
Throughout the session, participants were instructed to fixate a cross, presented in greyscale
(screen field of view = 19x80 and 26x19 degrees for fMRI and MEG, respectively).
At each of the first two behavioral sessions, participants rated the dissimilarity between all of the
stimuli from the same speaker (speaker order counterbalanced across participants). On each trial,
they were presented with one of the possible 741 pairs of sounds (within-pair ISI = 250ms; random
within-pair order) and were asked to rate how dissimilar they were by placing a slider along a
visual analogue scale marked “very similar” and “very dissimilar” at the two extremes. They could
listen to the pair of stimuli as many times as necessary before giving a response. This experimental
phase was preceded by an initial familiarization phase during which participants were presented
with all of the sound stimuli two times (ISI = 250 ms; random order). In this phase, they were
instructed to estimate the maximum and minimum between-sound dissimilarity, so as to optimize
the usage of the rating scale in the subsequent experimental phase. The procedure was initially
practiced with a set of 10 vocalizations not included in the main experiment.
During the last behavioral session, participants performed two tasks – emotion categorization and
ratings of dimension attributes. In the categorization task, they identified the emotion as being
anger, disgust, fear, or pleasure. In the rating tasks, participants rated each stimulus on arousal
(low to high) and valence (negative to positive) using an on-screen slider. Before the experiment
began, participants were given 10 practice trials for both the categorization and rating tasks on an
independent set of vocal stimuli. Participants were then familiarized to the entire stimulus set
before the first block. On each block of trials, participants carried out either the category or rating
tasks (alternated across blocks) for all of the stimuli from the same speaker (pseudo-random order
22
session, each of the two tasks was repeated three times for each of the speakers, for a total of 12
blocks of trials.
Sound stimuli (sampling rate = 48 kHz; bit depth = 16 bit) were presented through electrostatic
headphones (NordicNeuroLab, Bergen, Norway) for fMRI, Etymotic ER-30 tubephone for MEG,
and during the behavioral sessions through BeyerDynamic DT 770 Pro headphones receiving the
audio signal from the Audiophile 2496 sound card amplified with a Mackie 1604-VLZ PRO
monitor system. The MEG tubephone system introduced strong spectral coloring of the sound
stimuli and suppressed heavily frequencies > 6 kHz. Stimuli for all sessions were consequently
low-pass filtered at 5 kHz. Flat-frequency response for the MEG audio stimulation chain was
achieved through inverse filtering methods.
Neuroimaging data acquisition fMRI scans were acquired with a Siemens 3T Trio scanner, using
a 32-channel head coil. Functional multiband echo planar imaging (EPI) volumes were collected
with a repetition time (TR) of 1s (echo time TE = 26 ms; flip angle = 60; multiband factor = 4;
GRAPPA = 2). Each functional volume included 56 slices of 2.5 mm thickness (inter-slice gap =
2.5 mm; interleaved even acquisition order (interleaved even) in an axial orientation along the
direction of the temporal lobe, providing nearly whole-brain coverage. The in-plane voxel size was
2.5 mm2 (78 × 78 matrix). A whole-brain, high-resolution, structural T1-weighted MP-RAGE
image (192 sagittal slices, 256 × 256 matrix size, 1 mm3 voxel size) was also acquired to
characterize the subjects’ anatomy. In each of the fMRI sessions, we also collected a field map to
correct for geometric distortions in the EPI volumes caused by magnetic field inhomogeneities
(43).
MEG recordings were acquired with a 248-magnetometers whole-head MEG system (MAGNES
23
The position of five coils, marking fiducial landmarks on the head of the participants, was acquired
at the beginning and at the end of each block.
Analysis of behavioral data We initially assessed the effect of voice morphing on perceived
emotion attributes (five morphing % parameters describing each experimental stimulus – one for
each expressed emotion and one for the neutral vocalization; six measures of perceived emotion –
four emotion categorization probabilities plus valence and arousal ratings). The five morphing
parameters were not orthogonal because for each stimulus only two at best had a non-zero value
(average Spearman correlation between morph parameters = -0.24; STD = 0.02). For this reason,
the perceptual effect of morph parameters was assessed independently of their shared variance by
measuring their Spearman semi-partial correlation (s.p.r) with the measures of perceived emotion.
Significance testing for all of the analyses in this study relied on a permutation-based group-level
random effects (RFX) approach. Here, we: [1] estimated independently for each participant and
speaker the null s.p.r distribution for each of the 30 morph/emotion pairs by permuting randomly
the stimulus labels (N permutations = 100,000; same permutations across speakers and
morph/emotion pairs, but not across participants); [2] averaged across speaker genders permuted
and unpermuted s.p.r. converted to the Fisher Z scale; [3] subtracted the median bias of the null
s.p.r distributions from both the permuted and unpermuted s.p.r.; [4] computed the T(9) test for
the group-average permuted and unpermuted s.p.r.; [5] finally established significance thresholds
for the unpermuted T(9) tests as the 95th percentile of the distribution of the maximum of the
absolute value of the permuted T(9) statistics (two-sided inference) across pairs of morph
parameters with perceived emotion measures, thus controlling for family-wise error (FWE) at a
24
Subsequent modeling of behavioral data assessed the association of perceived stimulus
dissimilarity (pairwise dissimilarity ratings) with perceived emotion categories, valence and
arousal (each transformed to a pairwise stimulus distance – emotion representational dissimilarity
matrix RDM). The valence and arousal RDMs measured the absolute pairwise difference in
valence and arousal ratings, respectively. The category RDM was defined as the Euclidean
distance between stimulus-specific categorization response profiles (e.g., categorization profile
consisting of 10, 2, 1 and 0 anger, disgust, fear and pleasure responses). All emotion RDMs were
computed independently for each participant and speaker. Significance testing relied on a similar
approach as for the analysis of the effect of morph parameters on perceived emotion attributes (N
permutations = 100,000; reshuffling of rows and columns of distance matrices). Importantly,
however, we opted for one-tailed inference to assess the significance of the correlation between
emotion RDMs themselves (FWE = 0.05 across the three pairwise correlations) and the correlation
and semi-partial correlations between emotion RDMs, on the one hand, and the dissimilarity
ratings, on the other. Additional contrasts compared the proportion of dissimilarity rating variance
uniquely explained by each of the three emotion RDMs, and by the category RDM vs. the
dimensional attribute RDMs together (square root of unique explained variances Fisher Z
transformed prior to contrast; two-tailed inference for all contrasts; FWE = 0.05 adjusted across
the three pairwise contrasts; two-tailed percentile p-values for categories vs. dimensions contrast).
Preprocessing of neuroimaging data Analyses were carried out in Matlab using SPM12, Fieldtrip
(44), GLMdenoise (45) and custom code. The initial preprocessing of fMRI and MEG data
produced for each participant the stimulus-specific responses further analyzed to assess the
encoding of emotion attributes (see below). Functional MRI images from all runs were realigned
25
(full width at half maximum – FWHM = 5 and 4 mm for realignment and unwarp, respectively;
for both 7th degree B-spline for interpolation), and slice time corrected to the onset of the
temporally central slice. Anatomical volumes were co-registered to the grand-average of the
preprocessed functional volumes and segmented into grey matter, white matter, and cerebro-spinal
fluid. Diffeomorphic Anatomical Registration using Exponentiated Lie algebra (46) (DARTEL)
was used to create a common brain template for all of the participants. An initial group DARTEL
grey-matter mask was created by considering all non-cerebellum voxels with a grey-matter
probability > 0.1. The final analysis mask for each individual was given by the 6-connected voxels
within the conjunction of the group mask deformed to native space with the voxels associated with
a participant-specific grey-matter probability > 0.25.
For each participant, the 80 fMRI runs (40 for each of the two speaker genders) were divided into
5 mixed-gender groups of 16 runs each (interleaved assignment of runs to groups). Unsmoothed
native-space data within the analysis mask for each group of runs were analyzed within a massively
univariate general linear model (GLM) that estimated the fMRI response specific to each stimulus.
Stimulus-specific regressors were created by convolving a sound on-off binary time-series with
the canonical hemodynamic response function (HRF). The GLM included a high-pass discrete
cosine transform (DCT) filter (cut off = 128 s), the head motion regressors estimated during the
realignment step and a run-specific intercept. The GLM also included additional noise regressors
that modeled temporal effects unrelated to the stimulus condition (e.g., blood pulse). They were
estimated independently for each of the groups of runs and participants using GLMdenoise ((45);
default polynomial detrending replaced with DCT filter), resulting in N noise regressors = 6 on
26
Several initial steps of the preprocessing of MEG data were carried out on the unsegmented data
from each run. Infrequent SQUID jumps (observed in 2.3% of the channels, on average) were
repaired using piecewise cubic polynomial interpolation. For each participant independently, we
then removed channels that consistently deviated from the median spectrum (shared variance <
25%) on at least 25% of the runs (N removed channels = 8.4 on average; STD = 2.2). Runs
associated with excessive head movements or MEG channels noise or containing reference
channel jumps were finally discarded, leaving on average 75.9 runs per participant (range = 65–
84; average maximum coil movement across blocks and participants = 5 mm; STD = 1 mm).
Environmental magnetic noise was removed an initial time using regression based on principal
components of reference channels. Both the MEG and reference data were then filtered using a
forward-reverse 70 Hz FIR low-pass (-40 dB at 72.5 Hz), a 0.2 Hz elliptic high-pass (-40 dB at 0.1
Hz) and a 50 Hz FIR notch filter (-40 dB at 50 ± 1Hz), and were subsequently resampled to 150
Hz. Residual magnetic noise was then removed applying once more the same method as for the
full-resolution signal. ECG and EOG artifacts were removed using ICA (runica on 30 components)
and were identified based on the time course and topography of IC components (47). MEG data
from each run was finally segmented into trials (-0.2 to 1.3 s after sound onset).
A native-space source-projection grid with a resolution of 3.5 mm was prepared for each
participant by resampling the native-space analysis mask for the fMRI data. Depth-normalized
lead fields were computed based on a single shell conductor model. Source-projection filters were
then computed for each run using LCMV beamformers (regularization = 5%; sensor covariance
across all trials excluding repetitions) and reduced to the maximum-variance orientation across all
27
mixed-gender groups of runs (interleaved assignment of runs to groups), leading to a reduction of
the computational burden for subsequent data-analysis steps.
Cerebral encoding analysis We implemented a whole-brain searchlight representational similarity
analysis (RSA;(25); Fig. S1) to assess the encoding of perceived emotion attributes in multivariate
spatial (fMRI) and spatiotemporal (MEG) cerebral response patterns. We followed the same
approach adopted for the analysis dissimilarity rating data, and measured here the association
between emotion and cerebral response RDMs.
For fMRI, cerebral RDMs were computed in native space within a spherical region (6 mm
diameter) centered at each grey-matter mask location (at least 50% in-mask voxels). In particular,
we computed the cross-validated Mahalanobis distance between stimulus-specific response
patterns (Mahalanobis whitening of stimulus-specific GLM estimates using the GLM residuals
within the searchlight) by cross-validating the response pattern covariance across the 5 groups of
mixed-gender runs, and finally converting it to a (whitened) Euclidean distance (48, 49). For MEG,
cerebral RDMs were computed within a spatiotemporal searchlight of 10 mm diameter and 50 ms
temporal window from -0.15 to 1.1 seconds from onset with 15 ms of overlap between subsequent
temporal windows. For each searchlight, we derived the cross-validated Euclidean distance
between specific beamformed time-courses from the covariance between
stimulus-specific response patterns cross-validated between the 5 groups of mixed-gender runs.
RSA analyses assessed, in order: [1] the Spearman correlation between cerebral and emotion
RDMs (non-selective encoding; one sided inference); [2] the Spearman s.p.r between cerebral and
emotion RDMs (selective encoding; one sided inference); [3] the pairwise contrasts of the unique
cerebral RDM variance explained by each of three pairs of emotion RDMs, and [4] the explained
28
arousal together; two-sided inference for all contrasts). Importantly, within each imaging modality,
we: [1] computed all encoding measures in native space and carried out group-level RFX inference
(T tests) on the encoding maps transformed to the group DARTEL space (FWHM of Gaussian
smoothing of native-space encoding maps = 8 for both fMRI and MEG); [2] used cluster mass
enhancement of the group-level statistics, permutations included (permutation of rows and
columns of RDMs, as for analysis of perceptual dissimilarity; 3D and 4D spatiotemporal cluster
mass enhancement for fMRI and MEG, respectively; cluster-forming threshold of T(9) = 1.83 and
2.26 for one- and two-sided inference, respectively; (50)); [3] mitigated the multiple comparison
problem by constraining analysis masks at each testing step within the significance mask from the
previous step (correlations tested at whole brain and latency-range levels; s.p.r within significant
correlation masks; variance contrasts within significant s.p.r masks). For MEG we assessed the
initial cerebral response/emotion attribute RDM correlations within the significant correlation
masks from the fMRI analysis, providing a further mitigation of the multiple comparison problem
and capitalizing on the superior spatial and temporal specificity of fMRI and MEG, respectively.
At all steps, we corrected for multiple comparisons within the entire analysis mask by establishing
significance thresholds for the non-permuted cluster-mass enhanced T statistics as the 95th
percentile of the permutation distribution for within-mask CM enhanced maxima for one-sided
tests and as the 2.5th and 97.5th percentiles of within-mask minima and maxima, respectively for
two-sided inference (maximum-statistic approach; FWE = 0.05).
Visualization The non-metric MDS models in Fig. 1 and 2 were computed using the R-package
SMACOF (51). We modeled the dissimilarity ratings and the emotion RDMs using an
inter-individual difference scaling model (INDSCAL), avoiding well known distortions of the
29
brains in Fig. 3 and S3 comprised two components: [1] a mesh of the ICBM 152 2009c Nonlinear
Asymmetric template (53); [2] the functional blobs, rendered by first modeling the surface of each
blob with a 3D mesh, and then projecting onto it the volumetric statistical map it circumscribed
(maximum projection within 7 mm radius sphere centered at mesh vertex). All meshes and
projections were computed within BrainVISA (http://brainvisa.info/), and were rendered using a
custom OpenGL shader for the transparency effect.
References
42. H. Kawahara, H. Matsui, S. In Proc. 2003 IEEE International Conference on Acoustics, and Signal Processing, Vol. I, pp. 256-259,, 2003., in Proc. 2003 IEEE International
Conference on Acoustics, Speech, and Signal Processing (ICASSP 2003). ( Hong Kong,
2003), pp. 256-259.
43. C. Hutton, A. Bork, O. Josephs, R. Deichmann, J. Ashburner, R. Turner, Image distortion correction in fMRI: A quantitative evaluation. Neuroimage 16, 217-240 (2002).
44. R. Oostenveld, P. Fries, E. Maris, J. M. Schoffelen, FieldTrip: Open source software for advanced analysis of MEG, EEG, and invasive electrophysiological data. Comput Intell
Neurosci 2011, 156869 (2011).
45. K. N. Kay, A. Rokem, J. Winawer, R. F. Dougherty, B. A. Wandell, GLMdenoise: a fast, automated technique for denoising task-based fMRI data. Front Neurosci 7, 247
(2013)10.3389/fnins.2013.00247).
46. J. Ashburner, A fast diffeomorphic image registration algorithm. Neuroimage 38, 95-113 (2007).
47. J. F. Hipp, M. Siegel, Dissociating neuronal gamma-band activity from cranial and ocular muscle activity in EEG. Front Hum Neurosci 7, 338 (2013)10.3389/fnhum.2013.00338). 48. A. Walther, H. Nili, N. Ejaz, A. Alink, N. Kriegeskorte, J. Diedrichsen, Reliability of
dissimilarity measures for multi-voxel pattern analysis. Neuroimage 137, 188-200 (2016). 49. J. Diedrichsen, N. Kriegeskorte, Representational models: A common framework for
understanding encoding, pattern-component, and representational-similarity analysis.
PLoS Comput Biol 13, e1005508 (2017).
50. E. Maris, R. Oostenveld, Nonparametric statistical testing of EEG- and MEG-data. J
Neurosci Methods 164, 177-190 (2007).
51. J. de Leeuw, P. Mair, Multidimensional Scaling Using Majorization: SMACOF in R. J
Stat Softw 31, 1-30 (2009).
52. F. G. Ashby, W. T. Maddox, W. W. Lee, On the dangers of averaging across subjects when using multidimensional scaling or the similarity-choice model. Psychol Sci 5, 144-151 (1994).
53. V. Fonov, A. C. Evans, K. Botteron, C. R. Almli, R. C. McKinstry, D. L. Collins, G. Brain Development Cooperative, Unbiased average age-appropriate atlases for pediatric studies. Neuroimage 54, 313-327 (2011).
30
Fig. S1:
Representational similarity analysis of the encoding of perceived emotion attributes in spatio-temporal cerebral response patterns. (A) Spatial (fMRI) and spatio-temporal (MEG)
stimulus-specific response patterns (percent signal change and source-space event-related fields
for fMRI and MEG, respectively) were extracted within a grey-matter spherical searchlight
(radius: 6 and 10 mm for fMRI and MEG, respectively). The MEG spatio-temporal searchlight
had a duration of 50ms and an overlap with subsequent windows of 15ms. (B) Cerebral encoding
analyses involved the measurement of the association between the pairwise distance of
stimulus-specific cerebral responses (cerebral representational dissimilarity matrices – RDMs) and the
pairwise distance of stimulus-specific perceived emotion attributes (emotion RDMs). (C) For each
modality, encoding tests were carried out in subsequent steps within nested significance masks.
31
correlation of each with the cerebral RDMs. Note that emotion attribute RDMs are correlated (see
main text) and explain overlapping portions of the cerebral RDM variance. The second step
focused on portions of the cerebral RDM variance explained uniquely by each emotion attribute,
and assessed their selective encoding by means of their semi-partial correlations with the cerebral
RDMs. Finally, we directly contrasted the explained cerebral RDM variance specific to the
category- or dimension-encoding model, and the unique explained cerebral RDM variance specific
to each of the three perceived emotion attributes (three pairwise contrasts). Subsequent tests were
carried out independently with the two modalities, with the important exception of constraining
the non-selective MEG encoding tests within those brain areas characterized by non-selective
32
Fig. S2:
Time-varying emotion encoding in MEG data. Time courses for the MEG T(9) statistics used
to assess the selective encoding of emotion attributes and to contrast the MEG RDM variance
explained by the category vs. dimension models. The time courses are extracted from the global
and local peaks of the MEG statistical maps (see Table S1). HG-L = left Heschl’s gyrus; m
STG/MTG = mid superior/middle temporal gyrus; IFGt = inferior frontal gyrus, pars triangularis.
33
Fig. S3:
Encoding of the perceived emotional attributes of voices in spatiotemporal (MEG) and spatial (fMRI) cerebral response patterns. All effects significant at p < 0.05 FWE corrected
across voxels (fMRI and MEG) and time points (MEG) within the analysis masks.p/m/a STG-R
= right posterior/mid/anterior superior temporal gyrus; STS = superior temporal sulcus; IFGop/t
= inferior frontal gyrus, pars opercularis/triangularis; HG = Heschl’s gyrus. See Fig. 3 and
34
Fig S4:
Encoding of perceived dissimilarity in cerebral response patterns. We tested for the cerebral
encoding of the perceived dissimilarity of the emotionally expressive stimuli using the same
correlation approach as for the emotion attribute RDMs. The MEG analysis was constrained
within the mask for a significant correlation between fMRI RDMs and dissimilarity ratings data.
All effects shown significant at FWE < 0.05. mSTG-L = left mid superior temporal gyrus; IFGt
= inferior frontal gyrus, pars triangularis; HG = Heschl’s gyrus; RolOp = Rolandic operculum.
35
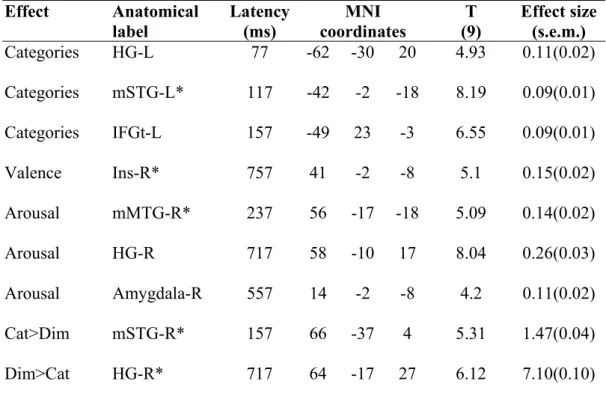
Table S1: Global and local peaks of main emotion encoding analyses in MEG data. The
table lists global and local peaks in the GLM T-maps. Anatomical labels are based on the
Automated Anatomical Labeling (AAL) atlas. HG-L = left Heschl’s gyrus; mSTG/MTG = mid
superior/middle temporal gyrus; IFGt = inferior frontal gyrus, pars triangularis; Ins = insula;
Amy = amygdala; * = global peak; effect size = group averaged of native-space semi-partial
correlations at corresponding voxels and of explained variance contrasts; SEM = standard error
of the participant average. All effects significant at p < 0.05 FWE corrected across voxels and
time points. Effect Anatomical label Latency (ms) MNI coordinates T (9) Effect size (s.e.m.) Categories HG-L 77 -62 -30 20 4.93 0.11(0.02) Categories mSTG-L* 117 -42 -2 -18 8.19 0.09(0.01) Categories IFGt-L 157 -49 23 -3 6.55 0.09(0.01) Valence Ins-R* 757 41 -2 -8 5.1 0.15(0.02) Arousal mMTG-R* 237 56 -17 -18 5.09 0.14(0.02) Arousal HG-R 717 58 -10 17 8.04 0.26(0.03) Arousal Amygdala-R 557 14 -2 -8 4.2 0.11(0.02) Cat>Dim mSTG-R* 157 66 -37 4 5.31 1.47(0.04) Dim>Cat HG-R* 717 64 -17 27 6.12 7.10(0.10)
36
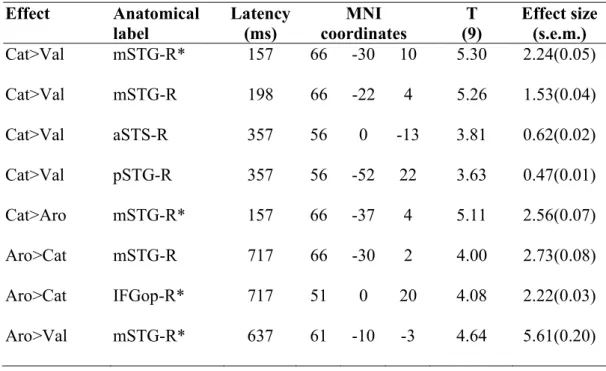
Table S2: Global and local peaks of pairwise contrasts between the MEG variance explained by each emotion attribute. The table lists global and local peaks in the GLM
T-maps. Cat = categories; Val = valence; Aro = Arousal;m/pSTG-R = right mid/posterior superior
temporal gyrus; aSTS = anterior superior temporal sulcus; IFGop = left inferior frontal gyrus,
pars opercularis. All effects significant at p < 0.05 FWE corrected within the analysis mask. See
Table S1 for further details.
Effect Anatomical label Latency (ms) MNI coordinates T (9) Effect size (s.e.m.) Cat>Val mSTG-R* 157 66 -30 10 5.30 2.24(0.05) Cat>Val mSTG-R 198 66 -22 4 5.26 1.53(0.04) Cat>Val aSTS-R 357 56 0 -13 3.81 0.62(0.02) Cat>Val pSTG-R 357 56 -52 22 3.63 0.47(0.01) Cat>Aro mSTG-R* 157 66 -37 4 5.11 2.56(0.07) Aro>Cat mSTG-R 717 66 -30 2 4.00 2.73(0.08) Aro>Cat IFGop-R* 717 51 0 20 4.08 2.22(0.03) Aro>Val mSTG-R* 637 61 -10 -3 4.64 5.61(0.20)
37
Table S3: Global and local peaks of emotion encoding and explained variance contrast analyses in fMRI data. The table lists global and local peaks in the GLM T-maps. HG-L = left
Heschl’s gyrus; IFGt/op = inferior frontal gyrus, pars triangularis/opercularis; m/a STG/STS =
mid/anterior superior temporal gyrus/sulcus. All effects significant at p < 0.05 FWE corrected
within the analysis mask. See Table S1 for further details.
Effect Anatomical label MNI coordinates T (9) Effect size (s.e.m.) Categories HG-L* -56 -14 0 5.89 0.20(0.02) Categories IFGt-L -52 20 2 4.03 0.15(0.02) Categories mSTG-R 66 -32 10 5.79 0.19(0.02) Valence pSTG-R* 54 -47 14 6.17 0.16(0.01) Arousal aSTG-L* -46 6 -13 6.31 0.20(0.01) Arousal mSTS-R 61 -32 0 4.39 0.17(0.02) Arousal IFGop-R 48 0 17 3.12 0.17(0.02) Cat>Val mSTG-R 66 -27 7 3.68 2.68(0.05) Cat>Val mSTG-L* -64 -32 14 4.5 2.08(0.02) Aro>Val mSTG-R* 66 -22 4 4.26 1.28(0.06)
38
Table S4: Global and local peaks of encoding of perceived voice dissimilarity in fMRI and MEG cerebral response patterns. The table lists global and local peaks in the GLM T-maps for
testing the correlation between fMRI and MEG cerebral response patterns and perceptual voice
dissimilarity as estimated from behavioral responses. mSTG-L = right mid superior temporal
gyrus; RolOp = Rolandic operculum; HG-L = left Heschl’s gyrus. All effects significant at p <
0.05 FWE corrected within the analysis mask. See Table S1 for further details.
Modality Anatomical label MNI coordinates T (9) Effect size (s.e.m.) Latency (ms) fMRI mSTG-L* -64 -34 14 16.15 0.22(0.01) fMRI mSTG-L -62 -10 -8 14.68 0.20(0.02) fMRI RolOp-R 61 -7 10 9.29 0.23(0.02) fMRI IFGt-L -46 26 7 3.61 0.12(0.01) MEG mSTG-L -62 -47 -6 13.97 0.14(0.02) 117 MEG mSTG-R* 44 -30 -6 17.97 0.19(0.02) 237 MEG HG-L -46 -44 22 7.26 0.13(0.02) 717 MEG RolOp-R 64 -17 20 12.24 0.26(0.02) 757