Publisher’s version / Version de l'éditeur:
Journal of the Less-Common Metals, 134, pp. 15-26, 1987-01-01
READ THESE TERMS AND CONDITIONS CAREFULLY BEFORE USING THIS WEBSITE. https://nrc-publications.canada.ca/eng/copyright
Vous avez des questions? Nous pouvons vous aider. Pour communiquer directement avec un auteur, consultez la première page de la revue dans laquelle son article a été publié afin de trouver ses coordonnées. Si vous n’arrivez pas à les repérer, communiquez avec nous à PublicationsArchive-ArchivesPublications@nrc-cnrc.gc.ca.
Questions? Contact the NRC Publications Archive team at
PublicationsArchive-ArchivesPublications@nrc-cnrc.gc.ca. If you wish to email the authors directly, please see the first page of the publication for their contact information.
NRC Publications Archive
Archives des publications du CNRC
This publication could be one of several versions: author’s original, accepted manuscript or the publisher’s version. / La version de cette publication peut être l’une des suivantes : la version prépublication de l’auteur, la version acceptée du manuscrit ou la version de l’éditeur.
Access and use of this website and the material on it are subject to the Terms and Conditions set forth at
Mg2Ni hydride: in situ heat conduction calorimetry of the phase
transition near 510 K
Post, M.L.; Murray, J.J.
https://publications-cnrc.canada.ca/fra/droits
L’accès à ce site Web et l’utilisation de son contenu sont assujettis aux conditions présentées dans le site LISEZ CES CONDITIONS ATTENTIVEMENT AVANT D’UTILISER CE SITE WEB.
NRC Publications Record / Notice d'Archives des publications de CNRC:
https://nrc-publications.canada.ca/eng/view/object/?id=488493bd-aaf8-4f37-bb62-a5490b826ad5 https://publications-cnrc.canada.ca/fra/voir/objet/?id=488493bd-aaf8-4f37-bb62-a5490b826ad5Journal of the Less- Common M etals, 134 (1987) 15 - Zti 15 zyxwvutsrqponmlkjihgfedcbaZYXWVUTSRQPONMLKJIHGFEDCBA
Mg,Ni HYDRIDE-: IN SITU HEAT CONDUCTION CALORIMETRY OF
THE PHASE TRANSITION NEAR 510 K zyxwvutsrqponmlkjihgfedcbaZYXWVUTSRQPONMLKJIHGFEDCBA M . L. POST dnd J. J. M URRA Y
Division of Chemistry , National Research Council of Canada, Ottawa, Ontario, KlA O R9 (Canada) zyxwvutsrqponmlkjihgfedcbaZYXWVUTSRQPONMLKJIHGFEDCBA (Received October 30,1986)
Precision twin-cell heat conduction (Tin-Covets calorimetry has been used to study the thermal effects associated with the solid state transition exhibited by Mg,Ni hydride at approximately 510 K. Hydrides have been prepared in situ, at temperatures below and above that of the transition, and the products subjected to slow temperature scans through the transition, with hydrogen pressure being ~ontinuo~~y monitored. The low temperature (LT) and high ~mperature (HT) hydrides have, within error, the same stoichiometry : MgzNiH,.al i 0.03. Calorimetric data distinguishes three LT and two HT modifications, the predominating phase system depending on the thermal history of the hydride. Transition enthalpies for hydrides prepared in the LT and HT regions are significantly different with values of AH,, = 3.99 k-O.05 kJ (mol HZ)-’ and 4.16 + 0.04 kJ (ma1 H&l respec- tively _
1. Introduction
When exposed to gaseous hydrogen at moderate temperatures and pres- sures, Mg,Ni forms a hydride of composition Mg,NiH,, El], with the actual hydrogen stoichiometry being reported within the range 3.8 to 4.0. At approx~a~ly 510 K, the hydride exhibits a solid state phase transition between high temperature (HT) and low temperature (LT) forms 121. The structural modifications invulved have been the subject of a number of studies based on X-ray, neutron or electron diffraction techniques [l - 231. A lack of agreement between the reported structures, particularly for the LT modification(s), had implied a complicated phase relationship, but a recent diffraction analysis [22J invoking the existence of planar stacking faults [24f and, subsequently, their apparent identification by electron micros- copy [23], has helped to clear some of the conflict existing in the earlier work. However, there remain some anomalous phase phenomena, and Mg*NiH,, still represents a complex system, with LT and HT forms exhib- iting disorder, the reported existence of a pressure stabilized LT phase
16 zyxwvutsrqponmlkjihgfedcbaZYXWVUTSRQPONMLKJIHGFEDCBA
[5, 201 and the additional possibility of hydrogen deficiency [20, 251 for some of the structural modifications.
In the present work, precision calorimetric (Tian-Calvet) techniques have been applied to obtain the thermal characteristics associated with the
phase transition. Hydrides have been prepared zyxwvutsrqponmlkjihgfedcbaZYXWVUTSRQPONMLKJIHGFEDCBAin situ and in the absence of air from high purity Mg,Ni [26] at temperatures below and above the transi-
tion temperature. The hydrides were then subjected to slow temperature scans through the transition. In order to observe any composition changes, the hydrogen gas pressure above the hydride was continuously monitored. Evidence is presented which supports the existence of apparently stable structural modifications in addition to those previously identified by diffrac- tion methods at ambient [ 1 - 231 and high pressures [ 5,20,25].
2. Experimental details
2.1. Calorimetry
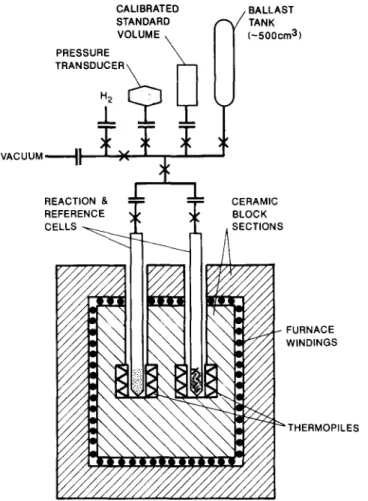
The calorimeter, constructed by Setaram, Lyon, France, is of the twin-cell, differential heat conduction (Tian-Calvet) type, rated for opera- tion at temperatures from 300 to 1250 K. The major construction material is alumina, the instrument size is 1 m (diameter) X 1.3 m and it weighs 150 kg. A stainless steel (type 316) reactor, designed to allow preparation of the hydride and containment of the powdered product (and an identical reactor containing a non-reactive reference material, stainless steel rods, of equal volume and approximate thermal capacity to that of the hydride) was inserted into the calorimeter detection zones and attached to an ex- ternal thermostatted (305.00 f 0.05 K) manifold to facilitate gas manip- ulations. To provide maximum accuracy in stoichiometry determination, the reactor free volume was minimized (approximately 15 cm3), and the accessible sample volume was 8 cm 3. The overall experimental arrangement is shown in Fig. 1. Some other technical features of this type of system have been described previously [27]. The principal instrument output is the net e.m.f. (P,P,) produced between the thermopiles, connected in electrical opposition, surrounding the calorimeter reaction and reference zones. For the treatment of the data, procedures described in detail by Calvet and Prat [28] and Gravelle [29] were followed. Briefly, the thermopile signal
PIP, is corrected for the existence of a “ baseline” displacement, which in the present work is normally linear with temperature and can be selected following observation of the P,P, character before and after the thermal event. Integration of PIP2 us. time then yields an area which is proportional to the energy of the process occurring, the proportionality constant being the calorimeter sensitivity. Each thermopile consists of 450 Pt/ Pt-lO%Rh junctions which, for the present experimental configuration and within the
temperature range employed (390 - 700 K), provides a calibrated sensitivity close to 3 p;V (mW)-‘. Details of the calibration techniques will be described elsewhere [ 301. Temperature control of the calorimeter and acquisition of
CALIBRATED STANDARD VOLUME PRESSURE TRANSDUCER dl BALLAST TANK L-500cm3) VACUUM+ ”
REACTION & CERAMIC
FURNACE WINDINGS
‘THERMOPIL .ES zyxwvutsrqponmlkjihgfedcbaZYXWVUTSRQPONMLKJIHGFEDCBA
Fig. 1 Diagram of the twin-cell heat conduction calorimeter, reactors and gas handling manifold. t, stainless steel bellows seal valve (Nupro; 4BK);S, copper gasketted dis-
connect (Cajon; V CR). zyxwvutsrqponmlkjihgfedcbaZYXWVUTSRQPONMLKJIHGFEDCBA
data from the overall system was achieved with the use of a Hewlett-Packard 9825A computer and in-house written software [31]. The calorimeter was operated isothermally (within +0.02 K) during hydride preparations, and in a constant rate temperature scanning mode for phase transition investiga- tions. Scan rates between k-O.2 and +8 K h-r were used and scan linearity was better than 0.2% over the employed scan widths of 65 - 75 K. Scan re- producibility was excellent, this being a factor of particular importance in the present case, where inter-run comparison of data is necessary.
2.2. zyxwvutsrqponmlkjihgfedcbaZYXWVUTSRQPONMLKJIHGFEDCBAM g,Ni preparation Material of composition Mg,Ni was prepared as follows: (i) by direct combination of the high purity elements, at 740 - 860 K, in a vapour- exchange-diffusion reaction which was achieved inside a welded stainless
18 zyxwvutsrqponmlkjihgfedcbaZYXWVUTSRQPONMLKJIHGFEDCBA
steel capsule, and is described in detail elsewhere [26] ; (ii) by reaction of material with a composition Mg,.,, Ni (HY-STOR 301; MPD Technology) with nickel powder in the required stoichiometric proportions to produce Mg,Ni using the same technique. The products crushed easily to grey powders (less than 100 pm). Chemical and spectroscopic analyses of material from (i) yielded MgZ_00+0.03 Ni; less than 0.2 at.% total impurities and less than 1000 ppma oxygen. X-ray analysis using diffractometry (MO Kcu) and overexposed Guinier film (Cu Ka) techniques indicated that the samples were free from unreacted magnesium and nickel. There was no evidence, in the calorimetric data obtained during stepwise hydriding, of the anomalously high enthalpy values which would be associated with the formation of MgH, (A~~(MgH*) = -78 kJ (mol Hz)-’ in comparison with A~**~(Mg~NiH~) $2 -28 to -50 kJ (mol Hz)-’ for 0 <x < 0.3 130, 321) again indicating the absence of free magnesium.
2.3. zyxwvutsrqponmlkjihgfedcbaZYXWVUTSRQPONMLKJIHGFEDCBAHy dride preparation
Each Mg,Ni sample (2 - 5 g) was activated, within the calorimeter, by fully hydriding-dehydriding several times at 573 K. The product was sub- jected to stepwise hydriding to confirm the form of the pressure US. composi- tion (p-c) isotherm. The calorimeter temperature was then set to that required for hydride prep~ation and the fi phase, of composition close to Mg,NiH,,, was prepared by addition of several large aliquots of hydrogen. For LT preparations, the rate of hydrogen addition was controlled to avoid a temperature excursion of the hydride into the HT region, owing to the exothermic absorption process. Preparation temperatures were 390, 420, 470 and 573 K, and in all cases the final hydrogen pressure pH, exceeded
that of desorption p&s at the highest subsequent scan temperature (not more than 560 K), thus preluding hydrogen loss from the hydride resulting from thermal decomposition. Hydride stoichiometry was calculated using standard gas titration techniques, with gas pressures being recorded with a capacitance transducer (Setra, model 204; better than 0.05% reproducibility and hysteresis). Expansion factors (i.e. effective volumes) between manifold and reactors with sample and reference material in place were measured using helium at each of the preparation temperatures, and hydrogen loss from the system by permeation f333 through the portion of the stainless steel cells at temperature was measured in separate empty cell experiments. Overall stoichiometry accuracy is estimated at better than *a%. The extent and/or completion of the hydriding reaction could be followed by pressure behaviour and PIP2 response, the latter being a particularly sensitive indicator of a slow continuation in hydrogen uptake even when pH, changes were insignificant. (For example, the enthalpy of formation of Mg,NiH,,, from the hydrogen saturated 01 phase (Mg,NiH& is, as calorimetrically measured [30, 323, /AHffa- +P)l = 65.2 kJ (mol Hz)-“. Thus an uptake of lo-’ mol H,, over a period of 1 h, would result in a continuous PIP2 signal of about 0.5 PV from baseline, or approximately 16 times PIP2 noise levels. This quantity of gas represents 0.02% of the gas phase hydrogen within the
19 zyxwvutsrqponmlkjihgfedcbaZYXWVUTSRQPONMLKJIHGFEDCBA
system at 1 MPa and, if it was absorbed by a hydride of typical mass 3 g, would produce a Ax = 0.001.) Following isothermal hydriding, all products were subjected to in situ temperature scanning through the solid state transition at approximately 510 K. A number of up and down scans were carried out, for each of the hydrides prepared, to check the reproducibility of the thermal events. Samples were subsequently dehydrided and the hydride then re-prepared from the same Mg,Ni parent at a different tempera- ture. Temperature scanning was continued, to observe any systematic changes in transition parameters associated with preparation temperature. This process was repeated several times to observe any longer term trends. Although the majority of the scans were carried out with pn, = 0.6 - 0.8 MPa above the hydride, in selected cases pn, was increased up to 6.6 MPa to ascertain any pressure dependence for the transition. The transition was also investigated, following a hydride heat treatment lasting several days, at 6’70 K and zyxwvutsrqponmlkjihgfedcbaZYXWVUTSRQPONMLKJIHGFEDCBAPH, * 3.3 MPa. 3. Results
The Mg,Ni samples all activated readily at 573 K with overpressures of greater than 1 MPa. Within six hydriding-dehydriding cycles each was yielding a reproducible final composition. The p-c isotherms at 573 K exhibited plateaux with mid-composition absorption pa& and desorption p& hydrogen pressures of 0.40 and 0.34 MPa respectively. Details of the
p-c features and thermochemistry, obtained by reaction calorimetry, will be reported elsewhere [30]. For hydrides prepared at 573 K, the typical period required to complete the hydrogen uptake was greater than 5 h, although 90% - 95% completion occurred within 30 min of a massive aliquot addition. Final compositions were x = 3.92 + 0.02, in Mg,NiH, , and no composition variation was measurable for 0.6 <pa, < 4 MPa. Hydrides prepared at the lower ~mperatures exhibited considerably slower absorption kinetics and did not achieve the limiting composition even after several days at overpressures of 4 MPa. At 390 K and 420 K the intermediate composition attained was x ‘2: 3.7 and a slow absorption (2 - 4 X 10e6 (mol H,) h-‘) persisted even after 70 h. At 470 K the intermediate composition it = 3.85 was attained, again with a slow (approximately 1 X lop6 (mol Hz) h-‘) absorption persisting. Because of the significant overpressure required to drive the reaction at 390 and 420 K, meaningful plateau pressures were not obtained. However, at 470 K, p&s S 22.1 kPa and p&%% Z 15.0 kPa. All of the Mg,Ni samples which were hydrided at temperatures in the LT region absorbed additional hydrogen during the first temperature scan into the HT region, this process initiating either before (390 and 420 K preparations) or during (470 K preparation) the phase transition, with completion by 540 K. However, in all cases the final composition achieved was x = 3.90 2 0.02.
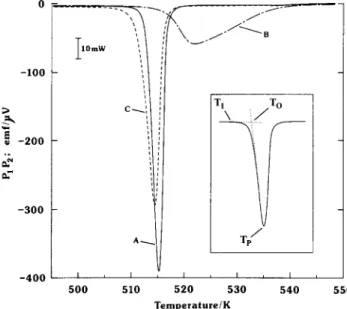
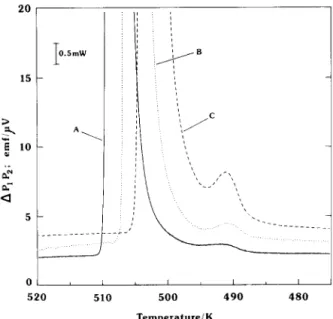
The zyxwvutsrqponmlkjihgfedcbaZYXWVUTSRQPONMLKJIHGFEDCBAP,P, vs. temperature curves obtained during a typical sequence of scans of Mg,NiH,a., undergoing its solid state transition are shown in Figs. 2
20
and 3, and detail from Fig. 3, at close to baseline levels, is shown in Fig. 4. The figures present data obtained with hydrides of the same parent Mg,Ni
sample, which were subjected to identical scan rates of 5.09 K h-’ (Fig. 2) zyxwvutsrqponmlkjihgfedcbaZYXWVUTSRQPONMLKJIHGFEDCBA 0 -100 > 3 B -200 2 T -300 -400 4 \
./To
T
TP’
-. 510 520 530 540 550 Temperature/KFig. 2. MgaNiHa.e, calorimeter response (thermopile output, PIPz us. temperature) in up-scan at +5.09 K h-l. Curves: A, hydride prepared at 573 K; B, hydride prepared at 470 K (initial up-scan); C, as for B (subsequent upscans). Inset, definitions of initiate, onset and peak temperatures T1, To and Tp respectively.
200 150 > 2 x I 100 2 p: 50 0 zyxwvutsrqponmlkjihgfedcbaZYXWVUTSRQPONMLKJIHGFEDCBA
I
5mW t I I I 520 510 500 490 480 zyxwvutsrqponmlkjihgfedcbaZYXWVUTSRQPONMLKJIHGFEDCBA A Temperature/KFig. 3. Mg*NiHs.,, calorimeter response in down-scan at.-2.98 K h-l. Curves : A, hydride prepared at 573 K; B, hydride prepared at 470 K and subsequently heat-treated at 670 K; C, hydride prepared at 470 K.
21 zyxwvutsrqponmlkjihgfedcbaZYXWVUTSRQPONMLKJIHGFEDCBA 20 zyxwvutsrqponmlkjihgfedcbaZYXWVUTSRQPONMLKJIHGFEDCBA 15 > .‘i 4 10 6” 2 5 0 I 1 I I I 520 510 500 490 480 Temperature/K zyxwvutsrqponmlkjihgfedcbaZYXWVUTSRQPONMLKJIHGFEDCBA
Fig. 4. Detail from Fig. 3; M gzNiHaeP, calorimeter response in down-scan at -2.98 K h-‘. Curves as for Fig. 3 with PIP2 displacement to avoid overlap.
TABLE 1
M g2NrHa.9 transition temperatures (TI, To, Tp) (see Fig. 2) and enthalpies AH,, zyxwvutsrqponmlkjihgfedcbaZYXWVUTSRQPONMLKJIHGFEDCBA
Curve TP W To W) TI (K) AH,, (kJ (mol Hz)-‘)
Fig. 2, A 515.2 512.6 498 4.16(4) Fig. 2, B 522.0 516.2 497 3.9(l) Fig. 2. C 514.6 511.9 495 3.98(4) Fig. 3, A 507.8 509.7 511 4.15(4) Fig. 3, B 505.0 506.8 508 4.10(4) Fig. 3, C 502.7 504.6 506 3.99(5)
Temperatures are presented for the example curves (Figs. 2 - 4); AH,, values are derived from all data; estimated standard deviations are given in parentheses.
and -2.98 K h-’ (Fig. 3). The preparation conditions for the individual hydrides are included with the figures. In Table 1 temperatures taken from the representative curves (Figs. 2 and 3) are presented; the corresponding temperatures for all hydride samples were within 1.5 K of those reported. The three parameters (T,, To, Tp) associated with each event are the initiate, onset and peak temperatures respectively. They have been selected as shown in Fig. 2, with TI being defined at the point of displacement of PIP,, from baseline, of twice noise levels, or equivalent to a detected thermal power of approximately 20 ,uW (cf. the peak power levels produced, under the reported experimental conditions, of +lO to ?200 mW). The selection of T, is more subjective than either To or Tp, but nevertheless provides
22 zyxwvutsrqponmlkjihgfedcbaZYXWVUTSRQPONMLKJIHGFEDCBA a parameter to describe, within ?2 K, the first si~ic~t thermal change exhibited by the hydride. As in other forms of thermal analysis, To is taken as the defining ~mperature of the event, i.e. the transition tem- perature in this case, Also shown in Table 1 are the enthalpies for the transition A&, these values being derived from data collected for 68 scans with 11 samples of hydrides prepared from Mg,Ni from both preparation sources. The majority of the data was obtained for hydrides with 0.6 < Pn, < 0.8 MPa. However, for p n, up to 6.6 MPa no si~~fi~~t deviation in
position parameters was observed.
4. Discussion
The final ~~m~~sition of aIf the hydrides which were prepared as HT ~odi~~atio~, and those prepared in the LT region following the first up- scan through the t~~sition, was 3.90 < x < 3.92 with no si~ifi~ant compo- sition differences between HT and LT hydrides within the total estimated error of *+%I, At 573 K, Mg2NiHW3.a exhibits imme~urably small hydrogen solubihty for hydrogen pressures O-6 < $?u, < 4 MPa, thus be- having as a line compound under these conditions with a stoiehiomet~ approaching, but not attaining, an integral value of four. Because of the Mg2Ni preparation technques used, it is unlikely that the measured hydro- gen content is low as a consequence of impurities in the starting materials (the presence of one or more impurity phases of ma~esi~m, nickel, MgNiz and/or MgO have been reported in the Mg2Ni samples used in most other studies). The presence of an unreacted portion of the Mg,Ni samples is also unlikely once the HT region is entered, since there is no evidence, either c~or~etri~~~y or volumetrically, for a continuing slow hydrogen absorp tion and all Mg2Ni samples, i~espective of the prep~at~on history, behave consistently in terms of composition, fn addition, in a separate study em- ploying powder X-ray diffra~tomet~ ~~hniques [34], fully activated and hydrided Mg,Ni showed no reflections which could be indexed as either Mg,Ni [26, 351 or its hydrogen saturated Q[ phase Mg~Ni~~. s [ 10, 163. However, fully activated and dehyd~ide~ Mg,Ni exhibited X-ray spectra showing extensive residual structural distortion, this being reproducible and systemati~~ly anisotropic in character, Thus the metal atom geometry in virgin Mg,Ni must distort considerably during the interstitial loading of the lattice, even to yield a composition of x = 3.9. For LT hydrides prior to the first up-scan through the ~sition~ hydrogen absorption was never complete despite several days exposure to large hydrogen overpressures. Al~ough reproducible behaviour was observed, and the lower temperature p~ep~a~ons consistently yielded lower x values, a slow hydrogen absorption always persisted, and these intermediate compositions are presumably hmited by kinetics. However, in every instance, on initiating a temperature up-scan, the hydrogen absorption rate increased by a factor of 10 - IO2 and the find composition, r = 3.90 f 0.02, was achieved prior to the completion of the solid state t~sition into an HT modification. The calorimetric data
23 zyxwvutsrqponmlkjihgfedcbaZYXWVUTSRQPONMLKJIHGFEDCBA
obtained before the initiation of the tr~sition, and during the exothermic absorption of hydrogen, yielded an enthalpy for the absorption process of -68 f 3 kJ (mol II&l, i.e. a value consistent with the measured f30, 321 enthalpy of formation of the / 3 phase from the saturated (X phase of 65.2 kJ (mol Hz)-’ at 573 K.
In the course of previous structural investigations of MgtNiH3.9, ther- mal analysis has been applied [2, 5,8,12,14,19,20] to aid identification of the gross energetic processes associated with the phase transition. However, a calorimeter of ‘I&m-Calvet design [28, 291, in which heat loss other than via the thermopiles is at an extremely low level, used in conjunction with the ancillary apparatus described earlier (Fig. 1), allows quantitative data to be derived. The use of larger samples and slow scanning techniques also ensures the acquisition of high resolution data. The features obtained calorimetri- cally during temperature scanning through the transition (Figs. 2 - 4) exhibit characteristics which are dependent on the preparation, temperature of the hydride. The curves shown as examples were each obtained with hydrides prepared from the same Mg,Ni parent sample, thus allowing direct compari- son without introducing any significant uncertainties which could be attrib- utable to particle size variations or thermal conductivity differences. For a hydride prepared in the HT region (i.e. T > 530 K), thermal cycling through the transition yields curves with the character shown by curve A, Fig. 3 in down-scan and by curve A, Fig. 2 in up-scan. The features remain unchanged through many cycles and the process appears reversible, with a temperature hysteresis ~approximately 5 K) occurring between up-scan and down-scan. A hydride, when prepared in the LT region (i.e. T< 470 K), exhibits on the first up-scan through the transition, a broad low intensity peak (curve B, Fig. 2) the features of which are not reversible. Subsequent thermal cycling produces the curves shown by curve C, Fig. 3 in down-scan and by curve C, Fig. 2 in up-scan, which remain unchanged through many cycles and, as with the HT preparations, appear reversible with a similar temperature hysteresis. Thus over the temperature range employed and with the single exception of the initial LT up-scan, the tr~sition features (Figs. 2 and 3; Table l), distinguish two groups depending on whether the preparations were carried out within the HT or the LT regions. The transition parameters for HT preparations in comparison with LT preparations exhibit higher transition temperatures (AT0 is approximately 0.5 K and 5 K for up-scan and down-scan respectively), with higher AH,,, by approximately 4%, and with a curve profile which has a greater amplitude and smaller tem- perature width, the latter being more clearly apparent at less than half peak height [Fig. 2). There was no evidence, in either the volumetric or calorimet- ric data, for hydride stoichiometry changes through the transition sequences which occurred reversibly. During scanning, a measurable hydrogen absorp- tion occurred only for LT preparations in the initial up-scan and prior to entry into the HT region.
The AH,, and To values which have been derived for the Mg,NiH,.g preparations show reproducible and significant differences which imply the
24 zyxwvutsrqponmlkjihgfedcbaZYXWVUTSRQPONMLKJIHGFEDCBA
existence of three LT and two HT structural modifications, with relation- ships as outlined in the following scheme.
L’W
LT(I1)LT(II1) is the modification obtained by hydride preparation at temperatures zyxwvutsrqponmlkjihgfedcbaZYXWVUTSRQPONMLKJIHGFEDCBA
T < To, and HT(I1) is the modification obtained on hydride preparation at T > T, (the letters A, B and C refer to the associated thermal features in Figs. 2 and 3). Some comments can be made concerning the structural relationships. Firstly, for the conversion of LT(II1) + I-IT(I), with a curve (B, Fig. 2) which has a low amplitude and broad temperature width (approx- imately 40 K), it is likely that, as prepared, LT(II1) is inhomogeneous in terms of structural disorder and/ or with localized composition variations. Secondly, ‘the intermediate transition parameters of HT(1) following heat treatment at 670 K and Pn, = 3.3 MPa, (curve B, Fig. 3), implies the exis- tence of a continuous phase transition HT(1) + HT(II), A possible con- t~buting factor at these elevated temperatures is a metal lattice anneal, the occurrence of which is supported by the observation 1301 that de- hydrided material from the heat treatment exhibits, on rehydriding, the slow absorption kinetics typical of unactivated (i.e. structurally undistorted) Mg,Ni. If a minor hydrogen stoichiometry change is associated with HT(1) + HT(II), it would be masked by the large gas phase hydrogen losses from the system, which occur at these higher temperatures with significantly increased permeation rates.
One other feature of the transition, shown by the c~o~metric data, is a small hump at approximately 491 K (Fig. 4). This feature is resolvable on a down-scan, and is presumably embedded in the extended approach (495 < T < 510 K; Fig. 2) into the main event in up-scan, thereby con- tributing to the modest increase in temperature width observed with LT preparations. The hump area (curve C, Fig. 4) corresponds, in energy, to approximately 1% that measured for LT(1) + HT(1) and less than 0.1% (curve A, Fig. 4) that of LT(I1) * HT(I1). However, the data does not differentiate as to whether this event is associated with the total sample mass (i.e. with low intrinsic enthalpy and the transition being sequential), or with a part of the sample (i.e. with high intrinsic enthalpy and an implied inhomogeneity). However, preparation of the hydride as LT(II1) favours the appearance of the 491 K feature, suggesting a correlation with the structural inhomogeneity which is suspected for that modification.
5. Conclusions
A series of hydrides, prepared from high purity Mg,Ni at temperatures below and above that of the phase transition at 510 K, have a stoichiometry
25
of
M&NW.
91 with no measurable compositional variation between LTand HT modifications within an estimated total error of ?+S,. A total of three LT and two HT structural modifications have been identified for 390 < T < 600 K and 0.6 <Q < 4 MPa. One modification, LT(III), has thermal characteristics attributable to gross structural and/or com- positional inhomogeneity. The remaining four modifications exist in two reversible pairs, LT(1) + HT(1) and LT(I1) + HT(II), the enthalpies of transition for which are AH,, = 3.99 + 0.05 kJ (mol H,)-’ and 4.16 2 0.04 kJ (mol H,))’ respectively. Despite the likelihood of type (I) and (II) pairs being structurally similar, their mutually exclusive existence implies a significant energetic or kinetic barrier to their structural interconversion.
Acknowledgments
We thank G. J. Despault for technical assistance and the Analytical Section of the Chemistry Division, National Research Council of Canada, for their services.
References
1 J. J. Reilly and R. H. Wiswall, zyxwvutsrqponmlkjihgfedcbaZYXWVUTSRQPONMLKJIHGFEDCBAZnorg. Chem., 7 (1968) 2254. 2 Z. Gavra, M. H. Mintz, G. Kimmel and Z. Hadari, Znorg. Chem., 18 (1979) 3595.
3 J. Schefer, P. Fischer, W. Halg, F. Stucki, L. Schlapbach, J. J. Didisheim, K. Yvon and A. F. Andresen, J. Less- Common M et., 74 (1980) 65.
4 A. F. Andresen, E. Andersen and K. Pettersen, Acta Cry stdogr. A, 37 (1981) C-152. 5 J.-P. Darnaudery, M. Pezat, B. Darriet and P. Hagenmuller, M uter. Res. Bull., 16
(1981) 1237.
6 J. Genossar and P. S. Rudman, J. Phy s. Chem. Solids, 42 (1981) 611. 7 D. Nor&s and.P.-E. Werner, M ater. Res. Bull., 16 (1981) 199.
8 T. Hirata, T. Matsumoto, M. Amano and Y. Sasaki, J. Phy s. F, 11 (1981) 521. 9 K. Yvon, J. Schefer and F. Stucki, Znorg. Chem., 20 (1981) 2776.
10 D. Nor&s and P.-E. Werner, Acta Chem. Stand. A, 36 (1982) 847.
11 S. Ono, Y. Ishido, K. Imanari, T. Tabata, Y. K. Cho, R. Yamamoto and M. Doyama,
J. Less- Common M et., 88 (1982) 57.
12 S. Ono, H. Hayakawa, A. Suzuki, K. Nomura, N. Nishimiya and T. Tabata, J. Less-
Common M et., 88 (1982) 63.
13 D. Nor&s and L. G. Olsson, J. Chem. Phy s., 78 (1983) 2419. 14 D. Nor&s and P.-E. Werner, J. Less- Common M et,, 97 (19843 215.
15 H. Hayakawa, Y. Ishido, K. Nomura, H. Uruno and S. Ono, J. Less- Common M et., 103 (1984) 277.
16 J. L. Soubeyroux, D. Fruchart, A. Mikou, M. Pezat and B. Darriet, M ater. Res. Bull., 19 (1984) 895.
17 J. L. Soubeyroux, D. Fruchart, A. Mikou, M. Pezat, B. Darriet and P. Hagenmuller, Mater. Res. Bull., 19 (1984) 969.
18 J. L. Soubeyroux, D. Fruchart, A. Mikou, M. Pezat and B. Darriet, M uter. Res. BUZZ., 19 (1984) 1119.
19 D. No&us, K. Jansson and M. Nygren, 2. Phy s. Chem. N.F., 146 (1985) 191. 20 Z. Gavra, G. Kimmel, Y. Gefen and M. H. Mintz, J. AppZ. Phy s., 57 (1985) 4548. 21 P. Zolliker and K. Yvon, M ater. Res. Bull., 21 (1986) 415.
26
22 zyxwvutsrqponmlkjihgfedcbaZYXWVUTSRQPONMLKJIHGFEDCBAP. Zolliker, K. Yvon and Ch. Baerlocher, J. Less- Common M et., 115 (1986) 65. 23 D. Nor&s and L. Kihlborg, J. Less- Common M et., 123 (1986) 233.
24 J. M. Cowley and A. Y. Au, Acta Cry stallogr., Sect. A., 34 (1978) 733. 25 Z. Gavra, personal communication (1986).
26 M. L. Post, J. J. Murray, G. J. Despault and J. B. Taylor, M ater. Res. Bull., 20 (1985 1
337.
27 J. J. Murray, M. L. Post and J. B. Taylor, J. Less- Common M et., 80 (1981) 201. 28 E. Calvet and H. Prat, Recent Progress in M icrocalorimetry , Pergamon, Oxford, 1963 29 P. C. Gravelle, Advan. Catal., 22 (1972) 191.
30 M. L. Post and J. J. Murray, to be published.
31 M. L. Post, J. J. Murray and J. B. Taylor, Abstr. 35th Ann. Calorimetry Conf., Enfaula, AL, 1980, p. 38.
32 M. L. Post, J. J. Murray and J. B. Taylor, Znt. J. Hy drogen Energy , 9 (1984) 137. 33 A. D. Le Claire, Diffusion and Defect Data, 34 (1983) 1.
34 M. L. Post and J. J. Murray, to be published.