HAL Id: hal-01077434
https://hal.archives-ouvertes.fr/hal-01077434
Submitted on 24 Oct 2014HAL is a multi-disciplinary open access archive for the deposit and dissemination of sci-entific research documents, whether they are pub-lished or not. The documents may come from teaching and research institutions in France or abroad, or from public or private research centers.
L’archive ouverte pluridisciplinaire HAL, est destinée au dépôt et à la diffusion de documents scientifiques de niveau recherche, publiés ou non, émanant des établissements d’enseignement et de recherche français ou étrangers, des laboratoires publics ou privés.
Interactivity Improves Usability of Geographic Maps for
Visually Impaired People
Anke Brock, Philippe Truillet, Bernard Oriola, Delphine Picard, Christophe
Jouffrais
To cite this version:
Anke Brock, Philippe Truillet, Bernard Oriola, Delphine Picard, Christophe Jouffrais. Interactivity Improves Usability of Geographic Maps for Visually Impaired People. Human-Computer Interaction, Taylor & Francis, 2015, 30 (2), pp.156-194. �10.1080/07370024.2014.924412�. �hal-01077434�
This is an Author's Accepted Manuscript of an article published in Human–Computer Interaction on 18 Jun 2014, copyright Taylor & Francis, available online at:
Interactivity Improves Usability of Geographic Maps
for Visually Impaired People
Anke M. Brock
1, Philippe Truillet
1, Bernard Oriola
1,
Delphine Picard
2*, Christophe Jouffrais
1*1
IRIT- UMR 5505, Toulouse, France
2Aix Marseille University, France
*both authors contributed equally to the study
Authors’ Mini-bios:
Anke M. Brock (anke.brock@irit.fr, http://www.irit.fr/~Anke.Brock) is a computer
scientist with an interest in non-visual interaction and accessibility for visually impaired people; she is a postdoctoral researcher in the IRIT Research Institute for Computer Science, a joint laboratory between the University of Toulouse and the CNRS (National Center for Scientific Research). Philippe Truillet (Philippe.Truillet@irit.fr,
http://www.irit.fr/~Philippe.Truillet) is a computer scientist with an interest in HCI; he is an associate professor in the IRIT Research Institute. Bernard Oriola
(bernard.oriola@irit.fr) is a computer scientist with an interest in non-visual interaction; he is a CNRS research engineer in the IRIT Research Institute. Delphine Picard
(delphine.picard@univ-amu.fr, http://www.dpicard.fr) is a developmental psychologist with an interest in haptic perception in sighted and visually impaired individuals; she is a full professor at the PsyClé Research Center of Aix Marseille University, and member of the French University Institute. Christophe Jouffrais (christophe.jouffrais@irit.fr, http://www.irit.fr/~Christophe.Jouffrais) is a neuroscientist with an interest in space perception and spatial cognition, as well as assistive technologies for visually impaired people; he is a CNRS researcher with the IRIT Research Institute.
Interactivity Improves Usability of Geographic Maps
for Visually Impaired People
Running Head: Usability of interactive maps for visually impaired people
ABSTRACT
Tactile relief maps are used by visually impaired people to acquire mental representation of space, but they retain important limitations (limited amount of information, braille text, etc.). Interactive maps may overcome these limitations. However, usability of these two types of maps had never been compared. It is then unknown whether interactive maps are equivalent or even better solutions than traditional raised-line maps. This study presents a comparison of usability of a classical raised-line map vs. an interactive map composed by a multi-touch screen, a raised-line overlay and audio output. Both maps were tested by 24 blind participants. We measured usability as efficiency, effectiveness and satisfaction. Our results show that replacing braille with simple audio-tactile
interaction significantly improved efficiency and user satisfaction. Effectiveness was not related to the map type but depended on users’ characteristics as well as the category of assessed spatial knowledge. Long-term evaluation of acquired spatial information revealed that maps, whether interactive or not, are useful to build robust survey-type mental representations in blind users. Altogether, these results are encouraging as they show that interactive maps are a good solution for improving map exploration and cognitive mapping in visually impaired people.
CONTENTS
1. INTRODUCTION
1.1. Spatial Cognition, Maps and Visual Impairment Maps as a Tool for Spatial Cognition
Maps for Visually Impaired People 1.2 Related Work
Interactive Maps for Visually Impaired People
Evaluating the Usability of Interactive Maps for Visually Impaired People 2. MATERIAL AND METHODS
2.1. Material
Design Choice
The Interactive Map Prototype Raised-line Map Design Experimental Setup 2.2 Participants
2.3 Procedure
Familiarization Phase Protocol
Observed Variables and Statistics 3. RESULTS
3.1 Short-term Study: Comparison of the Usability of Different Map Types Learning Time (Efficiency)
Spatial Learning (Effectiveness) User Satisfaction
Users’ Confidence
3.3 Long-term Recall: Comparison of the Effectiveness of the Interactive and Paper Maps
Long-term Recall of Spatial Information Users’ Confidence at Long-term
4. GENERAL DISCUSSION
4.1 Comparing Usability of a Paper Map and an Interactive Map Usability of Interactive Maps for Visually Impaired People Impact of the Design Choice on the Results
4.2 Spatial Cognition in the Blind
Spatial Memory Following Tactile Map Exploration
Users’ Confidence is Misleading after a Delay of Two Weeks 4.3 Potential Interest of Interactive Maps
1. INTRODUCTION
Mobility and orientation are among the biggest challenges for visually impaired people. More than half of the blind population in France reported that they face challenges regarding mobility and orientation (C2RP, 2005). Unfortunately, even if geographic information is available, it is often not accessible to the blind traveler. Internet and smartphones provide access to information and assisted navigation. Yet, visually impaired people recently reported that this information was often not accessible to them (Banovic, Franz, Truong, Mankoff, & Dey, 2013). As a consequence, visually impaired people are not traveling at all or are, in the best cases, tied to previously learned routes, which has important consequences on professional and social life.
Travel preparation at home, in a safe environment, can provide visually impaired people with a mental representation (also called cognitive map) of the environment that they intend to visit and thus help to overcome fear related to traveling. Among other solutions, raised-line maps represent the environment and may enable visually impaired users to acquire spatial information (Jacobson, 1996). However, they present significant limitations. For instance, they provide a fixed, limited amount of information, and require the use of a braille legend. New technology has opened up possibilities for designing accessible interactive maps. These interactive maps aim to overcome some of the limitations of classical embossed paper maps. Landau & Wells (2003) argue that the combination of audio and tactile output enhances and facilitates learning as compared to purely tactile diagrams, which could be a motivation for schools and associations to buy and employ interactive technology in the education of visually impaired students. However, the usability of accessible interactive maps has never been compared to the usability of classical raised-line maps. Therefore, designers and researchers miss the confirmation that interactive maps do not raise accessibility or cognitive issues, and that they are equivalent or even better solutions than traditional embossed maps.
In the present study, 24 blind users explored an interactive map and a classical raised-line map. We then compared the three main components of usability for each map: effectiveness measured as spatial learning, efficiency measured as learning time, and satisfaction. In a follow-up experiment, we checked that spatial memory was not dependent on the type of map. We also observed the effect of time on memorization of spatial information, as well as users’ confidence in the acquired spatial knowledge.
1.1. Spatial Cognition, Maps and Visual Impairment
Studying spatial cognition through map exploration requires the prior introduction of some notions. Siegel & White (1975) differentiate three types of spatial knowledge: landmark, route and survey. They define landmarks as specific geographic locations, strategic places to which a person travels. Examples of landmarks contain bus stops, public places, touristic sites or shopping centers. Routes are then a second type of spatial knowledge, corresponding to an ordered sequence of landmarks. They usually represent familiar journeys. Typically route knowledge is enabling travel from the bus stop to the workplace. Finally, survey knowledge (also called configurational knowledge)
corresponds to a map-like representation. It includes topographic properties of an
environment, such as location and eventually distance of landmarks relative to each other or to a fixed coordinate system (Thorndyke & Hayes-Roth, 1982). As an example, a person would learn that the train station is located 500 m north of the town hall and that the museum is situated east of the town hall. These different types of knowledge are stored in mental representations through the integration of an ensemble of sensory and motor cues. It is possible to acquire these mental representations through direct
experience of the environment, i.e. navigation, as well as through verbal descriptions or exploration of physical representations—such as maps, photographs or models (Gaunet & Briffault, 2005; Jacobson, 1996; Picard & Pry, 2009). Yet, different sources lead to the acquisition of different types of spatial knowledge. Thorndyke & Hayes-Roth (1982) observed that route knowledge was normally derived from direct navigation. Although it is possible to acquire survey knowledge from direct experience, it can be obtained more quickly and with less effort from map reading (Thorndyke & Hayes-Roth, 1982). In addition, the quality of the representations is not equivalent. Survey knowledge is considered more flexible than route knowledge: when based on route knowledge, travelers are restricted to the routes they have previously memorized. On the contrary, survey knowledge provides a global representation of an area, and allows flexible alternation of travel (Jacobson, 1996). As a consequence, maps are an efficient mean for acquiring flexible and overall knowledge of an area. It has been shown that visually impaired people are able to acquire survey knowledge (see e.g. Picard & Pry, 2009).
Maps as a Tool for Spatial Cognition
Maps are projective two-dimensional representations of a real space in smaller scale (Hatwell & Martinez-Sarrochi, 2003). They may have different geographical extents (anything from a room to a representation of the Earth) and different contents (e.g. road network or demography). In this paper we focus on orientation and mobility maps which provide the possibility of exploring unknown areas, getting an overview about the surrounding of a landmark, localizing specific landmarks or preparing travel (Heuten, Wichmann, & Boll, 2006). Maps also allow the absolute and relative localization of landmarks—as streets or buildings—and the estimation of distances and directions. Maps have traditionally been hard copy maps. With the rise of new technology, interactive and multimodal maps now exist on computers and smart phones. These maps provide new functions such as scrolling, zooming, and search functionalities. In addition map content can be dynamically updated and edited (e.g. in collaborative projects).
Maps for Visually Impaired People
When creating tools for visually impaired people, visual output has to be replaced by other modalities. Traditional maps for visually impaired people are tactile maps where different contents are presented in relief—i.e. through raised lines–with the help of different lines, symbols and textures (Edman, 1992). Braille is used to add textual information (Tatham, 1991). In several studies with visually impaired people, tactile maps have proved to be effective tools for acquiring survey knowledge (see for instance Ungar, 2000).
Although tactile maps are successfully employed, several limitations and problems are associated with them. First, tactile map reading is not innate and must be learned, as it implies several challenges for the inexperienced map reader (Hatwell &
Martinez-Sarrochi, 2003). Touch is segmented and sequential, which places great demands on memory (Hatwell, 2003). Information has to be integrated from hand movements and cutaneous sensations from fingertips. Besides, the resolution of the finger is more limited than the resolution of the eye. Consequently, the design of a tactile map is challenging as it must contain only useful information (Hatwell & Martinez-Sarrochi, 2003). An
excessively detailed map becomes cluttered and unreadable, and results in a perceptual overload for the reader (Jacobson, 1996). This is especially crucial when braille text is used. Braille needs a lot of space and is inflexible in size and orientation (Tatham, 1991). In order to avoid overloading the map, a legend is used to display braille text. The
process of reading the legend, however, introduces disruption in map exploration as the user has to alter between reading the map and reading the legend (Hinton, 1993). Finally, another challenge is related to the fact that only a small part of the visually impaired population reads braille. A recent report states this number as low as 10% in the United States (National Federation of the Blind, 2009). In France 15% of blind people read braille and only 10% of them read and write it (C2RP, 2005).
As a response to these challenges, interactive maps have the potential to provide a substantially broader spectrum of the visually impaired population with spatial
knowledge, irrespective of age, visual impairment, skill level, or other considerations (Oviatt, 1997). To this regard, they appear to be an interesting means for providing visually impaired people with access to geospatial information.
1.2 Related Work
Interactive Maps for Visually Impaired People
The first interactive map was introduced by Parkes (1988). It was based on the idea of placing a tactile map overlay on a touch screen and augmenting the tactile map with audio output. Since this initial project, several new concepts of interactive maps have emerged. The design of these maps differed in many aspects including content, devices and interaction techniques. Brock et al. (2013) presented an exhaustive review of these research projects. The vast majority represented geographic outdoor maps, and more precisely city maps (see for instance Miele, Landau, & Gilden, 2006). This makes sense as they directly respond to the need of visually impaired people to improve orientation knowledge. All these prototypes relied on touch as input modality—through the use of various devices—and only few of them used speech recognition for the complementary access to additional information, such as distances, directions or lists of on-screen or nearby targets (Kane, Morris, et al., 2011; Simonnet, Jacobson, Vieilledent, & Tisseau, 2009). For output, all systems relied on some form of audio, either verbal through a TTS (text-to-speech synthesis) or through recorded speech (see for instance Kane, Morris, et al., 2011; Miele et al., 2006), or non-verbal through ambient sound, earcons or music (see for instance Jacobson, 1998; Zhao, Plaisant, Shneiderman, & Lazar, 2008).
Brock et al. (2013) classified the prototypes according to the technology used to present map content. Haptic devices (i.e. mice, gamepads and joysticks with force feedback) were used in many projects. The BATS project (Parente & Bishop, 2003) aimed to integrate low cost consumer devices. Their prototype allowed a variety of devices capable of providing force feedback, including mice, trackballs, joysticks, and gamepads. Unfortunately haptic devices do not provide a fixed, reliable, reference frame for exploration, and thus can make it difficult for visually impaired people to gather spatial information (Rice, Jacobson, Golledge, & Jones, 2005).
Another category included prototypes that rely on tactile actuator devices. These devices can produce tactile sensations such as relief, pressure, puncture, or friction (El Saddik, Orozco, Eid, & Cha, 2011), and thus reproduce local features of objects such as shape and texture. Most of these devices used a matrix of needles or pins that were mechanically moved up and down for displaying a map (Shimada et al., 2010; Zeng & Weber, 2010). However the rendering of information with raised-pin displays remains challenging as the resolution is quite low, in any case lower than the visual resolution of a normal screen. These raised-pin displays seem promising, especially if the display is large enough to be explored with both hands. However, they are very expensive (for instance, a 60 * 120 pin matrix cost 50,000€ in 2012).
Touch-sensitive devices, including smartphones and touch tables, were most often used although they do not provide any tactile feedback to the user (Jacobson, 1998; Kane, Morris, et al., 2011). In some projects, the audio output was combined with tactile
feedback such as vibrations (Poppinga, Magnusson, Pielot, & Rassmus-Gröhn, 2011; Yatani, Banovic, & Truong, 2012). Yet, when vibrations are not spatially located, they proved to be less efficient than classical raised-line drawings for communicating graphical information (Giudice, Palani, Brenner, & Kramer, 2012). In line with the original idea proposed by Parkes (1988), it appears that the most usable interactive map prototypes rely on a raised-line overlay on a touch surface. For instance, Weir, Sizemore, Henderson, Chakraborty, & Lazar (2012) observed that users preferred exploring a sonified interactive map application when a raised-line overlay was placed on the
touchscreen. Likewise, it appears that touch-screens become more efficient and effective to use with a raised-line overlay (McGookin, Brewster, & Jiang, 2008). Indeed, it is quite easy to augment raised-line documents with verbal and non-verbal audio. The idea behind this concept is to provide visually impaired map readers with a familiar interface, the tactile map that they learned to read at school. Additionally this familiar interface can be augmented with interactive zones in order to provide more detailed information. This concept has been successfully employed in different research projects (see for instance Brock, Truillet, Oriola, Picard, & Jouffrais, 2012; Miele et al., 2006; Petrie et al., 1996; Wang, Li, Hedgpeth, & Haven, 2009).
Besides the research projects presented here, several commercial products slowly emerge. The iPhone and iPad provide the possibility to access map information with the default VoiceOver Screen Reader1. The output is based on auditory feedback only,
without any tactile cues. Ariadne GPS2 is a commercial map application for Ipad or
IPhone that goes further. It resembles the TouchOverMap project (Poppinga et al., 2011) in that the user receives audio and non-localized vibration feedback when moving the digit over the screen. Yet, without any tactile cues clearly representing the outlines of map elements, it is very difficult for the user to mentally integrate spatial shapes through hand movements. There are two commercial products that rely on touch surface with raised-line overlay. ABAplans3 is based on a mono-touch screen with map overlay and
provides users with audio augmentation on certain elements. The second system, IVEO4
by ViewPlus, also makes use of raised-line overlays on a monotouch screen. IVEO comes with many pre-printed maps and software for drawing new ones. Even though these different systems are currently being launched on the market, it has never been shown that the usability is good or at least preserved when compared with regular embossed paper maps with Braille legend.
Evaluating the Usability of Interactive Maps for Visually Impaired People
Usability is an important measure for evaluating interactive systems. It is defined as “the extent to which a system [...] can be used by specified users to achieve specified goals with effectiveness, efficiency and satisfaction in a specified context of use” (ISO, 2010). Although some studies have investigated the usability of interactive diagrams (Blenkhorn & Evans, 1998) or graphics (Giudice et al., 2012) for visually impaired people, there is still a need for studies on interactive maps. Maps differ from other
drawings in that they not only serve to present information (such as a list of elements) but also spatial configuration. For instance, Blenkhorn & Evans (1998) argue that schematic diagrams are different from maps because they explicitly show relationship between the parts of the diagram that are important, whereas in a map the relative position, shape and size of elements must correspond to reality for the map to be meaningful. In addition, drawings usually refer to real objects that can be directly touched (e.g. a hammer), whereas maps refer to large-scale spaces that can only be experienced through navigation. Maps are really specific in that they must generate allocentric mental representations (survey knowledge) that will potentially be used in an egocentric perspective (route knowledge for navigation).
They are very few experimental papers presenting an interactive map prototype, which also include a user study. Often studies only report qualitative results (see for instance Parente & Bishop, 2003), and usability is not measured quantitatively regarding efficiency, effectiveness and satisfaction or only some of these factors are measured. For instance, Landau & Wells (2003) studied satisfaction and effectiveness for an interactive map prototype, but did not regard efficiency. Furthermore, some prototypes were tested with blindfolded sighted participants instead of visually impaired people (see for instance Schmitz & Ertl, 2010). This is problematic, as exploration strategies, mental
representations of space and use of interaction techniques differ depending on the visual capacities (Thinus-Blanc & Gaunet, 1997). Although it appears crucial, no prior study
2 http://www.ariadnegps.eu/ 3 http://abaplans.eig.ch/index.html
compared the usability of an interactive map with the usability of a classical raised-line map for visually impaired people. If interactive maps were either less efficient, less effective or less satisfying than raised-line maps, the use of advanced interactive devices for visually impaired people should be questioned. The design of new interaction is not justified if usability is not guaranteed. In this case, designing interactive maps should focus on usability first, and it should be ensured that appropriate methods are used for evaluation. On the contrary, if it would be observed that interactive maps were equivalent or even better solutions than regular embossed maps, researchers and designers would know that interactive maps do not raise accessibility or cognitive issues, and that making use of interactivity can improve accessibility for visually impaired people.
Consequently, the objective of the present study was to compare the usability of a paper map versus an interactive map for learning a neighborhood. In a follow-up study, we also checked the effect of time (delay of 2 weeks) on the memorization of the
elements and the global configuration of the map. We introduced a method including the three usability factors (effectiveness, efficiency and satisfaction). Our results show that replacing the braille legend by simple touch and audio interaction significantly improved exploration times (efficiency) and user satisfaction. Concerning effectiveness, measured as spatial cognition scores, we observed that improvement in spatial learning and
memorization did not depend on interactivity, but on users (e.g. expertise with tactile map reading) as well as the type of spatial knowledge (landmark, route, survey). Furthermore, we observed that maps in general, independently of interactivity, are an important means for improving configurational and robust spatial knowledge in visually impaired people. Our results also suggest that interactivity can provide the early blind and those who are not braille readers with a chance to improve space-related knowledge. These results are encouraging as they show that interactive maps are a usable solution for making
geographic maps accessible to visually impaired people.
2. MATERIAL AND METHODS
In this study we compared the usability of a raised-line paper map (PM) and an interactive map (IM). The users were legally blind and the context of use was map reading. Our general hypothesis was that an interactive map (IM) was more usable than a tactile paper map (PM) for providing blind people with spatial knowledge about a novel environment. We made the following specific predictions concerning the three usability factors:
1) Efficiency: we predicted a shorter exploration time devoted to map learning for IM than for PM. This reasoning was based on the fact that PM was accompanied by a legend. The alternation between map reading and legend reading introduces a disruption which does not exist with the interactive map (Hinton, 1993). 2) Effectiveness: we predicted that participants would acquire more accurate and
reliable spatial knowledge with IM than with PM. This is based on the assumption that multimodal output is more beneficial than using one modality alone. For instance, when comparing the use of a touch screen-based system with audio output and with or without raised-line overlay by visually impaired people, users
made fewer errors and were quicker when using the interface with the overlay (McGookin et al., 2008). We observed the different types of spatial knowledge (landmark, route and survey) after map exploration. We made the predictions that spatial scores and confidence would be improved when using IM. We also
predicted that this advantage related to IM would be preserved two weeks after map exploration.
3) Satisfaction: we predicted that IM would yield higher satisfaction scores—i.e. positive attitudes towards the use of the map—than PM. Previous studies observed a high satisfaction rate when visually impaired people used interactive devices (see for instance Kane, Morris et al., 2011). We made the assumption that users would perceive the interactive map as more accessible and ludic. Besides we hypothesized that users who encounter difficulties with braille reading would prefer audio output.
In a follow-up experiment, we observed the effect of time and map type on
memorization of spatial information, as well as users’ confidence in the acquired spatial knowledge.
The following sections present the design of the maps and interactions used in the experiment, as well as the protocol, participants and observed variables.
2.1. Material
We tested the same raised-line maps under two different conditions (“map type”): the PM condition corresponded to a regular raised-line map with braille legend; the IM condition corresponded to a touch screen with a raised-line map overlay (without any braille text) and audio feedback. We designed two different but equivalent contents in order to counterbalance the putative effects of map content (1 and then 2, or vice versa) and condition order (PM and then IM, or vice versa).
Design Choice
As mentioned in the introduction, the design space for accessible interactive maps is large and heterogeneous (Brock et al., 2013). Current interactive map prototypes vary in many aspects, including map content, devices and interaction techniques. Several advantages and disadvantages exist for the different types of interactive maps, and it is impossible to identify “the best solution” as this depends on context, task, user
preferences, etc. Our aim was to develop a prototype that allows a visually impaired person to explore an unknown geographic area at home, at school or in another static context. The exploration of this map must allow the user to acquire spatial knowledge concerning a specific neighborhood (e.g. around a point of interest). In this study we designed an interactive map prototype based on a multi-touch surface, a raised-line map overlay representing a neighborhood, and audio output. This prototype is in the continuity of the interactive maps initially proposed by Parkes (1988). The choice to remove braille is rather consistent as only a small percentage of the blind population reads braille (National Federation of the Blind, 2009). However, in contrast to other studies our
prototype relies on a more recent multi-touch surface that allows regular two-hands exploration strategies, as well as the potential design of advanced interaction gestures.
The Interactive Map Prototype
Choice of multi-touch surface. All applications were developed on a HP EliteBook
8530p connected to a touch device. We identified some criteria to choose the multi-touch surface (Brock, Truillet, Oriola, & Jouffrais, 2010). The most important one was the compatibility with a paper overlay, meaning that touch input was still recognized with the overlay placed on top of the surface. The second criterion was the number of touch inputs. As visually impaired people usually explore tactile maps with both hands and multiple fingers (Wijntjes, van Lienen, Verstijnen, & Kappers, 2008), a multi-touch surface with at least 10 touch inputs permits to track and register finger movements during map exploration. Concerning the size, Tatham (1991) proposed that maps for visually impaired people should not exceed two hand spans (450 mm). This size allows using one of the fingers as anchor point to put other map elements in relation to the current one regarding distance and direction. Obviously, it is challenging to memorize large scale maps, and it is difficult to present tactile maps in a very small format—e.g., size of a smartphone screen. During pre-tests with different map sizes we observed that the size should be at least A4 format, and that users preferred maps in A3 format. In order to preserve map reading habits and comfort of blind users, we set up our map in a
horizontal plane and with the landscape orientation.
The multi-touch surface used in the current study was the 3M Inc. M2256PW. The capacitive projected technology preserved responsiveness through the paper overlay. The dimensions of the screen (slightly larger than A3 format) were well adapted for
representing a city neighborhood. Finally, it provided real multi-touch capacity with up to 20 touch inputs.
Software architecture. Our IM prototype was based on a modular software
architecture in which different modules, i.e. applications, were connected via a software bus (Buisson et al., 2002). The first module detected touch input. We used the surface low level driver in order to get ID, coordinates and timestamp for each touch input. This information was sent to the second module, which displayed map content, and
determined the map element being touched. The third module received messages from both other modules and implemented the state machine to differentiate interaction from exploratory movements. Finally, this module sent the text output message to a text-to-speech (TTS) module using Microsoft Speech Application Programming Interface version 4. It is worth noticing the versatility of this type of modular prototype for experimenting different configurations.
Touch input. The objective of the state machine was to differentiate exploratory
finger movements (i.e., following the raised-lines) from touch interaction (i.e. touching the screen in order to obtain information). We tested different types of touch input. In a first version we implemented a single tap interaction. Although the single tap worked fine with sighted users, it did not work with blind users. Indeed visually impaired users
outputs. The blind users who tested the system were then not able to understand which finger caused sound outputs. Similarly, McGookin et al. (2008) observed accidental speech output for single tap interaction. As we wanted to preserve natural two-hand exploration, we looked for alternative touch inputs that would unlikely trigger events by chance. Kane, Wobbrock, and Ladner (2011) identified double taps as gestures that are usable by blind people. Multiple tap interaction was also used in the Talking TMAP project (Miele et al., 2006) and by Senette et al. (2013). We then used a double tap technique with a 700 ms delay between two taps. The standard speed for mouse double clicks in Windows Operating System, which is 500ms, proved to be too short. The double tap ended right after the second tap, while the digit was still touching the surface. This allowed the user to keep the tapping finger on the interactive map element that was selected. Pretests showed that this double tap technique was efficient and was more natural for visually impaired users. However, a few unintended double taps still occurred, mainly because of the palms of the hand resting on the map during exploration (as
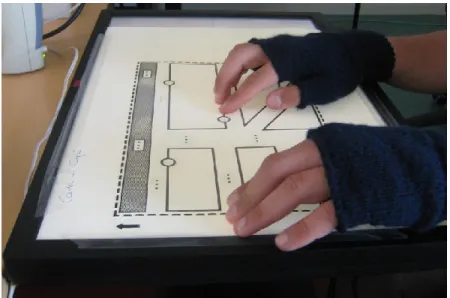
discussed by Buxton, 2007). We therefore asked users to wear mittens during map exploration, which minimized the occurrence of unintended touch inputs (figure 15).
Figure 1. Photograph of a user exploring an interactive map. The raised-line map overlay is attached on top of the touch screen. The user is wearing mittens to hinder unintended touch input from the palms.
Speech output. In the experimental prototype, speech output was announcing the
names of streets and points of interest. We used TTS because synthesized speech is more flexible than recorded speech. We opted for the RealSpeak SAPI 4.0 TTS with the French female voice “Sophie” for its good intelligibility and user satisfaction (Côté-Giroux et al., 2011). It was important that users perceived the TTS as comfortable regarding volume, pace and voice. Although blind users are used to screen readers at a high pace (Asakawa, Takagi, Ino, & Ifukube, 2003), we implemented a standard pace. We wanted to make sure that users would understand single unknown words, even out of context, and with a
non-familiar voice. Speakers were connected to the computer. The volume of the speech output was kept constant at an audible level during the whole experiment.
Raised-line Map Design
Raised-line maps use different symbols and textures, without obeying any strict design recommendations. Nevertheless, tactile symbols must respect minimal sizes and distances in order to be perceivable (Tatham, 1991). Edman (1992) presented a
comprehensive summary on the guidelines for tactile map and image design. During the design of our raised-line maps we respected the guidelines as described by Picard (2012). A dashed line (line width 1.4 mm; miter join; miter limit 4.1; butt cap; no start, mid or end markers) presented the outer limits of the map. Streets and buildings were separated by a solid line (line width 1.4 mm; miter join; miter limit 4.0; butt cap; no start, mid or end markers). A texture represented a river (texture “wavy”). Points of interests were represented by circles (width and height 12.4 mm, line width 1.4 mm). An arrow on the left upper side of the map indicated the north direction.
The maps were designed with the Open Source Inkscape software6 in SVG (Scalable
Vector Graphics) format7. SVG is an XML based format convenient to provide both a
topographic view of a geographical place and a textual description of the included elements. Many projects use the SVG format for the design of interactive maps (see for instance Miele, Landau, & Gilden, 2006).
We designed a first map representing a fictional city center with six streets, six buildings, six points of interest (for instance museum, restaurant, and public transport) as well as one geographic element (a river). A second map was then created with the same map elements that were rotated and translated, so that both map contents were equivalent. A central point of interest in the middle of the map (hotel) was common for both maps (see figure 2). We have made the choice to design maps with low complexity and a limited number of elements to make sure that users could read and memorize the map content within a reasonable amount of time. Both map contents were then produced with or without braille. Pretests with a visually impaired user ensured that the maps were readable, and that they were not too easy or too difficult to memorize.
We also assured the lexical equivalence between maps by means of the “Lexique” database (New, Pallier, Ferrand, & Matos, 2001). We considered two criteria for inclusion of equivalent text: the frequency of oral usage (number of occurrences per million in subtitles of current movies) as well as the number of syllables. These criteria are important because more frequent words as well as shorter words are usually easier to memorize. Another constraint was that words had to begin with different letters so that each braille abbreviation was unique. All street names were composed of two syllables, and were low frequency words, i.e. words with less than 20 occurrences per million. In addition we used categories for the names: on each map two streets were named after birds, two after precious stones and two after flowers. On each map there were 6 points of
6 http://inkscape.org/ [last accessed May 14th 2013]
interest (POI) with counterbalanced frequencies and number of syllables. In addition to these six POIs, we added a reference point on both maps which was the hotel. The word “hotel” had the highest usage frequency among all POIs that we selected.
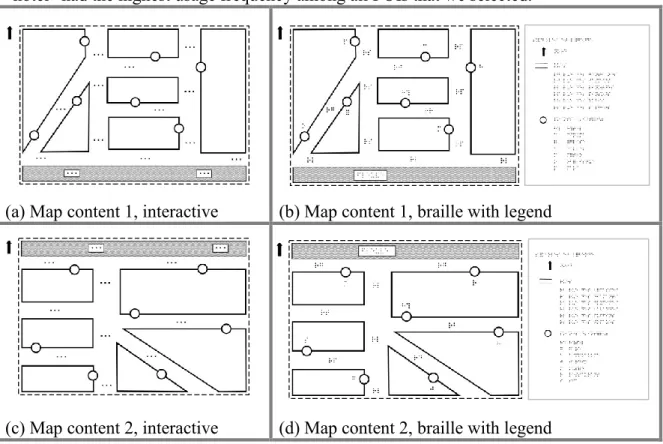
(a) Map content 1, interactive (b) Map content 1, braille with legend
(c) Map content 2, interactive (d) Map content 2, braille with legend
Figure 2. Four different variants of the map existed in total. Two different map contents are depicted in (a, b) and (c, d). They are based on the same geographic elements, which were rotated and translated. Both map contents existed with braille (b, d) and in interactive format (a, c). Circles are points of interest (either the points were interactive or accompanied by a braille abbreviation). The marks composed by three dots are interactive elements to access street names.
Specificity for the raised-line map with braille legend (PM). In regular raised-line maps,
braille legends provide information on the different map elements. Legends are usually based on numbers or abbreviations positioned close to the elements that they describe. These markers are then found in the legend section with additional textual information. We used abbreviations rather than numbers as they facilitate the cognitive association with the full name of the element. All street name legends began with the word “rue” (French translation for “street”) followed by the name of the street. The corresponding abbreviation was the letter “r” followed by the initial of the street name. For example “rue des saphirs” (Sapphire street) was abbreviated “rs” (note: in French an article
between both words is required). POIs were abbreviated with the initial of their name (for example “museum” was abbreviated with the letter “m”). The braille legend was printed on a separate A4 sheet of paper that was placed next to the map (see figure 2). Text was written in uncontracted braille with the font “Braillenew” (font size 32 and line spacing 125%).
Specificity for the interactive map (IM). The interactive map included particular zones
and elements that were interactive; a double tap on these elements provided their name (see figure 2). Street names were marked with three dots (font DejaVuSans, normal, font size 47.5, line spacing 125%). These marks were repeated between crossings of the same street to avoid ambiguity. The circles representing POIs were made interactive without any additional mark (the name of the POI was announced on double tap on the circle).
Map Printing. The two main methods used for printing raised-line maps are vacuum
forming and microcapsule paper (Edman, 1992). Perkins (2001) showed that both techniques were efficient for presenting spatial information. We chose microcapsule paper because it is easier to handle. Another important aspect was that this kind of paper is slimmer, which is advantageous to detect touch input through the paper map. We used A3 format swell paper of the brand ZY®-TEX2. Maps were printed in landscape format with a Toshiba e-STUDIO 355 copier. For the braille legend we used A4 paper printed in portrait format with a Dell 3330dn Laser Printer XL. In both cases we used the same Piaf fuser for creating the relief. Embossment of microcapsule paper maps is altered after several uses. Therefore, we printed out a new exemplar after the map had been used five times. We checked that this was sufficient to maintain quality and readability of the maps over the whole experiment.
Experimental Setup
To sum up, the interactive map prototype in our study was composed of a raised-line paper map placed over a multi-touch screen, two loud-speakers, and a computer on which the map application was running (figure 1). The interactive map prototype was
functionally comparable to a regular tactile paper map. Users could explore the raised-line map on top of the screen with both hands, i.e. ten fingers, exactly the same way that they would explore a paper map. Exploratory movements did not produce any speech output. The interactive map contained no legend; Braille was replaced by audio output that was triggered through a double tap on the markers. No further input or output interaction was provided to ensure functional equivalence with the paper map. The
raised-line map overlay in the interactive prototype was identical to the raised-line map in the paper condition, except for the marks (braille abbreviation vs. three dots) and absence of legend.
2.2 Participants
Participants were recruited among students and employees of the Institute of the Young Blind Toulouse (Institut des Jeunes Aveugles, CESDV- IJA), among the user group of the Navig project (Katz et al., 2012), through announcement in the newsletter of the Valentin Haüy association, through a local radio broadcast for visually impaired people as well as by word-of-mouth. All participants gave informed consent to participate in the whole experiment composed by four sessions interleaved with one week. They received a gift certificate after completion of the study. None of the participants had seen or felt the experimental setup, or been informed about the experimental purposes before the experiment. To access users’ characteristics we used interviews instead of
questionnaires, following our previous recommendations for participatory design with visually impaired people (Brock, Vinot, et al., 2010).
Figure 3 shows the personal characteristics of the 24 legally blind participants (12 women, 12 men). Chronological age varied from 21 to 64 years (mean chronological age: 42 years, SD: 13.15). The age at onset of blindness varied from 0 to 27 (mean value: 8.71,
SD: 8.51). The proportion of lifetime without visual experience (Lebaz, Picard, &
Jouffrais, 2010) varied from 0.24 (meaning that the participant spent 24% of his life without visual experience) to 1 (meaning that the participant was born blind). The mean value was 0.87 (SD: 0.23). The blindness had different etiologies, including different illnesses as well as accidents. Some participants could perceive light or large objects when being very close but denied being able to use this residual vision in any form of spatial behavior. None of the participants had a known neurological or motor dysfunction in association with the visual impairment.
Figure 3. Description of the visually impaired participants. Means and SDs have been omitted from this table. *When visual impairment was progressive, two values are reported (the second value indicates the age at which legal blindness occurred).
We observed several personal characteristics including age, use of innovative technology, braille reading skills, tactile image reading skills, and orientation skills. For the subjective estimation of braille reading, tactile image reading and use of innovative technology we used a scale of 1 (low) to 5 (high). All participants were braille readers as this was a crucial condition to participate in the study. Braille reading experience varied from five to 58 years (M = 32 years, SD = 14.8). Most subjects read braille bimanually. We also assessed braille reading expertise (M = 4, SD = 1.0). We examined expertise of reading tactile images (M = 3.3, SD = 1.1)—including figurative images, maps and diagrams. All users except one had prior experience in reading tactile images. We also assessed frequency of using new technology (M = 4.2, SD = 0.9) as well as users’
expertise regarding new technology (M = 4, SD = 0.9). All participants had regular access to a computer and a cell phone. Most users also possessed a MP3 player. Proportion of lifetime with blindness was correlated with the frequency of using new technology (NewTech_freq, see figure 8), meaning that early blind people were frequent users of new technology.
As this study focuses on exploration and learning of topological maps, we were also interested in participants’ mobility and orientation skills. Participants' orientation skills were examined using the Santa Barbara Sense Of Direction Scale (SBSOD, Hegarty, Richardson, Montello, Lovelace, & Subbiah, 2002), which we translated into French. Besides we adapted the SBSOD to the context of visual impairment. Question 5 (“I tend to think of my environment in terms of cardinal directions”) had been extended to “I tend to think of my environment in terms of cardinal directions (N, S, E, W) or in terms of a clock face.” This modification has been proposed because the clock face method—i.e., indicating straight ahead as noon, to the right as 3 o’clock, etc.—is a popular method for orientation among the visually impaired population. Question 10 (“I don't remember routes very well while riding as a passenger in a car.”) was changed to “I do not remember routes very well when I am accompanied.” Scores from the Santa Barbara Sense of Direction Scale obtained a mean of 5.2 (SD = 0.6). We also interviewed users on their ease of travel (M = 4.1, SD = 0.9) on a scale of 1 (low) to 5 (high). Ease of travel was negatively correlated with proportion of lifetime with blindness and age (see figure 8), meaning that older and early blind people faced more apprehension towards traveling.
It is important to note that our subjects evaluated themselves as being above average concerning mobility and orientation. The SBSOD has been used in studies with sighted people (Hegarty et al., 2002; Ishikawaa, Fujiwarab, Imaic, & Okabec, 2008) and has never been as high as in our study. A possible explanation is that visually impaired people who volunteer for a study concerning mobility and orientation are highly autonomous—they have to travel to the lab—and feel proud and confident regarding traveling.
2.3 Procedure
In the following section, we describe the familiarization phase and the main experiment that was composed of a short-term and a long-term study.
Familiarization Phase
The experiment included a familiarization phase so that participants could get used to the map presentation and interaction. For this phase, we designed a simplified map containing only four streets and four points of interest (POI). We chose abstract names— streets and POIs were numbered (street 1 to street 4 and POI 1 to POI 4)—to avoid confusion with the experimental map. The subjects were encouraged to explore the familiarization map that was either presented as a paper or interactive version. All but one subject were already familiar with reading tactile paper maps. Thus, the
familiarization phase for the braille map mainly served to ensure the subjects were aware of the symbols and textures used on our maps. On the contrary, the interactive map was unknown for all users. They had to master the double tap to activate the interactive elements and to become familiar with the speech output. Familiarization time was limited to 10 minutes but users were free to stop earlier if they felt comfortable with the map. The time limit was sufficient for all participants.
Protocol
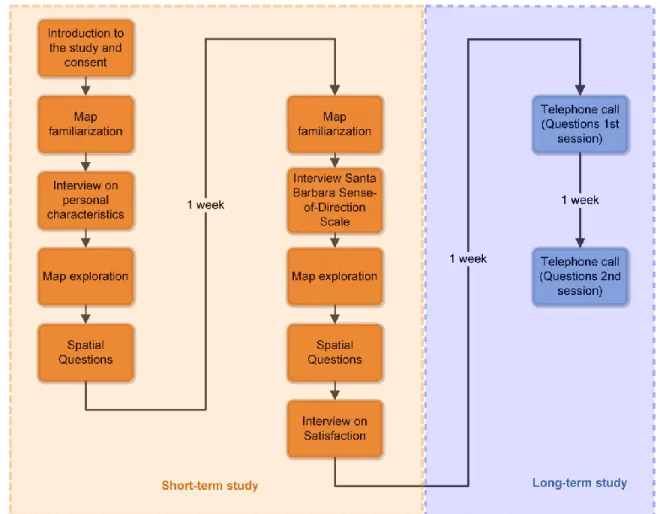
Figure 4. Experimental design of the study. The experiment was composed by a short-term and a long-term study. In this paper the color code orange will be used for the short-term and blue for the long-term study.
The experimental protocol included a short- and a long-term study that were each composed by two sessions (see figure 4). In order to avoid confusion between the
different map contents, we decided to split the evaluation into separate sessions. We fixed a delay of one week between each of the four sessions, so that it took three weeks for each participant to complete the whole experiment. This time schedule was imposed by the fact that we wanted to evaluate both short- and long-term memory for spatial
memorization. The delay of one week between the sessions for each map was set to one week for a practical reason: users could select a weekday that was convenient for them.
Short-term study: comparison of the usability of different map types
The two sessions of the short-term study took place in the laboratory ULYSS, a dedicated experimental environment in the IRIT research laboratory. Transport was organized door-to-door using the “Tisseo Mobibus service”, a local transportation service for people with special needs. Alternatively if participants preferred using public
transport, they were picked up at the nearest metro or bus station and then accompanied to the laboratory. Video and sound files were recorded for both sessions after agreement from the participants. The mean duration of these sessions from arrival in the
experimentation room to the end of the session without waiting for transport was 56.7 minutes (SD: 16.3). The minimum time was 30 minutes and the maximum time 103 minutes. There was no significant time difference between the two sessions.
Both sessions were organized following a similar procedure. In the first session, the subjects explored the familiarization map. Following this, an interview on personal characteristics was conducted. Then, we asked subjects to explore and learn the first map (either IM or PM depending on the group) with both accuracy and time constraints (“as quickly and as accurate as possible”). Participants were informed that they would have to answer questions afterwards without having access to the map. In order to motivate them to memorize the map, we prepared a scenario: users were asked to prepare holidays in an unknown city and we invited them to memorize the map in order to fully enjoy the trip. Magliano et al. (1995) observed that subjects remembered different types of map knowledge (landmark, route or survey knowledge) depending on the instruction before exploration. Thus, in order to motivate users to memorize all types of spatial information, we did not provide any cue on the kind of map knowledge that they should retain.
Subjects were free to explore until they felt like they had memorized the map. When they stopped, we measured the learning time and removed the map. Subjects then answered a questionnaire for assessing the three types of spatial learning (landmark, route, survey). The second session took place one week later and started with a familiarization phase followed by an interview on the Santa Barbara Sense of Direction Scale. The subjects then explored the second map type (either PM or IM depending on the group of subjects) and responded to the questions on spatial knowledge. We finally assessed their
satisfaction regarding the two different map types with the SUS questionnaire (Brooke, 1996) translated into French. After the questionnaire, we asked users which aspects they had liked and disliked about the two map prototypes. Part of the results on satisfaction has been published in (Brock et al. 2012).
Long-term study: investigating the map types’ effect on spatial memory
The long-term study extended the short-term study by two telephone interviews. The first phone call took place two weeks after exploration of the first map, and users were asked the same spatial questions as during the first session. They were previously informed about the phone call, but not about the nature of the questions. The second phone call took place two weeks after the second map exploration, and users were asked the same questions as in this second session. Phone interviews lasted between 10 and 15 minutes.
Observed Variables and Statistics
The principal independent variable in our study was the map type. Participants were divided into two groups in which the order of presentation of the two map types was counterbalanced (PM first and then IM, and vice versa). We did not expect the map content to have any effect on the results. Nevertheless, to assure correctness of the results, the order of presentation of the two different—but equivalent—map contents (1 and 2) was counterbalanced. The experience was therefore based on four groups with the following conditions: PM1-IM2, PM2-IM1, IM1-PM2 and IM2-PM1.
We measured usability through the three factors effectiveness, efficiency and
satisfaction. Efficiency was measured as learning time, i.e. the time needed for acquiring map knowledge. Satisfaction was evaluated with the SUS questionnaire (Brooke, 1996) as well as qualitative questions. As proposed by Bangor et al. (2008) we replaced the word “cumbersome” with “awkward” to make question 8 of the SUS easier to
understand. In an earlier study we had observed negative reactions to question 7 which is entitled “I would imagine that most people would learn to use this product very quickly.” Users had stated that “most people” would not use a product for visually impaired people. Therefore, we changed the wording to “I think that most visually impaired people would learn to use this product very quickly.” Finally, effectiveness was measured with spatial questions. More specifically we wanted to assess the three types of spatial knowledge: landmark, route and survey (Siegel & White, 1975). There is a variety of methods to evaluate spatial cognition but they are not all adapted to visually impaired subjects. We followed the suggestions from Kitchin & Jacobson (1997). We prepared several types of questions related to the same type of knowledge, which provides subjects with the chance to compensate for shortcomings on one specific type of question. For instance, one series of questions relied on the clock face method, whereas another series relied on cardinal directions. This example is substantial as some blind people are used to the clock face method, whereas others prefer using cardinal directions to orient themselves. For
assessing the landmark knowledge we asked participants to list the six street names (task called “L-S”) and the six points of interest (“L-POI”) presented on the map. The order of L-S and L-POI questions was counterbalanced across subjects. After completion of the landmark (L) related questions, we read out the complete list of streets and POI without giving any information concerning their locations on the map. This was to avoid that failure in the subsequent route and survey tests were due to failure in short-term memory. Questions related to route (R) and survey (S) knowledge were each divided into three blocks of four questions. The order of presentation of route and survey questions as well
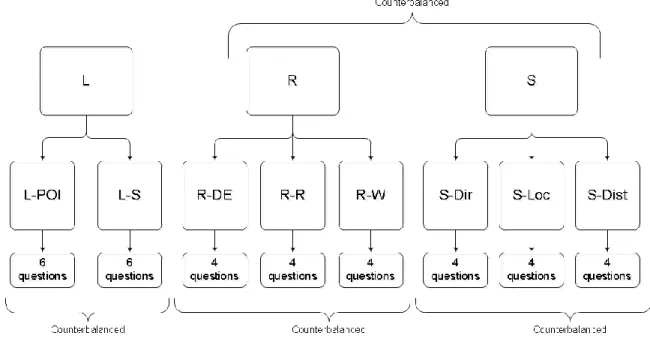
as the order of presentation of the blocks within each question type was counterbalanced, but the order of the four questions within each block was maintained. Figure 5 depicts the structure of the questions.
The three blocks for R type questions (containing each four questions) were: 1) Route distance estimation (“R-DE”): two couples of POI were proposed (e.g. museum - spa vs. railway station - obelisk) and participants had to select the two points separated by the longest route when following the roads ( also called functional distance by Ungar, 2000); 2) Route recognition (“R-R”): a route between two points was described and participants had to decide whether the description was correct or not; 3) Wayfinding (“R-W”): a starting point and a destination were provided. Then the participants had to describe the shortest route between these two points.
Figure 5. Structure of the spatial questions in the study. Questions were separated in three categories: landmark, route and survey. Within each category questions were counterbalanced. L = landmark, L-POI = landmark-points of interest, L-S = landmark - street names, R = route,
R-DE = route distance estimation, R-R = route recognition,
R-W = route wayfinding, S = survey, S-Dir = survey direction estimation, S-Loc = survey location estimation, S-Dist = survey distance estimation.
The three blocks for S type questions (containing each four questions) were:
1) Direction estimation (“S-Dir”): a starting point and a goal were given and participants had to indicate the direction to the goal using a clock face system (e.g. three o’clock for direction east); 2) Location estimation (“S-Loc”): the map was divided into four
equivalent parts (northeast, northwest, southeast, southwest), and participants had to decide for a POI in which part it was located; 3) Survey distance estimation (“S-Dist”): two couples of POI were proposed (e.g. museum - railway station vs. spa - obelisk), and participants had to decide which distance was the longest one in a straight line (Euclidian distance).
In the whole test each subject could get a maximum of 36 correct answers (12 for L, 12 for R and 12 for S). The spatial scores were compared regarding map type (within-participant factor), order of presentation (between-(within-participant factor) and spatial task (participant factor). For the long-term study the time was introduced as a within-participants factor.
Finally, we introduced another set of dependent variables: the users’ confidence in their responses to spatial questions. We let participants evaluate confidence on a scale from 1 (not confident at all) to 5 (very confident). The question was systematically asked after each of the eight blocks of spatial questions. We tested if confidence was dependent on the map type, order of presentation and the type of spatial knowledge, as well as the delay between exploration and questions (short-term versus long-term).
3. RESULTS
3.1 Short-term Study: Comparison of the Usability of Different Map
Types
The short-term study aimed at comparing the three criteria of usability between the two map types (PM vs IM). To our knowledge, no prior study has systematically
compared the usability of an accessible interactive map with a classical raised-line map. We made the assumptions that: 1) exploration duration (corresponding to the learning time) reflects the efficiency of the maps; 2) the quality of spatial learning (measured as spatial scores) reflects the effectiveness of the maps; 3) the scores of a SUS questionnaire reflect user satisfaction. In addition, we also evaluated users’ confidence in their own responses, assuming a higher confidence when using the interactive map. An alpha level of .05 was used for statistical significance in every test. Error bars in the diagrams indicate 95% confidence intervals.
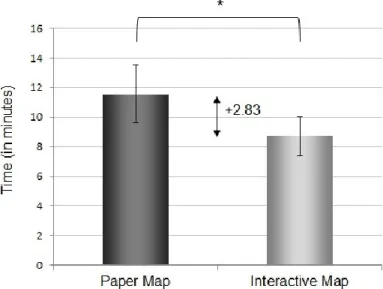
Learning Time (Efficiency)
During the experiment, users were asked to learn the map as accurately and as quickly as possible. Learning Time varied from five to 24 minutes with a mean value of 10.1 (SD = 4.4). The observed time values were not normally distributed (Shapiro-Wilk
W = 0.89, p < .001) but logarithms conformed to a normal distribution (Shapiro-Wilk W
= 0.96, p = .086). The logarithm of Learning Time was then compared across map type and order of map presentation in a 2 (map type, within-participants factor) x 2 (order of presentation, between-participants factor) analysis of variance (ANOVA). A significant effect of the map type emerged (F(1,22) = 4.59, p = .04) as depicted in figure 6. Learning Time was significantly shorter for the interactive map than for the paper map. We did not observe any effect of the order of presentation (F(22,1) = 0.24, p = .63), nor significant interactions. Because of the low number of participants we confirmed these results with non-parametric test (Wilcoxon rank sum tests, data not shown). We verified that there was no learning effect between the first and the second map that subjects explored. We also verified that there was no significant effect between the two different map contents.
Figure 6. Learning Time (mean values measured in minutes) for the paper map (left) as compared to the interactive map (right). The Learning Time for the interactive map was significantly lower than for the paper map (lower is better). In other words, efficiency of the interactive map was
significantly higher. Error bars show 95% confidence intervals in this and all following figures. * p < .05.
Spatial Learning (Effectiveness)
In order to estimate spatial learning we analyzed the scores to the questions on spatial knowledge. We expected that participants would obtain higher spatial knowledge scores with the interactive map than with the paper map.
The sums of the scores (i.e., L, R and S tasks summed up for each map) varied from eight to 36 and were distributed normally (Shapiro Wilk W = 0.96, p = .089). They were compared across map type and order of map presentation in a 2 (map type) x 2 (order of presentation) ANOVA. Although the scores for the interactive map were slightly higher (M=25.6, SD = 6.8) than for the paper map (M = 24.9, SD = 6.8), the effect of map type was not significant (F(22,1) = 0.45, p = .51). There was no effect of the order of
presentation (F(22,1) = 0.08, p = .79). We did not observe any significant interaction either (F(22,1) = 1.25, p = .28). Because of the low sample number we confirmed these findings with non-parametric tests (Wilcoxon rank sum tests, data not shown). We verified that there was no learning effect between the first and the second map that subjects explored. We also verified that there was no significant effect between the two different map contents. The effectiveness of reading the paper map was correlated with the expertise in reading tactile images; as was the effectiveness of reading the interactive maps (see figure 8). This is not surprising as both map types are based on exploring a raised-line map overlay.
Differences were observed when looking at average mean scores for L, R, and S questions, both when looking individually at each map (see figure 7a) and when scores
were summed up for the interactive and the paper map. For summed-up scores, pairwise Wilcoxon rank sum tests with Bonferroni correction (alpha level = .017) revealed that the difference between L and R was significant (N = 45, Z = 5.20, p < .001) as well as the difference between L and S questions (N = 43, Z = 5.06, p < .001). There was no significant difference between R and S questions (N = 41, Z = 0.41, p = .68).
(a) (b)
Figure 7. a) Mean spatial scores to landmark, route and survey questions for the paper and the interactive map. Mean landmark scores were significantly higher than those for route and survey. There was no significant
difference between R and S scores. There was no significant difference between the two maps. b) Effect of order of presentation on landmark scores. The mean scores for L questions were significantly higher when the interactive map was presented before the paper map.
** p < .01*** p< .001
Finally, Mann-Whitney U Test revealed a significant effect of the order of map presentation on L scores (U = 149, n1 = n2 = 24, p = .004). L scores were higher if the interactive map was presented before the paper map (see figure 7b). There was no significant effect of order of presentation for R and S scores. Landmark knowledge for the paper map was correlated with the Santa Barbara Sense of Direction Scale (see figure 8), meaning that people with higher orientation skills obtained better landmark scores. In the same way, landmark knowledge for the interactive map was correlated with the Santa Barbara Sense of Direction Scale.
User Satisfaction
We predicted that the interactive map would yield higher satisfaction, i.e. comfort and positive attitudes, than the paper map. User satisfaction was assessed with the SUS
study SUS scores varied between 45 and 100 with a mean value of 83.8 (SD = 13.9). Scores were not normally distributed (Shapiro Wilk W = 0.85, p < .001). They were marginally better for the interactive map (M = 86.6, SD = 13.7) than for the paper map (M = 81.0, SD = 13.9), without being statistically significant (Wilcoxon signed-rank test,
N = 22, Z = 1.9, p = .058). Yet there was a clear preference among users in favor of the
interactive map: 17 users preferred the interactive map, 6 users the paper map and one user had no preference.
The six users who preferred the paper map were interviewed about their preference for this map. Two users stated the ease of memorizing written information. One user mentioned interaction problems with the interactive map, more precisely that there was too much audio output. One user stated that she preferred braille over speech, while another one mentioned the ease of use. Finally one user said that the legend of the paper map was helpful because it presents a list of all the map elements that the user may find during exploration. We asked the 17 users who preferred the interactive maps which aspect they had most liked or disliked about the map. Seven users preferred speech output over braille text. Four users enjoyed that there was no need to read a legend. Three users enjoyed the ease of use of the interactive map. One user stated the ease of memorizing spoken text; one user said that the interactive map was ludic. Finally one user stated the possibility to add supplementary content (like opening hours) on the interactive map without overloading the tactile drawing. This would not be possible on a raised-line map with braille where the amount of information is limited through the available space.
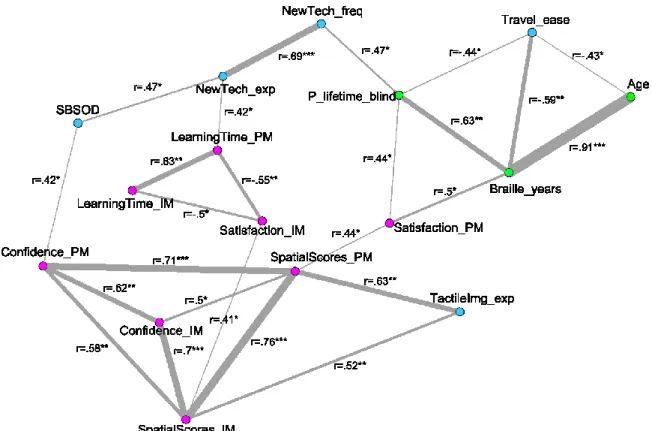
Further qualitative feedback revealed that many of the participants who preferred the paper map, were experienced braille readers and that often these people had spent a longer period of life without sight. This observation was confirmed by a significant linear correlation between the satisfaction of reading paper maps and the proportion of lifetime without blindness as well as a significant correlation between the satisfaction of reading paper maps and the braille reading experience (see figure 8). Interestingly several users with good braille reading skills stated that the interactive map would be helpful for someone who does not read braille. On the other hand many of the participants who preferred the interactive map reported that they were used to interactive devices with audio output, such as the iPhone with VoiceOver. Accordingly, some of them stated that they had problems reading braille. Surprisingly we did not find any correlation between the frequency or experience using new technology and satisfaction using the interactive map. However, the learning time with the paper map was correlated with the expertise in using new technology (see figure 8), in other words subjects that consider themselves as new technology experts needed more time for reading the paper map with braille text.
Satisfaction of using one or the other map was correlated with effectiveness (Satisfaction_PM, Satisfaction_IM, see figure 8). High performers reported a higher satisfaction than low performers. Satisfaction also depended on efficiency: satisfaction was negatively correlated with the learning times for both maps.
Figure 8: Significant correlations between dependent variables (magenta), age-related factors (green) and personal characteristics (blue). The width of the lines between nodes increases with the strength of the correlation (r value). Abbreviations: exp = expertise, freq = frequency, IM = interactive map, PM = paper map, SBSOD = Santa Barbara Sense of Direction Scale. * p < .05, ** p < .01, *** p < .001. The diagram was created with the Gephi software (Bastian, Heymann, & Jacomy, 2009).
Users’ Confidence
We expected higher confidence in users’ responses when using the interactive map than when using the paper map. Users’ confidence in response to spatial questions for the paper map varied from 1.83 to 4.67 with a mean value of 3.87 (SD = 0.68). For the interactive map the values varied from 2.5 to 5.00 with a mean of 3.98 (SD = 0.59). As scores for users’ confidence were not normally distributed (Shapiro Wilk W = 0.89, p < .001), we used non-parametric tests. There was no significant effect on users’ confidence in their own responses to spatial questions as regards to the map type (Wilcoxon signed rank, N = 22, Z = 0.84, p = .4) or the order of presentation (Mann-Whitney U Test, U = 71.5, n1=n2=12, p = 1.0).
However, we observed a significant effect of the type of task (L, R, or S questions) on users’ confidence, as shown in figure 9. Confidence was significantly higher after
Bonferroni correction (alpha level = .017) for L than R (Wilcoxon signed-rank tests, N = 46, Z = 5.89, p < .001) or S tasks (N = 44, Z = 5.75, p < .001) questions. No significant