Br. J . Nutr. (1982), 47, 191
Protein-polyphenol reactions
191
1. Nutritional a n d metabolic consequences of the reaction between oxidized caffeic acid a n d the lysine residues of casein
B Y R. F. H U R R E L L A N D P. A. F I N O T
Nestlt! Research Department, CH-1814 La Tour de Peilz, Switzerland A N D J. L. C U Q
Laboratoire de Chimie et Technologie Alimentaire, Universitb des Sciences et Techniques, 34060 Montpellier, France
(Received 4 April 1981 - Accepted6 October 1981)
1. Studies were made on the lysine content ofcasein reacted with caffeic acid oxidized aerobically under alkaline
conditions or enzymically with tyrosinase (EC 1 .14.18. I).
2. Loss of fluorodinitrobenzene (FDNB)-reactive lysine was rapid at pH 10 and increased with time and the
temperature of the reaction, with concentration ofcaffeic acid and with the oxygenation of the mixture. In presence of the enzyme mushroom tyrosinase, maximum reduction of reactive lysine occurred at pH 7 and was dependent on the reaction time and on the concentration of caffeic acid.
3. Reaction of a-formyl-L-[U- 14C]lysine with caffeic acid at pH 10 showed the rapid formation of five reaction
products which appeared to polymerize gradually as the reaction progressed.
4. The nutritionally available lysine content of thecasein-caffeic acid mixtures, as assayed with rats, was reduced after both alkaline and enzymic reactions, as were faecal digestibility, net protein ratio and net protein utilization. Biological value however was not reduced.
5. In metabolic studies using goat milk casein labelled with ~-[~H]lysine and reacted with caffeic acid in the same way, the lysine-caffeoquinone reaction products were not absorbed by the rat but were excreted directly in the faeces.
6. The importance of the reaction of proteins with caffeoquinone and chlorogenoquinone (formed by the oxidation of caffeic and chlorogenic acids respectively) is discussed in relation to the production of sunflower protein, leaf protein and other vegetable-protein concentrates.
Plant polyphenols include phenolic acids, flavonoids and tannins. They are widely distributed in leaves, stems, roots, flowers, fruits and seeds and almost universally present in animal diets derived from plants (Singleton & Kratzer, 1969). The different classes of polyphenol have somewhat different nutritional or physiological activities. The tannins may reduce protein digestibility (cf. Ford & Hewitt, 1979) and perhaps the bio-availability of other nutrients. The flavonoids have most frequently been studied in relation to ascorbic acid metabolism (Hughes, 1978) although they have been reported to have other pharma- cological and nutritional activites (Kuhnau, 1976). In the present paper, we consider the influence of phenolic acids on the nutritional quality of plant protein concentrates.
Phenolic acids are mainly derivatives of cinnamic acid and are widely distributed in a large number of food plants (Maga, 1978) where they are probably an important means of self-defence against infective agents, predators and parasites (Synge, 1975) as well as being involved in the synthesis of lignin (Pierpoint, 1971). One of their major chemical properties is the ease with which they oxidize. In the presence of oxygen, chlorogenic acid, caffeic acid and other related o-diphenols can oxidize in alkaline solution or by the action of polyphenol oxidase enzymes. The first products of oxidation are o-semiquinone radicals or o-quinone molecules which are highly reactive and which normally react further to give brown products of high molecular weight. Enzymic browning reactions of this type readily occur in many fruits and vegetables when bruised or cut tissue is exposed to air (Joslyn & Ponting,
192
R. F.
H U R R E L L ,
P. A.F I N O T
A N DJ.
L.
C U Q1951) and they could also occur during the extraction of protein concentrates (cf. Synge,
1975).
Sunflower provides the world’s second-largest oil seed crop (Robertson, 1975), however
the utilization of its protein is restricted due to the presence of o-diphenols which discolour the product during protein extraction at alkaline pH (Cater et al. 1972). Chlorogenic acid is the major phenolic acid in sunflower; it comprises 0.015-0.02 of the dry weight of the
kernel (Milic et al. 1968; Pomenta & Burns, 1971) and accounts for approximately 0.6 of the total phenolic compounds (Sabir et al. 1974). Colourless sunflower-protein isolates have been obtained after making a preliminary extraction of the polyphenols (Sodini & Canella,
1977; Bau & Debry, 1980).
Lucerne (Medicago sativa) shoots contain a variety of polyphenols including phenolic acids (Newby et al. 1980) and flavonoids (Monties & Rambourg, 1978). It has been proposed that during the production of leaf-protein concentrates the nutritional quality of the proteins, and particularly their lysine may be adversely affected by the reaction of protein with quinone oxidation products of plant polyphenols (Allison et a f . 1973; Davies et al.
1978). Off-colours may also be produced (Free & Satterlee, 1975). The reaction of quinones
with amino acids and proteins was reviewed by Mason (1955). A more recent study of the
reaction of enzymically-generated caffeoquinone and chlorogenoquinone with amino acids and protein was made by Pierpoint (1969q 6, 1971). The sulphydryl groups of cysteine and
the s-amino groups of lysine as well as a-terminal amino groups appear to combine most readily with quinones. Methionine (Vithayathil & Murphy, 1972; Bosshard, 1972) and
tryptophan (Synge, 1975) could also react and, in addition, methionine, cysteine and tryptophan might be oxidized by the quinones (Synge, 1975). Pirie (1975) has reported the
formation of methionine sulphoxide during leaf-protein extraction.
The only direct evidence of the influence of these reactions on protein quality comes from a study performed by Horigome & Kandatsu (1968). They reacted a casein solution with
enzymically-oxidized caffeic acid, isochlorogenic acid and other unidentified polyphenols and reported that the resulting brown protein had lower biological values (BV), protein digestibilities and fluorodinitrobenzene (FDNB)-reactive lysine values than the original casein. In the present study we have used model systems containing either casein or a-formyl-lysine to investigate further the nutritional and metabolic consequences of the reaction between proteins and oxidized caffeic acid.
E X P E R I M E N T A L
Preparation of test materials
Casein-cafeic acid mixtures f o r chemical estimation of lysine. To prepare the standard reaction mixtures, 25 g casein (type Hammarsten; E. Merck, Darmstadt, W. Germany) was
dissolved in 450 mlO.03 M-sodium hydroxide. Casein solution (90 ml) plus 0.2 g caffeic acid (Sigma Chemical Company, St Louis, Mo., USA) were mixed together in a 250 ml conical flask. The quantity of caffeic acid taken was equivalent to 0.04 of the weight of the casein.
The pH was adjusted to the desired value with 2 M-NaOH. To certain reaction mixtures tyrosinase (EC 1 . 14.18.1 ; Sigma Chemical Company, St Louis, Mo., USA) containing/mg solid: 4000 units tyrosinase activity, 94370 units polyphenol oxidase activity, 277600 units
catechol oxidase activity, was added at 0.01 (w/w) the level of caffeic acid. After adjusting
the volume to 100 ml, the mixtures were magnetically stirred for up to 3 h at room
temperature, with 0, constantly bubbling into the bottom of each reaction flask. The caseinxaffeic acid complex was then precipitated by the addition of 1 M-hydrochloric acid to pH 4 . 6 4 8 , filtered under vacuum, freeze-dried and ground. The filtered material was
not washed.
Protein-polyphenol reactions
193
addition of tyrosinase, were adjusted to different pH values in the pH range 65-10 and stirred for 3 h at room temperature. To investigate the influence of time, standard mixtures at pH 10, and at pH 7 plus tyrosinase, were stirred with 0, at room temperature for 10, 20, 30, 60, 120 and 180 min. To investigate the influence of caffeic acid concentration, casein<affeic acid systems containing caffeic acid at 0.04, 0.10, 0.20, 0.30, 0.40 the weight of casein were adjusted to pH 10 and to pH 7. Tyrosinase was added to the pH 7 solution at 0.01 the weight of the caffeic acid. The solurions were stirred with oxygen for 3 h at room temperature. To investigate the influence of temperature, the standard mixtures at pH 10 and at pH 7 plus tyrosinase were stirred with oxygen for 3 h either at room temperature(20°), at 40’ or at 60°.
Reaction mixtures were also prepared containing chlorogenic acid (Sigma Chemical Co., St Louis, Mo., USA) at 0-08 and 0.20 the weight of casein. They were adjusted to pH 7 and to pH 10. Tyrosinase was added to the pH 7 mixture at 0.01 the weight of chlorogenic’ acid. The solutions were stirred with 0, for 3 h at room temperature.
Casein-cafeic acid mixtures for animal studies. Casein (100 g) was dissolved in approxi- mately 1900 mlO.04 M-NaOH in a 4 1 beaker. Caffeic acid (4 g; 0-04 of the weight of casein) was added and the pH was adjusted to pH 7 with 2 M-NaOH. Similar solutions were prepared at pH 7 with 25 mg tyrosinase added and at pH 10. The solutions were adjusted to 2 1, and stirred with 0, for 3 h at room temperature. After the reaction, the casein-caffeic acid complex was precipitated at pH 4 4 - 4 8 by addition of 1 M-HC~, filtered under vacuum, freeze-dried and ground. Each product was prepared four times and the products pooled. The material at pH 7 was designated P29; that at pH 7 plus tyrosinase, P30; and that at pH 10 was designated P3 1.
Further materials were prepared in which caffeic acid was added to the reaction mixture at 0.1 the weight of casein. In the first trial, 50 g casein was dissolved in approximately 900 ml 0.03 M-NaOH in a 4 1 beaker. Caffeic acid (5 g) was added and the pH was adjusted to pH
7 with 2 M-NaOH. Tyrosinase (20 mg) was added and the volume was adjusted to 1 1. A similar solution was prepared at pH 10 but without tyrosinase. Both solutions were stirred with 0, for 3 h, precipitated and dried as described previously. Each product was made twice and pooled. The pooled samples were designated P32 and P33 respectively.
In a second trial, the same products were prepared using a four times greater quantity of starting material. Casein (200 g) was dissolved in approximately 3600 mlO.03 M-NaOH in an 8 1 beaker. Caffeic acid (20 g) was added and 80 mg tyrosinase to the pH 7 system
only. The product at pH 7 plus tyrosinase was designated P36 and that at pH 10 was designated P37.
Casein-cafeic acid mixtures for metabolic study. These samples were made from goat’s-milk casein labelled with [3H]lysine. The casein was provided by a colleague, Dr R. Jost. It was prepared under the direction of Dr D. Salter at the National Institute for Research in Dairying, Reading, from tritiated goat’s milk collected from an animal into which 80 mCi ~-[4,5-~H]lysine (specific activity 83 Ci/mmol, purchased from Radio- chemical Centre, Amersham, Bucks.) had been infused intravenously. The preparation was rennet precipitated and contained 131 mgN/g and 36.4 pCi/g.
Tritiated goat’s casein (10 g) and 10 g Hammarsten casein were dissolved in 387 mlO.04 M-NaOH. A portion (96.7 ml) of this solution was removed before any treatment to act as the control sample and was precipitated at pH 4.7 by the addition of 1 M-HCl, freeze-dried and ground. Caffeic acid (0-6 g) was added to the remaining solution, which after adjusting to pH 7 with ~ M - N ~ O H , was divided into three equal portions and placed in 250ml conical flasks. To one of the flasks, 2 ml tyrosinase solution (0625 mg/ml) was added, to another 2 M-NaOH was added to pH 10. The three reaction mixtures (pH 7, pH 7 + tyrosinase and pH 10) were then diluted with water to 100 ml and stirred with 0, for
194
R.
F. H U R R E L L ,
P. A. F I N O T
A N DJ.
L.
C U Q
3 h at room temperature. The caseinxaffeic acid complexes were precipitated, freeze-dried and ground as described previously.
Analytical methods
N was determined by an automatic Kjeldahl procedure using the Kjelfoss apparatus (Foss Electric, Hillered, Denmark). Total amino acids were estimated in acid hydrolysates of test materials by ion-exchange chromatography using a Beckman Multichrom amino acid analyzer (Beckman Instruments, Munich, W. Germany). Methionine and cystine were determined as methionine sulphone and cysteic acid respectively after preliminary performic acid oxidation (Moore, 1963). Tryptophan was measured colorirnetrically according to Spies & Chambers (1949), after papain predigestion (Mauron et al. 1960). Fluorodinitro- benzene (FDNB)-reactive lysine was determined by the direct procedure of Carpenter (1 960) as modified by Booth (1971) and also by the difference method (Roach et al. 1967). In the difference technique, the free lysine, regenerated from bound or inaccessible lysine, was estimated by ion-exchange chromatography of acid-hydrolysates that had been prepared for the direct FDNB method. Reactive lysine by difference was calculated as total lysine minus bound lysine (cf. Hurrell & Carpenter, 1974). All analyses were made in duplicate. Significant differences between the means were identified using the two-tailed t test.
An imal experiments
Net protein ratio, net protein utilization, faecal N digestibility and BV. In the first experiment, control casein and the casein-caffeic acid (1 : 0.04) complexes produced at pH 7 (P29), pH 7 plus tyrosinase (P30) and pH 10 (P31) were assayed for their value as the only protein source for young rats using the net protein ratio (NPR) test (Bender & Doell, 1957). In the same experiment, control casein was fed with 0.04 caffeic acid (untreated) and with 0.04 caffeic acid polymerized at pH 7 plus tyrosinase or at pH 10. The polymerized caffeic acids were produced under the same conditions as the corresponding caseinxaffeic acid complexes (P30 and P31) but without the addition of casein. They were added to the diets as dark brown solutions.
Forty-eight male weanling rats of the Sprague Dawley strain (Voss, Tuttlingen, W.
Germany) weighing 5&60 g were given a stock laboratory diet for 2 d. They were then randomly allocated into forty-eight cages and six rats were allotted to each of the eight diets. The N-free diet consisted of (g/kg): agar 20, sucrose 250, arachis oil 100, minerals (Hawk & Oser, 1931) 40 and maize starch to 1000. The vitamins, as described by Mottu & Mauron (1967), were added during the preparation of the diets which were fed as a pudding containing approximately 0.40 water (Mauron & Mottu, 1958). The test materials were added to the N-free diet at a level of 100 g crude protein (N x 6*25)/kg at the expense of maize starch. The rats were fed ad lib. for 10 d, the food being replaced each day. Any food remaining from the previous day’s supply was collected, dried and weighed. Food consumption and weight gain were recorded and NPR was caluculated by adding the weight loss of the N-free group to the weight gain of the test group and then dividing by the weight of crude protein consumed by the latter. Significant differences in NPR values, and in all subsequent animal assay values, were identified using the two-tailed t test.
During the final 5 d of the NPR assay, the faeces were collected and, after a preliminary hydrolysis for 24 h in 7 m13 M-HCl, they were analysed for N using the Kjelfoss apparatus. True faecal N digestibilities of test materials were calculated. At the end of the NPR assay, the rats receiving the control casein diet and those fed the casein-caffeic acid complexes were transferred to metabolic cages for a further 5 d. BV and net protein utilization (NPU)
were measured according to the balance-sheet method of Mitchell (19234). As the N-free group was not included in this balance study, faecal endogenous N was estimated from the
Protein-polypheno1 reactions 195 faecal endogenous N excreted by the N-free group during the last 5 d of the NPR assay. Endogenous urinary N was calculated from the results obtained in a second N-balance experiment described later, which included an N-free group.
In this second experiment, control casein and the casein-affeic acid (1 :0.10) complexes prepared at pH 7 plus tyrosinase (P32) and at pH 10 (P33) were similarly assayed by the NPR test. At the end of the assays, the rats on the test diets and those receiving the N-free ration were transferred to metabolic cages for a further 3 d. BV, NPU and faecal N
digestibility were measured according to the approach of Mitchell (1923-4). Faecal endogenous N excreted by the rats consuming the N-free ration was calculated as mg/g food eaten, and the estimates of faecal endogenous N excreted by rats receiving the test diets was calculated according to their food intake. Endogenous urinary N was determined as mg N excreted/kg body-weight of the rats fed on the N-free diet. The endogenous urinary excretions of the test groups were then estimated according to the body-weight of the rat.
Available lysine assay. Casein (Hammarsten) and the casein+affeic acid complexes P29, P30, P31, P36 and P37 were assayed in two separate experiments for available lysine with rats using a modified version of the method of Mottu & Mauron (1967). In the first experiment casein and the casein-caffeic acid (1 :0.04) samples prepared at pH 7, at pH 7 with tyrosinase and at pH 10 (P29, P30 and P31 respectively) were analysed. Seventy-eight male weanling Sprague Dawley rats weighing 50-60 g were reared on a commercial ration for 2 d and then randomly allocated to seventy-eight cages. Six rats were allotted to each of the thirteen diets. The basal diet contained (g/kg): wheat gluten 100, zein 100, sucrose 250, arachis oil 50, agar 20, L-histidine hydrochloride monohydrate 2, L-tryptophan 1.4, L-methionine 2, L-valine 1.8, L-threonine 1.5, minerals (Hawk & Oser, 1931) 40 and maize
starch to 1000. The vitamins were added, as described by Mottu & Mauron (1967), and
the diets prepared and fed as a pudding. The basal diet was supplemented with L-lysine hydrochloride at 0, 0.8, 1.6, 2.4 and 3.2 g/kg and the test materials were added at levels which contributed 13 and 26 g crude protein/kg respectively a t the expense of maize starch and zein to keep the diets isonitrogenous. The diets were fed ad lib. for 10 d and the response
of the rats was measured both as g weight gain and as g weight gain/g food eaten relative to the level of supplementary lysine in the diet. The potency of the test materials was compared to that of lysine using the slope-ratio method of Finney (1964).
In a further experiment, casein and the casein+affeic acid (1 : 0- 10) complexes prepared at pH 7 plus tyrosinase (P36) and at pH 10 (P37) were assayed for available lysine as described previously except that the diets were fed for 14 d.
Metabolic study
Twelve male Sprague Dawley rats weighing 8&90 g were reared for 5 d on a casein diet containing 100 g crude protein/kg. The composition of this diet was as described previously for the NPR test. A portion of diet, containing 5 g dry matter, was then offered for 30 min
only, twice daily, at 07.00 hours and at 18.00 hours. After 5 d the rats had become trained to eat almost all the food offered during the 30 min feeding period. On the morning of the sixth day, three rats were randomly allocated to each of the four test diets. A portion of diet containing 2.5 g dry matter, 4 ,uCi and approximately 250 mg tritiated casein or the casein-affeic acid complexes was offered to each rat. It was rapidly and completely consumed.
The animals were transferred to metabolic cages. Urine and faeces were collected every 6 h for 72 h and frozen at -2OO. At the end of the assay, the rats were killed by a sharp blow on the head. A blood sample was taken and the liver, kidneys, and a portion of thigh
muscle were removed for analysis and stored at - 20'. The level of radioactivity, in duplicate 200 ,ul portions of thawed urine samples, was measured directly in the liquid scintillant
196
R.
F.
HURRELL,
P.A.
FINOT
A N DJ.
L. CUQ
Aquasol (New England Nuclear, Boston, Mass., USA) using a liquid-scintillation counter (Mark 111 ; Searle Analytical Corporation, Des Plaines, Illinois, USA). The faeces were combusted in an Oxymat (Intertechnique, Plaisir, France) and the levels of radioactivity counted on the scintillation counter.
The liver was first weighed and then homogenized in three times its weight of saline (9 g sodium chloride/l). The radioactivity of duplicate 200 p1 portions was measured after combustion in the Oxymat. The proportion of radioactivity bound to liver proteins was determined after precipitating them with sulphosalicylic acid (100 g/l). The radioactivity in the precipitate was measured after combustion in the Oxymat, while that of the supernatant was measured directly by scintillation counting in Aquasol. The kidneys were analysed in the same manner.
The method of Scharff & Wool (1964) was used to remove free amino acids from the thigh muscle samples. Approximately 750 mg of muscle was soaked for 3 min in ice-cold Krebs bicarbonate buffer, blotted and then boiled for a further 5 min in 3 mlO.02 M-NaCl containing 30 g/l sulphosalicylic acid. The radioactivity of the supernatant fraction was measured directly in Aquasol and that remaining in the muscle was determined after combustion in the Oxymat.
Reaction of a-forrnyl-L--[U-14C]lysine with cafeic acid
Radioactive a-formyl lysine (1 pmol, 0.38 pCi/pmol), synthesized according to the method of Hofmann et al. (1960) and 5 pmol caffeic acid were dissolved in (1) 0.2 ml pH 7 buffer (0.2 M-phthalate), (2) 0.2 ml pH 7 buffer plus 10 pl tyrosinase solution (1 mg/ml), or (3) 0.2 ml 0.2 M-carbonate-bicarbonate buffer (pH 10). The three solutions were oxygenated and allowed to stand at room temperature. Portions (10 p l ) were taken at intervals up to 60 min and analysed by the paper electrophoretic procedure of Biserte et al. (1960) using a pyridine-acetic acid-water (6: 20: 974, v/v) system at pH 3.9. The papers were subsequently examined by autoradiography. The proportion of the original radioactivity of a-formyl lysine engaged in €-amino lysine-caffeic acid reactions was determined by counting the radioactivity in the spots representing the reaction products using a Berthold Scanner (Berthold, Wildbad, W. Germany).
The same reaction mixtures were analysed by paper electrophoresis after standing for
4 h at room temperature. The radioactive spots representing the a-formyl lysine-caffeic acid reaction products were eluted with water and then hydrolysed in 6 M-HCI for 24 h. The radioactive lysine generated on acid-hydrolysis was determined quantitatively, after separation by paper electrophoresis, by combustion of the lysine spots in the Oxymat and measuring the radioactivity using the liquid-scintillation counter.
R E S U L T S
Total amino acids
Casein and the casein-caffeic acid mixtures (1 : 0.3) prepared at pH 7 with tyrosinase and at pH 10 were analysed for their total amino acid content (Table I ) . Lysine and tryptophan were decreased by approximately one half in both casein-caffeic acid mixtures. Histidine and tyrosine were also significantly decreased (P < 0.05) in the casein-cafleic acid mixture prepared at pH 7 with tyrosinase, although to a lesser extent. Methionine was lower in this material than in the untreated casein but the difference was not significant (P > 0.05). Reaction of casein with caffeic acid under our conditions appeared to have little influence on the levels of other amino acids.
Protein-polyphenol reactions 197
Table 1 . Total amino acid contents* (mglg crude protein (nitrogen x 6.25)) of casein and of casein-caffeic acid mixtures? reacted for 3 h at room temperature
Casein-caffeic
acid, pH 7 Caseinxaffeic Pooled
Casein +tyrosinase acid, pH 10 SEM
Aspartic acid 71.8 71.1 74.0 1.4 Threonine 43.3 43.0 45.7 1
.o
Serine 58.7 58.7 60.8 1.2 Glutamic acid 229.0 222.8 234.6 2.3 Proline 106.5 103.3 109.9 3.4 Glycine 18.0 17.1 18.8 0.9 Alanine 30.5 30.1 33.6 2.1 Valine 63.3 61.3 66.5 1.9 Methionine 36.7 30.5 33.5 1.8 Cyst(e)ine 5.2 5.0 5.4 0.3 Isoleucine 53.3 50.4 55.4 1.o
Leucine 99. I 97.4 101.8 1.8 Phenylalanine 54.6 51.6 56.1 2.3 Histidine 28.5 21.8f 28.5 0.9 Arginine 37.6 39.8 35.0 1.3 Tryptophan 16.5 6.93 8.63 0.4 Tyrosine 60.0 51.53 58.0 1.2 Lysine 83.4 54.13 42.13 1.1* Each value is the mean of two observations.
Each reaction mixture contained 5 g casein and 1.5 g caffeic acid (1:0.3, w/w) in 100ml distilled water
djusted to pH 7 or pH 10 with sodium hydroxide. Tyrosinase (15 mg) was added to the reaction mixture at pH
For further details, see p. 192.
3 Significantly lower ( P < 0.05) than corresponding value for casein (3 df).
6 7 8 9 10
P H
Fig. 1. Proportion of FDNB-reactive lysine remaining in casein4affeic acid systems reacted at different
levels of pH.
(a),
with tyrosinase (EC 1 . 14.18. 1);(w),
without tyrosinase; (A), without tyrosinase,without agitation, without oxygenation. Each value is the mean of duplicate determinations. The pooled
SEM was 1.0 mg/g crude protein (nitrogen x 6.25) corresponding to 0,012 on the proportion scale; the
FDNB-reactive lysine content of the untreated casein was 82.0 mg/g crude protein. For experimental details, see p. 192.
198
R.
F. H U R R E L L , P. A. F I N O T A N DJ.
L.
C U Q0 60 120 180
Period of experiment (rnin)
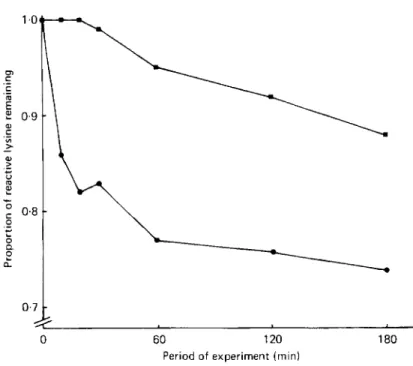
Fig. 2. Proportion of FDNB-reactive lysine remaining in caseinxaffeic acid systems reacted for different
times. ( 0 ) at pH 10; (H) at pH 7 with tyrosinase (EC I . 14.18. I). Each value is the mean of duplicate
determinations. The pooled SEM was 1 . 1 mg/g crude protein (nitrogen x 6.25) corresponding to 0.013 on
the proportion scale; the FDNB-reactive lysine content of the untreated casein was 82.0 mg/g crude
protein. For experimental details, see p. 192.
Reactive Iq’sine in model mixtures
Treatments at different p H levels. The influence of pH on the reaction of lysine with caffeic
acid was investigated using a casein solution (50 g/l) and caffeic acid (0.04 g caffeic acid/g casein) in presence or absence of the polyphenol oxidase, tyrosinase. The solutions were agitated and oxygenated at the selected pH values and, after precipitation and drying, the casein-caffeic acid complexes were analysed for FDNB-reactive lysine. The lysine values (Fig. 1) show clearly that in the presence of tyrosinase the maximum loss of reactive lysine occurred at pH 7. At pH 6.8 and pH 7.5 the loss of reactive lysine was only half that at pH 7.
In the absence of tyrosinase there was little loss of reactive lysine until the pH of the system was increased to 10. At this pH only 0.73 of the original reactive lysine remained. This loss of lysine, however, only occurred in the systems that were stirred and oxygenated. In subsequent investigations on the influence of time, temperature and concentration of caffeic acid on the lysine-caffeic acid reactions, model systems were adjusted to pH 7 in presence of tyrosinase and to pH 10 in its absence.
Treatments for diferent times. Fig. 2 shows the progression of the lysine-caffeic acid reaction with time. At pH 10, the reaction began rapidly and then levelled off; after only 20 min 0.82 of the original reactive lysine remained compared to 0.74 after 3 h. At pH 7 with tyrosinase the reaction was very much slower and from approximately 30 min the level of lysine was gradually decreased until, after 3 h, 0-88 of the original lysine remained.
There appears to be a discrepancy between values given in Fig. 1 and those given in Fig. 2 (and also Table 2). Fig. I shows that, in the presence of tyrosinase, pH 7 promotes the maximum loss of reactive lysine with 0.78 of the original lysine remaining after treatment.
Table 2. The crude protein (nitrogen x 6.25) and lysine content* (mglg crude protein) of casein reacted with diflerent concentrations of cafleic acid or chlorogenic acid for 3 h at room temperaturet (Values in parentheses represent the values of the treated samples as proportions of the corresponding values for untreated casein) Treatment. . . pH 10 pH 7 with tyrosinase FDNB-reactive lysine FDNB-reactive lysine Crude Total Boundf BY Crude Total Boundf BY difference protein lysine lysine difference protein lysine lysine (g/kg) (A) (B) 0-B) Direct (g/kg) (A) (B) (A-B) Direct
5
Caffeic acids
concentration 9' (g caffeic.r:
acid/g casein): 0.0 (control, no 944 82.0 2.0 80.0 82.0 944 82.0 2.0 80.0 82.0a
z
treatment) 0.04 833 62.3 6.7 55.6 (0.70) 59.1 (0.72) 876 77.0 3.4 73.6 (0.92) 72.2 (0.88) 0.1 815 53.3 17.5 35.8 (0.45) 50.0 (0.61) 859 72.2 4. I 68.1 (0.85) 58.5 (0.84) 0, 0.3 637 42.2 19.3 22.9 (0.29) 33.7 (0.41) 735 54.9 6.1 44.8 (0.61) 49.1 (0.60) 0.2 669 49.1 17.9 31.2 (0.39) 40.7 (0.50) 770 61.4 6.2 55.2 (0.69) 53.7 (0.64)2
Chlorogenic acid 6' concentration2
0.4 600 37.2 18.1 19.1 (0.24) 28.7 (0.35) nd nd nd nd nds
(g chlorogenic acid/g casein): 0.08 816 71.1 15.4 55.7 (0.70) 64.5 (0.79) 863 76.5 3.9 72.6 (0.91) 75.3 (0.92) 0.2 778 66.4 14.2 52.2 (0.65) 58.7 (0.72) nd nd nd nd nd FDNB, fluorodinitrobenzene; nd, not determined. * The total lysine SE value was 1.1 mg/g crude protein; the SE for bound lysine was 0.6 mg/g crude protein; the SE for reactive lysine by difference was I .2 mg/g crude t For details, see p. 192. f Bound lysine refers to those lysine units which do not react with FDNB but which are released as lysine on acid-hydrolysis; for further details, see p. 194. protein; the SE for reactive lysine direct was 1.1 mg/g crude protein.200
R.
F.H U R R E L L ,
P.A.
F I N O T A N DJ.
L.C U Q
Table 3. Proportion of FDNB-reactive lysine* remaining in casein-caffeic acid model systems? reacted at different temperatures
Treatment. . .
Temperature (") pH 10 pH 7 with tyrosinase
20 0.76 0.84
40 0.61 0.79
60 0.44 0.87
* FDNB, fluorodinitrobenzene. The SE of reactive lysine values was 1 . 1 mg/g crude protein (nitrogen x 6.25);
t
Each reaction mixture, containing 5 g casein and 0.5 g caffeic acid in 100 ml distilled water at the selectedthe reactive lysine value of the untreated casein was 82 mg/g crude protein.
pH, was stirred with oxygen for 3 h; for further details, see p. 192.
Fig. 2 shows 0.88 of the original reactive lysine remaining after what appears to be an identical treatment. The difference is probably explained by a lower activity of the tyrosinase in the latter experiment (Fig. 2) which was made 18 months after the first experiment with an enzyme which had been stored for that time at - 15'. We have subsequently repeated the pH experiment with a fresh batch of tyrosinase and obtained similar results to those reported in Fig. 1 . Maximum decrease in reactive lysine was confirmed to be at pH 7 with 0.80 of the original lysine remaining. The proportion of reactive lysine remaining at pH 6.5, 6.8, 7.0, 7.2, 7.5 and 8.0 was respectively 0.88, 0.88, 0.80, 0.86, 0.84 and 0.85.
Treatments with diflerent concentrations of caffeic acidand chlorogenic acid. Increasing the concentrations of both caffeic acid and chlorogenic acid resulted in lower crude protein (due to dilution) and lower lysine values per g crude protein in complexes formed under both enzymic and alkaline conditions (Table 2). At pH 10, both total lysine and reactive lysine values were progressively decreased as the concentration of caffeic acid or chlorogenic acid was increased. A considerable portion of those lysine units which failed to react with FDNB to give DNP-lysine was released as lysine on acid-hydrolysis of the FDNB-treated material. We have called these units bound lysine. There was however not good agreement between reactive lysine values obtained by the difference (total lysine minus bound lysine) and the direct methods.
At pH 7 with tyrosinase, total lysine and reactive lysine values were also decreased with increasing concentration of the polyphenolic acids ; however the bound lysine values were lower than at pH 10 and there was good agreement between the two methods of determining reactive lysine. As the molecular weight of chlorogenic acid is approximately twice that of caffeic acid, 0.08 and 0.2 g chlorogenic acid/g casein acid can be compared directly with 0.04 and 0.1 g caffeic acid/g casein. It would appear that chlorogenic acid and caffeic acid react similarly with the lysine units in casein, although the reaction of chlorogenic acid is perhaps slightly slower.
Treatment at different temperatures. As the temperature of the reaction mixtures containing 0. I g caffeic acid/g casein was increased from room temperature ( 2 0 O ) to 40° and 60° so at pH 10 more lysine units became unreactive to FDNB (Table 3). At pH 7 with tyrosinase, the temperature of the reaction mixture had little influence on the loss of reactive lysine.
Animal experiments
The results of the animal experiments are shown in Table 4. The addition of free synthetic caffeic acid or of polymerized caffeic acid to casein at a level of 0.04 g/g did not significantly
Table 4. Protein quality and digestibility values for rats of untreated casein and of casein-caffeic acid mixtures (Values in parentheses represent the values of the treated caseins as proportions of the corresponding value of the control casein) Coefficient of true faecal NPR nitrogen digestibility BV NPU Treatment* Expt 1 2 1 2 1 2 1 2 Casein: untreated 5.00 4.65 0.977 0,950 0.817 0.750 77.5 71.4
z
3- - - - - -+
0.04 caffeic acid 4.68 (0.94) - 0.976 (1.00)+
0.04 caffeic acid 5.07 (1.01) - 0.963 (0.99) polymerized at pH 7 with tyrosinase __ - - - -%
+
0.04 caffeic acid 4.94 (0.99) - 0.960 (0.98) - - - - - Q polymerized at pH 10z
rp 35
Casein<affeic acid (1 : 0.04) :%
2
pH 7 (P29) 4.91 (0.98) - 0.95lt (0.97) - 0.798 (0.98) - 72.8 (0.94) - pH 7+tyrosinase (P30) 4.48t (0.90) - 0.928t (0.95) - 0.791 (0.97) - 71.6 (0.92) - pH 10 (P31) 4.73 (0.95) - 0.946t (0.97) - 0.789 (0.97) - 71.9(0.93) ~ - Caseinxaffeic acid (1 : 0.10): pH 7+
tyrosinase (P32) - 3.79t (0.82) - 0.949 (1.00) - 0.781 (1.04) - 74.1 (1.04) 5' pH 10 (P33) - 3.48t (0.75) - 0.837t (0.88) - 0.752 (1.00) - 63.0 (0.88)2
Pooled SE of treatment means 0.14 0.12 0.007 0.0 13 0.017 0.03 1 1.7 3.6 df 35 15 35 15 20 15 20 15 NPR, net protein ratio; BV, biological value; NPU, net protein utilization. * For details, see p. 193.t
Significantly different (P < 0.05) from corresponding value for untreated casein.202
R.
F. H U R R E L L ,
P.
A.
F I N O T
A N DJ . L.
C U Q
N digestibility values of the casein-affeic acid (1 : 0.04) complexes were also only slightly lower than the corresponding values for casein alone. The casein-affeic acid (1 :0.10) sample prepared at pH 7 with tyrosinase was however significantly ( P < 0.001) reduced in NPR but showed no change in N digestibility, BV or NPU. The casein-caffeic acid (1 : 0.10) sample prepared at pH 10 (P33) was also significantly ( P < 0.001) reduced in NPR (0.74 of its original value) and at the same time had lower digestibility and NPU values. The BV
however was unchanged indicating that the utilization of the absorbed N was not impaired.
Available lysine assays
The results are shown in Table 5 . The lysine potency of the test materials was calculated from the weight gain values presented. Almost identical potency values were obtained from values expressed as weight gain/food eaten which were also calculated.
Considering first of all the casein-caffeic acid ( 1 : 0.04) samples (P29, P30 and P3 1), the rat assay failed to confirm the difference in these samples (especially P3 1) that had been indicated by the FDNB-reactive lysine test. This was not surprising however considering the imprecise nature of animal assays and the relatively small differences found in reactive lysine content. For each sample, the reactive lysine value obtained was within the 95% confidence limits of the rat assay value.
The available lysine values obtained for the casein-affeic acid (1 : 0.10) samples (P36, P37) were much lower than the value obtained for the casein control. Reaction with 0.10g caffeic acid/g casein therefore, either at pH 7 with tyrosinase or at pH 10, appeared to cause a significant decrease in the available lysine content of casein. The rat assay values agreed reasonably well with the FDNB-reactive lysine values, although, for the pH 10 sample in particular (P37), the rat assay value was slightly lower. This could be explained by the lower N digestibility of this sample (Table
4).
Metabolic study
The results of our study using goat's-milk casein labelled with tritiated lysine are shown in Table 6. The rats fed on the casein-caffeic acid mixtures prepared at pH 10 or at pH
7 with tyrosinase excreted considerably more of the ingested radioactivity in the faeces than did the rats fed on the control casein or the casein-caffeic acid mixture prepared at pH 7. Rats fed on the caseinsaffeic acid mixture prepared at pH 10 excreted 0.26 of the ingested activity in the faeces compared to only 0.05 excreted by rats fed on the casein control. There were no differences between the proportion of ingested activity excreted in the urines of rats fed on the different test diets. In addition, when the urine samples were run on the amino acid analyser, before and after acid-hydrolysis, we obtained similar patterns of radioactive urinary metabolites for each test group.
In line with the lower faecal digestibility of lysine in the mixture prepared at pH 10, correspondingly lower levels of radioactivity were found in the liver, kidney, muscle and blood of rats fed on this material. In all test groups 0.7 to 0.8 of the radioactivity present in the body tissues was in the protein-bound form. There were only small differences between the dietary groups in the proportions of radioactivity which were soluble or which were protein-bound.
Reaction of a-formyl- t-[UJ4C]lysine with cafleic acid
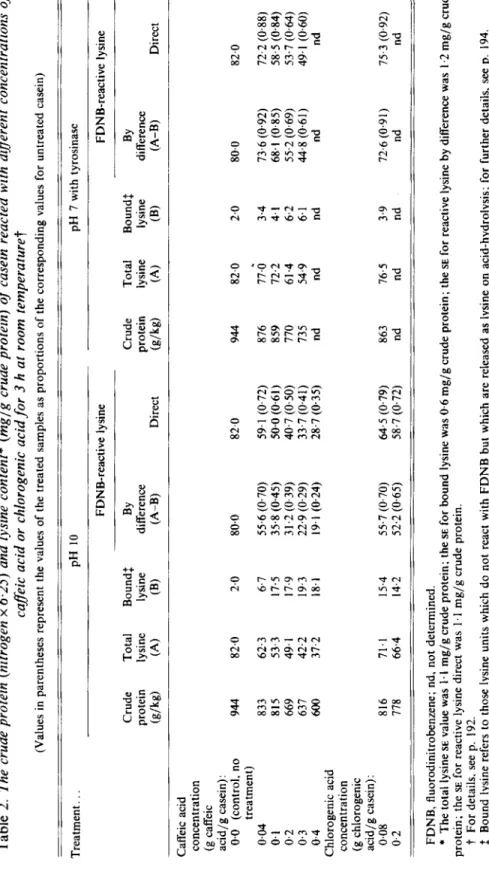
The reaction products formed between radioactive a-formyl lysine and caffeic acid were separated by paper electrophoresis (Fig. 3). No products were formed at pH 7. Likewise at pH 7 plus tyrosinase very little reaction occurred during the first 30 min although after 1 h a small insoluble spot remained at the starting point. At pH 10 however, the reaction was very rapid. After only 1 min 5 reaction products were separated. The reaction products
Table 5. Results from available lysine assays with rats (Values in parentheses represent the lysine value of the caseinxaffeic acid complex as a proportion of corresponding lysine value for casein) Calculated potency of sample (mg lysine/g crude protein (N x 6.25))
2
supplementation 95xconfidence lysine (mg/g%
Test supplement (g/kg) Expt 1 Expt 2 Mean limits crude protein) 5'k
.1"z
5
pH 10 (P31) 14.3; 28.6 7.0; 19.9 - 75 (0.96) 67-84 67 (0.82) 6' Casein+affeic acid : (I : 0.10)E
Level of Wt gain (g) FDNB-reactive Lysine HCI 0; 0.8 -4.8; 4.7 3.1; 12.3 1.6; 2.4 10.6; 18.1 26.0; 33.9 3.2 28.3 45.0 n 3 0 Casein 13.9; 27.8 7.1; 21.0 78 69-86 82 Casein-caffeic acid : 18.9; 40.3 85 77-93-
2
(1 : 0.04) (P29) 13.9; 27.8 8.7; 22.7 - 84 (I .08)* 75-93 81 (0.99) pH 7+tyrosinase (P30) 14.1; 28.2 8.0; 17.7 - 71 (0.91) 63-79 75 (0.91) PH 7 pH 7+tyrosinase (P36) 15.0; 29.9 - 16.1; 31.7 69 (0.81) 61-76 73 (0.89) pH 10 (P37) 15.2; 30.5 - 9.0; 24.7 48 (0.56) 41-55 59 (0.72) FDNB. fluorodinitrobenzene.h, 0 P Table 6. Distribution of radioactivity in rats* 72 h after feeding a test meal containing goat's-milk casein labelled with tritiated lysine or the same material after reaction with cafleic acid? (Values in parentheses represent each value as a proportion of the casein control value) Proportion of injested activity accumulated in: Faeces Urine x per g) of Liver Activity (disintegrations/min Casein Caseinxaffeic acid Casein+affeic acid Caseinxaffeic acid Pooled control PH 7 pH 7
+
tyrosinase pH 10 SEM 0.050 0.036 0.121 0.261 0.004 0.1 16 0.1 14 0.1 16 0.105 0.010 0.49 8.65 (0.71) 12.20 12.09 (0.99) 1 1.26 (0.92) Kidney 10.77 11.11 (1.03j 10.92 ii.oij 7.79 (0.72j 0.43 Muscle 5.65 6.30 ( 1.12) 5.78 (1.02) 4.15 (0.73) 0.25 x lo-' per ml) 5.01 5.49 (1.10) 5.25 (1.05) 3.91 (0.78) 0.16 Blood (disintegrations/min * Mean value for three rats. For each rat, the level of radioactivity was determined in duplicate portions of liver, kidney, muscle and blood. The faecal and urinary t For details of experimental conditions, see p. 195. excretion of radioactivity is calculated as the sum of the radioactivity found in individual collections made every 6 h for 72 h. 4 roProtein-polypheno1
reactions
20 5
p H 7+Tyrosinase pH 10
lysine
0
0 60 1 15 60
Period of experiment (min)
Fig. 3. Diagramatic representation of the autoradiograph of the electrophoretic separation of derivatives
formed between a-formyl-~-[U-~~C]lysine and caffeic acid.
Table 7. The proportion of a-formyl-~-[ U-14C]lysine remaining after reaction with caffeic acidr for different periods of time
Time (min). . . 0 1 5 15 20 30 60 Proportion of unreacted a-formyl-L- [U-14C]lysine at: pH 7
+
tyrosinase 1.00 I .00 1~00 1 .00 1 40 0.99 0.91 pH 10 I.oo
0.91 0.83 0.55 0.50 0.48 0.47* For details, see p. 196.
changed with time becoming more and more acid indicating a polymerization of the caffeic acid molecule. The least acid compound appearing after one minute had completely disappeared after 15 min. There was also a progressive accumulation with time of insoluble radioactivity remaining at the starting point. The proportion of non-transformed or-formyl lysine in each reaction mixture at the different time intervals is shown in Table 7. After 30 min, 0.99 of the a-formyl lysine in the reaction mixture at pH 7 plus tyrosinase remained unreacted; after 60 min 0.9 remained unreacted. At pH 10 the proportion of non-reacted a-formyl lysine fell rapidly to 0.50 during the first 20 min and remained approximately at this level until one hour.
Lysine was regenerated on acid-hydrolysis of the non-migrating fractions collected after electrophoresis of the 4 h reaction mixtures prepared at pH 7 with tyrosinase and at pH 10, and of the migrating derivatives formed at pH 10. The proportion of the reacted lysine in these fractions regenerated as lysine on acid-hydrolysis was 0.40, 0.39 and 0.33 respectively.
206
R.
F.
H U R R E L L ,
P.
A.F I N O T
A N DJ. L. C U Q
D I S C U S S I O N
We have confirmed that polyphenol browning reactions, like Maillard browning reactions, can reduce the biologically-available lysine content of proteins. The nutritional implications of the Maillard reaction, because of its great importance during food processing, have been widely studied (cf. Hurrell, 1980; Hurrell & Carpenter, 1977). Few nutritional studies however have been made on the polyphenol browning reactions. These reactions include enzymic browning and protein-polyphenol reactions under alkaline conditions. Both reactions are 0, dependent and could be of importance during the preparation of vegetable-protein concentrates.
From our total amino acid values (Table I ) , lysine and tryptophan were the only amino acids severely decreased by the reaction of casein with oxidized caffeic acid. In a further unpublished experiment in which the level of tryptophan was measured in similary-treated caseinxaffeic acid (1 : 0.3) mixtures using six different analytical techniques, losses of
tryptophan were recorded which depending on the analytical method used, varied from 0.14
to 0.58 (mean 0-33) for the mixture at pH 10 and from 0-07 to 0-65 (mean 0.37) for the mixture at pH 7 plus tyrosinase. There is clearly a problem associated with the analysis of tryptophan in such materials. The possible reaction of tryptophan will be discussed in a subsequent publication as will the possible oxidation of methionine, cysteine and tryptophan residues.
Pierpoint (1969 a, b) has reported that the primary covalent reactions of enzymically-
generated chlorogenoquinone and caffeoquinone are likely to involve only the thiol group of cysteine, terminal a-amino groups and e-amino groups of lysine. He reported that tryptophan, arginine, histidine and peptide-N appeared not to react. No loss of total cyst(e)ine was found in our samples after previous performic acid oxidation; however it is of course possible that acid-hydrolysis had regenerated cysteine from the cysteine- caffeoquinone complexes. Casein has a very low cyst(e)ine content and is not the ideal protein with which to investigate cysteine-caffeoquinone reactions.
There was a slight decrease in tyrosine in acid-hydrolysates of the enzymically-treated mixtures. This is perhaps not unexpected when using a tyrosinase enzyme. Although o-diphenols are the most abundant substrate for the phenolase enzymes, monophenols such as tyrosine can also act as phenolase substrates (cf. Mason, 1955), as can flavonoids and tannins (the latter being of special importance during the desired browning reactions occurring during tea fermentation, maturation of dates or the curing of cocoa). Monophenols react more slowly than o-diphenols as they are first hydroxylated before being oxidized to the corresponding quinone. The quinone from tyrosine would presumably readily combine with caffeoquinone and could possibly also combine with lysine, cysteine or oxidized tyrosine residues from adjacent protein chains.
Turning to the chemical analysis of lysine (Table 2), it is evident that caffeoquinone and chlorogenoquinone have reacted similarly with the lysine residues of casein. It is also clear from the present experiments with a-formyl lysine that only a part (0.3-0.4) of the lysine
residues involved in the lysine-quinone complex are released as lysine on acid-hydrolysis. Because of this partial release, also reported by Cranwell & Haworth (1971), total lysine values fall to a lesser extent than reactive lysine values. This finding is analogous to the behaviour of lactulosyl-lysine, the early Maillard compound, on acid-hydrolysis (Finot & Mauron, 1972).
Another interesting result, which indicates perhaps that the reaction products of lysine with alkali-generated or enzymically-generated quinones are different, concerns the amount of lysine regenerated (bound lysine) on acid-hydrolysis of the dinitrophenylated casein- quinone complexes. After reaction with FDNB and then acid-hydrolysis, much more lysine
208
R.F.
H U R R E L L ,
P.
A. F I N O T
A N DJ. L. C U Q
was released from the alkali-prepared samples than from those produced enzymically. This finding is difficult to explain. For the alkali-prepared samples it is possible either, that some lysine-quinone compounds combine with FDNB and liberate DNP-lysine on acid- hydrolysis, or that some lysine units are released as lysine on acid-hydrolysis of the dinitrophenylated casein-quinone complex which are not released as lysine on acid- hydrolysis of the non FDNB-treated material. This last hypothesis is very unlikely.
Some possible reactions of protein-bound lysine with caffeic acid are shown in Fig. 4. The first step is the conversion of the polyphenolic acid to the corresponding quinone. This can proceed under enzymic or alkaline conditions. A semiquinone radical could also conceivably arise from enzymic or chemical oxidation, or from the quinone. The subsequent reactions of quinones (or semi-quinones) with lysine are non-enzymic covalent reactions. The proposed scheme takes into consideration our findings : (1) that the lysine-caffeoquinone complexes formed under alkaline conditions (pH 10) and enzymic conditions (pH 7) are probably different, (2) that each bound lysine unit appears to be associated with several
quinone units. This is indicated by our electrophoretic studies with a-formyl lysine and by our finding (Table 2 ) that most of the polymerized caffeoquinone is precipitated within the caseinxaffeoquinone complex. If the differences in the crude protein content of casein and of the casein-affeic acid complexes are used as an indication of the amount of caffeic acid incorporated into the complex, then on average between 4 and 9 mol caffeic acid have been incorporated for each mol lysine rendered unreactive to FDNB.
We have proposed two pathways. Pathway 1 occurs under both neutral and alkaline conditions and, by this route, lysine is first substituted into the quinone ring. Pierpoint ( 1 7 5 9 ~ ) has suggested that the primary point of substitution of lysine is most probably in the 6 position, although under certain conditions substitutions in the 5 position have also been reported. (This type of linkage would not be expected to release lysine on acid-hydrolysis.) The most likely route is then one which leads to complexes between lysine and polymerized caffeoquinone. Crosslinkages could also be formed if further lysine units from an adjacent protein chain substitute into the 2 position of the quinone ring. This is
less probable, however, since we found only small reductions in N digestibility in rat trials (Table
4).
Pathway 2 occurs under alkaline conditions only. In this pathway, lysine groups react
reversibly with the quinone group itself to form quinonimines (cf. Cheftel, 1979). This group is a type of Schiff’s base and would theoretically be acid-hydrolysable and may also react with FDNB to give DNP-lysine on acid-hydrolysis. As in pathway 1, further reactions lead to complexes between lysine and polymerized quinones. Crosslinkages are also possible. In Fig. 4 we have shown only two types of linkage, however, as there are five possible positions for lysine to combine with the quinone, there are many different combinations of lysine-quinone crosslinkage (cf. Davies & Frahn, 1977).
It is clear that the reaction conditions greatly influence the extent of lysine damage in protein-polyphenolic acid mixtures. Time of reaction, temperature, pH, oxygenation and concentration of phenolic acids all influenced the subsequent loss of lysine. In the absence of tyrosinase, there appears to be little loss of reactive lysine below pH 8. At pH 10 however, the formation of quinone and its subsequent reaction with lysine is rapid, the major part of the loss in reactive lysine occurring in the first 30 min at room temperature. These losses were greater with increased temperature and with increased phenolic acid concentration but they occurred only in systems that were agitated and oxygenated. Under enzymic conditions, there appears to be a sharp pH optimum for the reaction, with maximum losses occurring at pH 7. The reaction however was very much slower than at pH 10, most likely due to a much slower oxidation of caffeic acid, with only minimal losses of lysine during the first hour. Clearly, during the preparation of protein concentrates from vegetable
Protein-polyphenol reactions
209
materials such as sunflower and leaf protein, which contain significant quantities of phenolic acids, it could seem wise to avoid alkaline treatments. Although phenolase enzymes are naturally present in such materials, there seems less danger, however, that enzymic browning reactions will cause substantial losses of lysine especially if the pH of the system is adjusted to between 8 or 9 or to below 6.Our rat studies(Tab1e 5), indicate that lysine units which havecombined with caffeoquinone are unavailable to the rat as a source of lysine. Rat lysine values agreed reasonably well with FDNB-reactive lysine values. The lower rat available lysine value for sample P37 could be explained by a reduced N digestibility in this sample. It would appear from our metabolic studies (Table 6) that the lysinexaffeoquinone reaction products, formed after 3 h reaction with alkali or enzymically-generated quinone, are not absorbed by the rat but are excreted directly in the faeces. We did not investigate the metabolic fate of the early lysine-quinone reaction products formed during the first 30 min at pH 10.
Other rat studies (Table 4) showed that caffeic acid itself, added to the diet at the level
0.04 g/g casein, had little influence on the NPR or faecal digestibility of casein. Eklund (1 975) has reported similar findings for chlorogenic acid. Polymerized caffeic acid similarly had no influence on the NPR and N digestibility values of casein. It had been thought that a polymerized polyphenolic acid may behave like a tannin, also a polymerized polyphenolic compound, and reduce protein digestibility. Eggum & Christensen (1975) have shown that tannic acid added to the diet at a comparable level significantly reduced the N digestibility of soya-bean protein. Apart from a fall in available lysine and a reduction in NPR in two samples (P32 and P33), our treatments had little influence on the other protein-quality values of casein. BV was unaffected indicating that there was no reduction in the biological utilization of the limiting amino acid of casein (methionine
+
cystine) and that no other amino acid had been sufficiently damaged so as to become limiting. The largest fall in protein digestibility was only 0.12 for sample P33 (casein-caffeic acid (1 :0-1, pH 10)). From these results one could presume that the reaction of proteins with the quinones formed from polyphenolic acids results in few cross-link formations and that these reactions are not responsible for the low protein digestibilities reported in leaf protein concentrates (Henry & Ford, 1965). This phenomenon is more likely due to the reaction of leaf proteins with polyunsaturated lipids during drying and storage (Buchanan, 1969).It is difficult to explain the low NPR values for samples P32 and P33 (casein-caffeic acid
(1 : 0.10) complexes prepared enzymically and with alkali respectively). Part of the reduction in NPR for sample P33 can be accounted for by its lower N digestibility; the rats consuming this complex also ate on average 0.12 less food than the rats consuming the casein control diet. Sample P32 however was not reduced in N digestibility and rats fed on this material consumed as much food as those consuming the casein control diet. The NPR test was made on younger rats (1-1 1 d after weaning) than in the subsequent NPU test (1 1-16 d after weaning). It is also possible that these treated proteins contained some anti-physiological substances or that the body composition of the rats fed on the treated proteins contained less fat than those fed on casein.
Horigome & Kandatsu (1968) studied a similar model system to ours but under enzymic conditions only. It contained 0.059 casein in phosphate buffer at pH 6.5 and caffeic acid at 0.036 the weight of casein. Their o-diphenol oxidase was extracted from plant materials and the mixture with casein was stirred for 4 h at 25-30'. Like us, they found only small losses in N digestibility (0.04) and FDNB-reactive lysine (0.13) in the resulting complex but they also reported a 0.1 loss in BV. This difference is probably due to their drying the caseinxaffeoquinone complexes at 60' instead of freezedrying them as we did. Henry & Ford (1 965) have reported that oven-drying leaf-protein concentrates at 100' reduced their
210
R. F. H U R R E L L ,
P.
A.
F I N O T
A N DJ . L. C U Q
It can be concluded that during alkali extraction of proteins from vegetable sources, caffeoquinone and chlorogenoquinone, formed on oxidation of the corresponding phenolic acids, can react with lysine residues in the protein to make them biologically unavailable. It is highly likely that the discoloured sunflower-protein concentrates produced at alkaline pH (Pomenta & Burns, 197 1 ; Cater et al. 1972) also have a decreased available lysine content due to the reaction of sunflower protein with chlorogenoquinone and other oxidized phenols. The conversion of phenolic acids to quinones can also occur enzymically under the action of naturally-occurring phenolase enzymes at neutral pH and these quinones appear to react with lysine in a similar manner. The enzymic reactions are however much less rapid than those occurring under alkaline conditions and would probably have less influence on the nutritional quality of the protein concentrates.
The authors thank M r R. Deutsch, Miss E. Magnenat, Miss L. Piguet and Mrs G. Guignard for technical assistance, and Dr R. Jost and D r D. N. Salter for preparation of the goat’s-milk casein labelled with tritiated lysine.
R E F E R E N C E S
Allison, R. M., Laird. W. M . & Synge, R. L. M. (1973). Br. J . Nutr. 29. 51.
Bau, H. M. & Debry, G. (1980). J . Fd Techn. 15, 207.
Bender, A. E. & Doell, B. H. (1957). Br. J . Nutr. 11, 140.
Biserte, G.. Plaquet-Schoonhaert, T., Boulanger, P. & Paysant, P. (1960). J . Chromai. 3, 25.
Booth. V. H. (1971). J . Sci. Fd Agric. 22, 658.
Bosshard, H. (1972). Helv. Chim. Actu 55, 32.
Buchanan, R. A. (1969). J . Sci. Fd Agric. 20. 359. Carpenter, K. J. (1960). Biochem. J . 77, 604.
Cater, C. M., Gheyasuddin, S . & Mattil, K. F. (1972). Cereal Chem. 49, 508.
Cheftel, J. C. (1979). In Nutritional and Safely Aspects of Food Processing, p. 153 [S. R. Tannenbaum, editor].
Cranwell, P. A. & Haworth, R. D. (1971). Tetrahedron 27, 1831.
Davies, A. M. C., Newby, V. K. & Synge, R. L. M. (1978). J. Sci. Fd Agric. 29, 33.
Davies, R. & Frahn, J. L. (1977). J . Chem. SOC. (Perkins Transactions I), 2295.
Eggum, B. 0. & Christensen. K. D. (1975). Breeding for Seed Protein Improvement using Nuclear Techniques,
Eklund, A. (1975). Nutr. Metab. 18, 259.
Finney, D. J. (1964). Staristical Methods in Biological Assay, 2nd ed. New York: Hafner Publishing Co.
Finot, P. A. & Mauron, J. (1972). Helv. chim. Actu 55, 1153.
Ford, J. E. & Hewitt, D. (1979). Br. J . Nutr. 42, 325.
Free, B. L. & Satterlee, L. D. (1975). J . Fd Sci. 40, 85.
Hawk, P. B. & Oser, B. L. (1931). Science, N . Y . 74, 369.
Henry, K. M. & Ford, J. E. (1965). J . Sci. Fd Agric. 16, 425.
Hofmann. K., Stutz, E., Sphiiler, G . . Yajima, H. & Schwartz, E. T. (1960). J . Am. Chem. Soc. 82, 3727.
Horigome, T. & Kandatsu, M. (1968). Agric. B i d . Chem. 32, 1093.
Hughes, R. E. ( 1 978). J . Human Nutr. 32, 47.
Hurrell, R . F. (1980). I n Food and Health-Science and Technology, p. 369 [G. G . Birch and K. J. Parker, editors].
Hurrell, R. F. & Carpenter, K. J. (1974). Br. J . Nutr. 32. 589.
Hurrell, R. F. & Carpenter, K . J. ( 1 977). I n Physical, Chemicul and Biological Changes in Food caused by Thermal
Joslyn. M. A. & Ponting, J. D. (1951). Adv. Fd Res. 3, I .
Kuhnau. J. (1976). Wld Rev. Nuir. Diet. 24, 117.
Magd, J. A. (1978). Crit. Rev. Fd Sci. Nuir. 10, 323.
Mason, H. S. (1955). Adv. Enzym. 16, 105.
Mauron, J. & Mottu, F. (1958). Archs Biochem. Biophys. 77, 312.
Mauron, J., Mottu, F. & Egli, R. H. (1960). Annls Nuir. Aliment. 14, 135.
Milic, B., Stojanovic, S., Vucurevic, N. & Turcic. M. (1968). J. Sci. Fd Agric. 19, 108.
Mitchell, H. H. (19234). J . biol. Chem. 58. 873.
Monties, B. & Rambourg, J. C. (1978). Ann. Technol. Agric. 27, 629.
Moore, S. (1963). J . biol. Chem. 238, 235.
Mottu, F. & Mauron, J. (1967). J . Sci. Fd Agric. 18, 57.
New-York: Marcel Dekker, Inc.
p. 135. Vienna: International Atomic Energy Agency.
London: Applied Science.
Protein-polyphenol reactions 21 1
Newby, V. K., Sablon, R. M., Synge, R. L. M., Casteele, K. V. & Van Sumere, C. F. (1980). Phytochemistry
Pierpoint, W. S. (1969~). Biochem. J. 112, 609.
Pierpoint, W. S . (19696). Biochem. J. 112, 619.
Pierpoint, W. S. (1971). Rep. Rothamsted exp. Stn., part 2, p. 199.
Pirie, N. W. (1975). In Protein Nutritional Quality ofFoods undFeeds, part 2. p. 341 [M. Friedmann, editor]. New
Pomenta, J. V. & Burns, E. E. (1971). J. Fd Sci. 36, 490.
Roach, A. G., Sanderson, P. & Williams, D. R. (1967). J. Sci. Fd Agric. 18, 274.
Robertson, J. A. (1975). Crit. Rev. Fd Sci. Nutr. 6 , 201.
Sabir, M. A,, Sosulski, F. W. & Kernan, J. A. (1974). J . Agric. Fd Chem. 22, 572.
Scharff, R. & Wool, I. G. (1964). Nature, Lond. 202, 604.
Singleton, V. L. & Kratzer, F. H. (1969). J. Agric. Fd Chem. 17, 497.
Sodini, G. & Canella, M. (1977). J. Agric. Fd Chem. 25, 822.
Spies, J. R. & Chambers, D. C. (1949). Analyt. Chem. 21, 1249.
Synge, R. L. M. (1975). Qualitas PI. Muter. Veg. 24, 337.
Vithayathil, P. J. & Murphy, G. S. (1972). Narure, New Biol. 236, 101.
19, 651.
York: Marcel Dekker.


![Fig. 3. Diagramatic representation of the autoradiograph of the electrophoretic separation of derivatives formed between a-formyl-~-[U-~~C]lysine and caffeic acid](https://thumb-eu.123doks.com/thumbv2/123doknet/14889770.648666/15.729.167.556.83.459/diagramatic-representation-autoradiograph-electrophoretic-separation-derivatives-formed-caffeic.webp)