Whole grain intakes in the diets of Irish children and teenagers
Niamh F. C. Devlin
1, Breige A. McNulty
1, Michael J. Gibney
1, Frank Thielecke
2,
Hayley Smith
2and Anne P. Nugent
1*
1UCD Institute of Food and Health, University College Dublin, Dublin 4, Republic of Ireland 2Cereal Partners Worldwide, Lausanne, Switzerland
(Submitted 6 July 2012 – Final revision received 1 October 2012 – Accepted 5 October 2012 – First published online 11 December 2012)
Abstract
A growing body of evidence supports the inclusion of whole grain foods in the diet to help prevent certain chronic diseases. Although much of the research has been conducted in adult cohorts, it is thought that younger populations may also benefit from whole-grain-rich diets. The aim of the present study was to quantify the intake of whole grain in Irish children and teenagers, and assess the major sources of intake. Data used in the present study were from the National Children’s Food Survey and the National Teens’ Food Survey, which used 7 d food diaries to collect data on habitual food and beverage consumption in representative samples of Irish children and teenagers. Results showed that over 90 % of children (5 – 12 years) and over 86 % of teenagers (13 – 17 years) are consumers of whole grain, with mean daily intakes of 18·5 and 23·2 g/d, respectively. Ready-to-eat breakfast cereals made the greatest contribution to whole grain intakes for both children and teenagers (59·3 and 44·3 %), followed by bread (14·4 and 26·5 %), with wheat being the major source of intake, accounting for over 65 % of all whole grains consumed. Whole grain consumers had significantly higher intakes of fibre, P and Mg in comparison with non-consumers of whole grain, even though whole grain intakes in this sample were well below the recommendation of three servings or 48 g/d. The present study characterises, for the first time, the patterns of whole grain consumption in Irish children and teenagers and shows whole grain intake to be low.
Key words:Whole grain intakes: Children: Teenagers: Ireland: Intake patterns
The inclusion of whole-grain-rich foods in the daily diet is widely promoted, with epidemiological studies showing regu-lar consumption of whole grain foods (three servings or 48 g/d) to be associated with a reduced risk of CVD, diabetes(1 – 3), certain cancers(4)and obesity(5). A number of randomised con-troled trials have also produced encouraging results, with increasing intakes favourably influencing LDL-cholesterol, systolic blood pressure, insulin and C-reactive protein(6 – 8).
However, much of the current research has concentrated on the adult population, with few studies considering the effects of whole grain consumption in younger age groups(9,10).
Whole grains have been defined by the American Associ-ation of Cereal Chemists(11) as consisting of ‘the intact, ground, cracked or flaked caryopsis whose principal anatom-ical components (the endosperm, germ and bran) are present in the same relative proportions as they exist in the intact car-yopsis’. However, the definition of what qualifies as a whole grain food is widely debated, and has resulted in a variety of health and content claims. One such health claim, in relation to heart disease and certain cancers, defines whole grain foods as those containing 51 % or more whole grain
ingredients(12). In comparison, to use a whole grain stamp on food packaging in Canada and the USA, the food must con-tain at least 8 g of whole grain ingredients per serving(13). Few
official government regulations define how much whole grain must be in a product to be deemed a whole grain food. As a result, studies assessing population whole grain intakes have differed in their criterion as to what qualifies as a whole grain food, with some studies including all foods containing a source of whole grain(14), while others only include foods made with a certain amount of whole grain(15).
Dietary recommendations for daily whole grain intakes have been proposed, with suggested intakes ranging from 48 g in the USA and Australia(16,17), to 75 g in Sweden and Denmark(18), to 115 g in the Netherlands(19); however, the UK(20)
and Germany(21) have a more vague approach, and suggest that ‘cereal products such as bread, pasta, rice and grain should preferably be whole grain’. Despite these recommen-dations, present intakes of whole grain in adults remain low, with research showing daily intakes in the USA(22) and UK(23)
to be 11 and 23 g, respectively. Intakes of whole grain in chil-dren and teenagers are also reported to be low, with daily
* Corresponding author: A. P. Nugent, email anne.nugent@ucd.ie
Abbreviations: NCFS, National Children’s Food Survey; NTFS, National Teens’ Food Survey; RTEBC, ready-to-eat breakfast cereal. qThe Authors 2012
British
Journal
of
intakes of 9·8, 13 and 26·4 g in the USA(24), UK(15) and Germany(14), respectively, and just 5 and 8 % of children
and teenagers are meeting recommendations in Denmark(18) and France(25), respectively.
To date, there is no information on patterns of whole grain consumption in the Irish population, and so the aim of the pre-sent study was to quantify the intake of whole grains in the diets of Irish children and teenagers, and to assess the major sources of intake across age groups and mealtimes using data from the National Children’s Food Survey (NCFS) and the National Teens’ Food Survey (NTFS).
Methodology
National Children’s Food Survey and National Teens’ Food Survey
The NCFS and the NTFS were cross-sectional surveys con-ducted in representative samples of Irish children and teen-agers between 2003 – 4 and 2005 – 6, respectively (Irish Universities Nutrition Alliance; IUNA, http://www.iuna.net). These studies were conducted according to the guidelines laid down in the Declaration of Helsinki, and all procedures involving human subjects/patients were approved by the St James’s Hospital and Federated Dublin Voluntary Hospitals Joint Research Ethics Committee (NCFS) and the University College Cork Clinical Research Ethics Committee of the Cork Teaching Hospitals (NTFS). Written informed consent was obtained from all participants and their parents as appropriate. In total, 1035 participants took part (594 children: 293 boys, 301 girls and 441 teenagers: 224 males, 217 females). The age of the children was in the range from 5 to 12 years and that of the teenagers from 13 to 17 years. The overall response rate was 66 % for the NCFS and 63 % for the NTFS. The samples were representative of both population groups with respect to sex, age, location and social class, as per the most recent Irish census(26). More detailed information about the population groups can be found at http://www.iuna.net
Data collection
Food and beverage intake was determined using a 7 d weighed food diary for the NCFS and a 7 d semi-weighed food diary for the NTFS. Detailed information was recorded regarding the amount and types of all foods and beverages consumed over the seven consecutive survey days (at brand level where poss-ible). Food and beverage intakes were assessed using WISP ver-sion 3.0 (Tinuviel Software), which uses data from the McCance and Widdowson’s ‘The Composition of Foods’ fifth and sixth edi-tions(27,28), plus supplemental volumes(29 – 37). Food package
labelling was also used to assess food and beverage intakes where necessary. Each food and beverage was allocated an individual food code and subsequently assigned to one of sixty-eight food groups for ease of analysis, e.g. savoury snacks and ready-to-eat breakfast cereals (RTEBC).
In addition to comprehensive dietary information, detailed data on socio-economic level and lifestyle were also collected. Full study details, including quantification methods used, are described by Joyce et al.(38).
The National Food and Ingredient database
During the NCFS and the NTFS, food packaging of the con-sumed foods and beverages were collected and used to record information about the products. The information gath-ered created the Irish National Food and Ingredient Data-base(39). General information recorded included brand name,
product description, portion weight, country of origin and man-ufacturers’ details. In addition, ingredient listings and nutritional information per 100 g of product were recorded. Where poss-ible, foods were recorded at brand level and allocated an indi-vidual brand ID that could be linked back to actual consumption patterns.
Calculation of whole grain intakes
The NCFS and the NTFS databases were initially searched to identify potential foods made with whole grain. From the sixty-eight original food groups, fourteen were identified as containing whole grain.
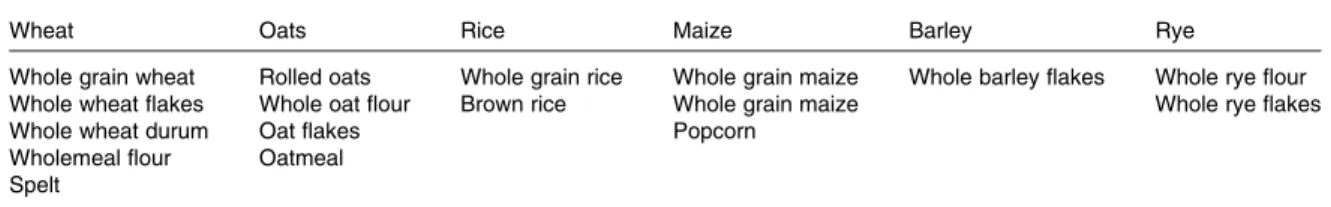
All foods within each of these fourteen food groups were then checked for the presence of whole grain and a new whole grain database was created. All foods made with whole grain ingredi-ents were included in the present study. The grains included in the present study were grouped into one of six groups: wheat, oats, rice, maize, barley and rye (Table 1).
The amount of whole grain in each product per 100 g was recorded in the database. As the NCFS and the NTFS collected information at brand level where possible, values for whole grain could be ascribed at a brand-specific level. These values were obtained either from the food package labelling (Irish National Food and Ingredient Database) using quantitat-ive ingredient declaration percentages or directly from the manufacturer. Where brand-specific data were not available, the whole grain content of a comparable product was used (if the ingredient list of a known whole grain product was identical to that of an unknown product); an average of similar products was used where such detail was lacking. A recipe database previously created from the NCFS and the NTFS
Table 1. Whole grains and the classifications considered in the present study divided into one of six whole grain groups
Wheat Oats Rice Maize Barley Rye
Whole grain wheat Rolled oats Whole grain rice Whole grain maize Whole barley flakes Whole rye flour Whole wheat flakes Whole oat flour Brown rice Whole grain maize Whole rye flakes
Whole wheat durum Oat flakes Popcorn
Wholemeal flour Oatmeal Spelt
British
Journal
of
was also used where appropriate, taking water losses from cooking and processing into account. The whole grain values collected per 100 g of product were then used to calcu-late the actual amounts of whole grain consumed.
For ease of analysis, the original sixty-eight food groups were reduced to ten food groups, one of which was a whole grain food group. This whole grain food group was subsequently broken down into the following seven sub-groups: (1) rice, pasta and their dishes; (2) breads and rolls; (3) RTEBC; (4) other breakfast cereals (including porridge and cooked breakfast cereals); (5) sweet biscuits, cereal bars and desserts; (6) savoury biscuits, crackers and popcorn; and (7) meat products, tofu and yoghurts.
Statistical analysis
Statistical analyses were carried out using PASW Statistics version 18.0 (SPSS, Inc.). The mean and standard deviations for whole grain consumed according to sex, age group, social class, eating location and day of the week were calculated for both the total population and consumers only. Differences within the groups were detected using independent t tests or by one-way ANOVA as appropriate. Independent samples t tests were also used to test for significant differences in mean daily intakes of macro- and micronutrients for consumers and non-consumers of whole grain. In addition, the percentage contribution of each whole grain food group was analysed and the type of grains consumed were identified. Tertile analysis was also carried out in relation to whole grain intakes and values were adjusted for age and sex using ANCOVA. The Bonferroni post hoc test was used to identify the significant differences between each of the groups.
Further analysis was carried out to determine the proportion of Irish children and teenagers meeting whole grain recommen-dations set out by the United States Department of Agriculture. The data were assessed using both the recommendation of three servings (or 48 g)/d(16) and using recommendations accounting for differences in energy intake(16,40). For both methods, two approaches were used to assess adherence. First, the percentage of individuals in a population who met the dietary target for whole grain for the total population was calculated and referred to as ‘approach 1’. However, population goals relate to the recommended mean intake of a population and it is not necessary for all individuals to achieve this intake. Compliance was also, therefore, estimated by the method of Wearne & Day(41)and referred to as ‘approach 2’. This approach calculated the maximum size of a subgroup of the population, known as compliers, whose mean intake equals the population dietary recommendation. To calculate the percentage of compliers meeting the recommendation, mean daily whole grain intakes of each individual were ranked in descending order from the highest to the lowest. The mean intake of the group was calculated. The individual with the lowest mean intake of whole grain was then removed and the calculation repeated. This procedure continued until the mean result of the group was $ 48 g. The percentage of chil-dren and teenagers achieving the whole grain recommendation was then calculated.
Results
Whole grain intake
Tables 2 and 3 present the mean daily intakes of whole grain (g/d) for all children and teenagers. The data are described for sex, age group, social class, eating location and day of the week, for both the total population and whole grain consumers only. Overall, 90·5 % of children and 86·6 % of teenagers were con-sumers of whole grain. Mean daily intakes were 18·5 and 23·2 g/d for children and teenagers, respectively, in the total population, rising to 20·5 g/d (children) and 26·9 g/d (teen-agers) in consumers only. In both age groups, males con-sumed significantly higher amounts of whole grain than females (22·0 g/d in children and 28·6 g/d in teenagers v. 15·1 g/d in children and 17·7 g/d in teenagers). Intakes of whole grain also tended to increase with age, although this was only significant for teenagers, with values in ‘consumers only’ increasing from 23·1 g/d (13 – 14 years) to 29·9 g/d (15 – 17 years). The home was the primary location for whole grain consumption (P, 0·001), with minimal amounts eaten at other homes (e.g. home of friends, relatives and child minders) and outside of the home (e.g. restaurants). There was no significant difference between whole grain con-sumption at weekends in comparison to weekdays.
Sources of whole grain intake
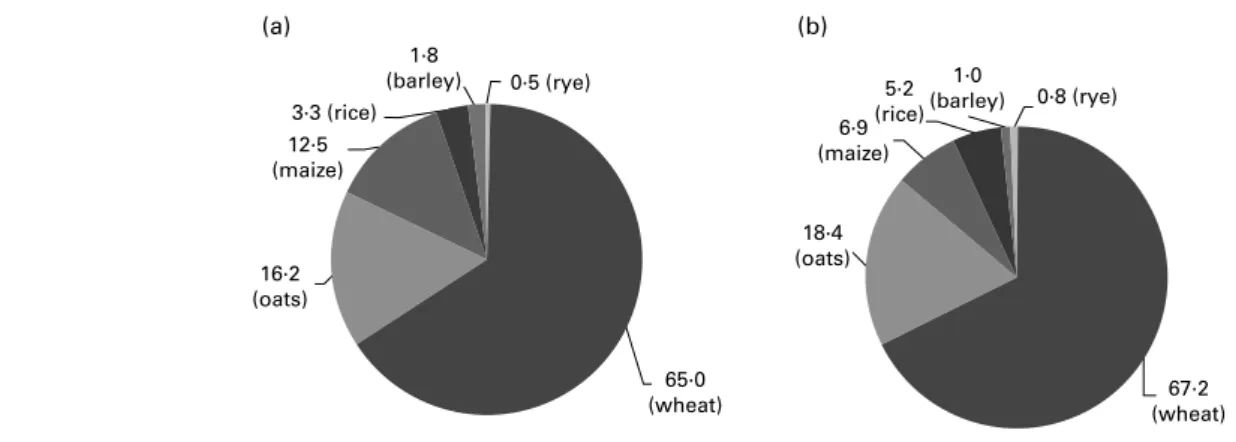
For both children and teenagers, wheat was the major grain con-tributing to whole grain intake, providing 65 and 67 % of whole grain intakes, respectively. Oats were the second highest contri-butor (16·2 and 18·4 %, respectively), with maize, rice, barley and rye providing lesser amounts of whole grain to the diet (Fig. 1). Mean daily whole grain intakes (g/d) and the percentage contribution (%) of the seven whole grain food groups to total whole grain intake are presented for whole grain consu-mers and across tertiles of intake in Table 4. For both children and teenagers, the main food group contributor to whole grain intakes was the RTEBC group (59·3 and 44·3 %, ively), followed by bread and rolls (14·4 and 26·5 %, respect-ively). Across the tertiles of intake, those in the highest tertile had significantly greater intakes of the food groups: ‘RTEBC’; ‘bread and rolls’; ‘savoury biscuits, crackers and pop-corn’; and ‘other breakfast cereals’, in comparison to those children and teenagers in the lowest tertile.
As expected, for both children and teenagers, the majority of whole grain was consumed at breakfast (62·4 and 54·0 %), with more than 75 % of whole grain eaten at this meal coming from RTEBC. The next most popular time to consume whole grain foods was as a snack, followed by lunch and dinner. This was evident for both children and teenagers. For children, the most popular whole grain food consumed as a snack was ‘savoury biscuits, crackers and popcorn’ (48 %), while ‘bread and rolls’ (33 %) was the most popular choice for teenagers. ‘Bread and rolls’ was also the main contributor to whole grain intakes at lunch for both children (54 %) and teenagers (79 %), while the ‘rice, pasta and their dishes’ food group was the main contributor at dinner (37 and 74·3 % for children and teenagers, respectively) (data not shown).
British
Journal
of
Whole grain intakes and dietary recommendations The percentage of Irish children and teenagers meeting whole grain recommendations(16) using both ‘approach 1’ and ‘approach 2’, are presented in Table 5. Using approach 1, which assesses individual compliance with the
recommen-dations, over 5 % of children and almost 15 % of teenagers were meeting the whole grain recommendation of three ser-vings (48 g)/d, while those meeting recommendations based on energy intake were 7·7 % for children and 12 % for teen-agers. Using approach 2, which focuses on the proportion
Table 3. Descriptive analysis of whole grain intake (g/d) for Irish teenagers (total population and consumers only) (Mean values, medians and standard deviations; number of children and percentages)
Teenagers
Total population (n 441) Consumers only (n 382; 86·6 %)
n % Mean Median SD P97·5 P n % Mean Median SD P97·5 P
Total population 441 100 23·2 13·4 29·5 97·9 382 86·6 26·9 18·1 30·2 105·5 Sex *** *** Male 224 50·7 28·6 19·3 35·0 130·7 196 87·5 32·7 23·6 35·6 137·1 Female 217 49·2 17·7 10·5 21·3 89·1 186 85·7 20·7 12·8 21·7 92·9 Age * * Age group 1† 188 42·6 19·6 11·2 22·9 87·3 161 85·6 23·1 15·6 23·2 92·1 Age group 2† 253 57·3 25·9 14·8 33·4 122·1 221 87·4 29·9 19·1 34·4 131·2 Social class * * Professional/managerial 214 49·9 26·5a 17·8 32·4 96·5 192 89·7 29·6a 20·5 32·9 104·8
Non-manual 79 18·4 23·1a,b 9·9 31·9 118·5 67 84·8 27·3a,b 15·5 33·0 125·7
Skilled manual 85 19·8 20·6a,b 10·7 24·2 88·9 73 85·9 24·1a,b 13·4 24·5 97·5
Semi-skilled þ unskilled 51 11·8 11·8b 4·3 15·6 67·0 40 78·4 15·1b 9·7 16·2 74·4 Eating location *** *** Home 441 100 21·5a 10·6 29·4 95·4 365 82·8 25·9a 15·9 30·5 104·4 Other home 192 43·5 0·9b 0 2·8 10·3 41 21·4 4·4b 3·1 4·6 19·2 Outside home 421 95·4 1·6b 0 3·9 14·9 124 29·5 5·5b 3·3 5·6 21·9 Day of week NS NS Weekday 441 100 24·6 14·0 32·5 117·2 364 82·5 29·9 19·6 33·5 122·9 Weekend 441 100 20·5 7·7 31·9 116·0 277 62·8 32·6 21·8 35·0 130·9
a,bMean values with unlike superscript letters denote significant differences between mean daily intakes of whole grain (ANOVA with Bonferroni correction).
Mean values were significantly different: * P, 0·05, ** P, 0·01, *** P, 0·001, NS (P$ 0·05). † Age group 1: 13 – 14 years; age group 2: 15 – 17 years.
Table 2. Descriptive analysis of whole grain intake (g/d) for Irish children (total population and consumers only) (Mean values, medians and standard deviations; number of children and percentages)
Children
Total population (n 594) Consumers only (n 538; 90·5 %)
n % Mean Median SD P97·5 P n % Mean Median SD P97·5 P
Total population 594 100 18·5 12·7 18·2 68·5 538 90·5 20·5 14·7 18·0 68·9 Sex *** *** Male 293 49·3 22·0 15·6 21·5 72·7 259 88·4 24·9 19·2 21·1 75·2 Female 301 50·6 15·1 11·6 13·5 49·3 279 92·7 16·4 12·4 13·2 49·4 Age NS NS Age group 1† 296 49·8 17·5 12·7 16·3 60·9 267 90·2 19·4 14·3 16·1 62·7 Age group 2† 298 50·1 19·5 12·7 19·8 71·6 271 90·9 21·5 15·2 19·7 72·3 Social class ** * Professional/managerial 307 52·4 20·7a 15·6 18·5 68·3 285 92·8 22·3a 17·1 18·3 68·5
Non-manual 117 20 18·6a,b 12·6 17·9 70·9 110 94·0 19·8a,b 13·4 17·8 71·1
Skilled manual 93 15·9 13·8b 9·1 15·4 66·7 82 88·2 15·6b 12·3 15·5 68·6
Semi-skilled þ unskilled 68 11·6 14·8a,b 8·2 18·2 65·6 53 77·9 19·0a,b 10·8 18·6 82
Eating location *** *** Home 594 100 17·7a 12·1 17·6 68·5 533 89·7 19·7a 13·8 17·5 68·9 Other home 349 58·7 0·79b 0 2·6 6·2 83 23·8 3·3b 2·3 4·4 22·5 Outside home 464 78·1 0·55b 0 2·4 6·1 68 14·7 3·8b 2·7 5·2 20·4 Day of week NS NS Weekday 594 100 19·3 13·5 19·6 69·4 522 87·9 22 15·9 19·4 15·9 Weekend 594 100 16·7 9·5 22 72·9 407 68·5 24·5 18·9 22·7 18·9
a,bMean values with unlike superscript letters were significantly different between mean daily intakes of whole grain (ANOVA with Bonferroni correction).
Mean values were significantly different: * P, 0·05, ** P, 0·01, *** P, 0·001, NS (P$ 0·05). † Age group 1: 5 – 8 years; age group 2: 9 – 12 years.
British
Journal
of
of the population that achieved the recommendations, 17 % of the children and 39 % of teenagers satisfied the 48 g/d rec-ommendation, while 20 % of children and 32 % of teenagers satisfied the recommendations based on energy intakes.
Consumers v. non-consumers of whole grain
A comparison of nutrient intakes between non-consumers and consumers of whole grain across the tertiles of intake for chil-dren and teenagers are presented in Table 6. For both chilchil-dren and teenagers, significant differences were seen for mean daily intakes of energy (MJ) and for a range of nutrients (fibre, P, K, Mg, riboflavin and niacin) across the tertiles of intake or when comparing consumers of whole grain with non-consumers of whole grain. The percentage energy contri-bution derived from added sugars for both children and teen-agers was significantly lower in the highest tertile of whole grain intake in comparison to non-consumers of whole grain (P, 0·05).
Discussion
The present paper analysed whole grain intakes in the diets of Irish children and teenagers. Mean daily intakes were 18·5 g/d for children and 23·2 g/d for teenagers, with 90 % of children and 86 % of teenagers being consumers of whole grain. Com-parable studies around the world have found similarly low results, with mean daily intakes of 9·8, 13·0 and 26·4 g/d in the USA(24),UK(15) and Germany(14), respectively. Consumer rates of children and teenagers in these aforementioned studies are reported to have been 55, 73 and 80 %, respectively, all lower than that observed in this Irish population. However, there is currently no universally agreed list of whole grain foods and scientific studies can apply differing criteria when identifying a whole-grain-containing food, making direct com-parisons between studies difficult. Moreover, a UK study only included foods made from a minimum whole grain content of 10 %(15), in comparison to the present study and that of Alexy et al.(14)(a German study), which included all sources of whole grain. The aim of the present study was to quantify whole grain intakes, and therefore it was deemed appropriate to include all sources of whole grain. Nevertheless, intakes
were well below the dietary recommendation of 48 g/d set out by the United States Department of Agriculture(16), with just a maximum of 17 % of children and 39 % of teenagers observed to satisfy this recommendation. The suitability of applying this recommendation to younger children, where portion sizes are typically lower, is questionable; therefore, intakes were also assessed using recommendations that accounted for energy intake(16,40). Using this second approach, similar numbers of children (20 %) and teenagers (32 %) satisfied the recommendations. Dietary recommen-dations for whole grain intake have been developed alongside growing evidence that increasing intakes of whole grain can protect against disease, specifically CVD(42), type 2 diabetes(43) and certain cancers, e.g. colorectal cancer(44). It is likely that the mechanisms by which these benefits are likely to occur (improved inflammatory status(45), insulin response(6), vascu-lar function(46) and lipid profile(2)) may also play a role in younger cohorts, or at least pave the way for a healthier adult-hood. Furthermore, a recent review investigating the link between whole grain consumption and colorectal cancer con-cluded that a diet rich in whole grains (90 g/d) could bring about a 20 % reduced risk of developing colorectal cancer. The review also highlighted the protective effects of increasing fibre intakes, particularly cereal fibre (10 g/d), to reduce the risk by a further 10 %(44).
The composition of whole grains (the germ, the endosperm and the outer bran layers) makes them a rich source of vita-mins, minerals, fibre and antioxidants. Even within the bound-aries of the present study, we found that children and teenagers who consumed whole grain had more favourable intakes of fibre and a number of micronutrients in comparison to non-consumers of whole grain. The strong association between whole grain and fibre was clearly evident in the pre-sent study, with a stepwise increase observed across the ter-tiles of whole grain intake. These results are comparable to an American study, which also showed a positive relationship between whole grain and fibre consumption(24). Although previous research in the present study population has showed fibre intakes to be poor(47,48)and below dietary rec-ommendations(49), the present study suggests that inclusion of whole-grain-rich foods in the daily diet presents a viable way of boosting fibre intakes as well as other micronutrients.
(a) (b) 1·8 (barley) 3·3 (rice) 12·5 (maize) 16·2 (oats) 65·0 (wheat) 0·5 (rye) 0·8 (rye) 1·0 (barley) 5·2 (rice) 6·9 (maize) 18·4 (oats) 67·2 (wheat)
Fig. 1. Contribution of whole grain ingredients (%) to daily whole grain intakes for Irish (a) children and (b) teenagers.
British
Journal
of
Table 4. Intake (g/10 MJ per d) and contribution (%) of food groups to mean daily whole grain intakes across tertiles of intake in whole grain consumers (Mean values and standard deviations)
Tertiles of mean daily whole grain intakes (g/10 MJ per d) Whole grain consumers (n 538
children/382 teenagers) Tertile 1 (n 179 children/127 teenagers) Tertile 2 (n 180 children/128 teenagers) Tertile 3 (n 179 children/127 teenagers)
% Cons Mean SD % Ctr % Cons Mean SD % Ctr % Cons Mean SD % Ctr % Cons Mean SD % Ctr P
Ready-to-eat breakfast cereals
Children 72·3 22·2 19·0 59·3 45·8 7·5a 4·8 41·0 79·4 16·1b 8·6 56·0 91·6 35·0c 21·9 62·7 ***
Teenagers 59·2 21·8 19·8 44·3 29·1 5·7a 2·6 28·0 71·1 14·7b 9·6 47·5 77·2 34·0c 22·7 42·9 ***
Bread and rolls
Children 33·8 11·8 12·8 14·4 24·0 5·0a 3·1 16·2 30·6 8·8b 6·4 11·7 46·9 17·2c 16·2 15·2 ***
Teenagers 49·0 17·7 20·5 26·5 33·1 5·7a 3·8 30·4 45·3 12·4a 8·1 21·3 68·5 27·4b 26·3 30·6 ***
Savoury biscuits, crackers and popcorn
Children 40·9 8·2 7·8 12·0 31·3 5·5a 3·5 21·5 47·8 8·3b 5·7 19·3 43·6 9·9c 11·0 8·1 ***
Teenagers 27·2 8·5 6·8 7·2 22·0 4·2a 2·8 15·1 32·8 11·7b 7·0 16·1 26·8 8·2b 7·0 3·6 ***
Other breakfast cereals
Children 19·3 8·8 10·6 6·5 14·0 3·1a 2·7 5·6 20·6 7·1b 5·5 7·7 23·5 14·0c 14·5 6·2 ***
Teenagers 17·0 18·1 18·2 10·8 8·7 5·0a 2·9 7·1 15·6 12·9a 9·0 9·1 26·8 25·6b 21·4 11·2 ***
Rice, pasta and their dishes
Children 4·6 24·8 19·0 3·9 NA NA NA NA 2·8 10·4 10·0 1·2 11·2 28·4 19·2 5·4 NA
Teenagers 8·8 40·9 27·9 6·6 0·8 5·2 NA 1·3 1·6 7·5a 4·4 0·4 13·4 46·9b 25·7 8·6 *
Sweet biscuits, cereal bars and desserts
Children 33·5 2·3 2·4 2·7 30·7 2·1 2·2 8·9 31·7 2·2 2·2 3·2 38·0 2·5 2·8 1·9 NS
Teenagers 65·0 2·5 2·8 3·2 33·1 1·9 1·8 10·7 33·6 2·3 2·0 3·6 48·8 3·0 3·7 2·4 NS
Meat, tofu and yoghurts
Children 14·9 2·1 1·4 1·1 21·8 2·3 1·6 6·7 10·0 2·3 1·4 0·9 12·8 1·8 1·0 0·5 NS
Teenagers 17·5 2·3 2·0 1·4 17·3 2·5 1·7 7·4 14·8 2·9 2·7 2·0 20·5 1·8 1·4 0·6 NS
% Cons, % consumers of each whole grain food group; % Ctr, % contribution of food groups to whole grain intakes; NA, not available.
a,b,cMean values with unlike superscript letters were significantly different between the mean values of whole grain intake across the tertiles of whole grain intake (adjusted for sex) (ANCOVA, Bonferroni post hoc test).
Mean values were significantly different: * P, 0·05; *** P, 0·001; NS (P$ 0·05).
Whole grain intakes in Ireland 359
British Journal of Nutrition
.
https://doi.org/10.1017/S0007114512004989
https:/www.cambridge.org/core
. University of Basel Library
, on
10 Jul 2017 at 15:46:07
The major food group contributing to whole grain intake was RTEBC (52 %). Other countries have also presented simi-larly high results, with RTEBC contributing 56 % to whole grain intakes in British children and teenagers(15), while in America, this figure is 31 %(50). The high consumption rates of whole grain RTEBC observed in this Irish population was no surprise (72 % of children and 59 % of teenagers), as earlier research has shown over 90 % of Irish children and 81 % of teenagers to be consumers of RTEBC(51,52). European studies examining the change in food choices over time have also reported intakes of RTEBC to be rising(14,53).
There are a number of strategies that could be followed to increase whole grain intakes in this population. For whole grain breakfast cereals, bread and rolls, the potential remains to increase the range of whole grain varieties available and/ or to encourage an increased frequency of consumption of existing foods. Another option involves the food groups
‘savoury biscuits, crackers and popcorn’ and ‘sweet biscuits, cereal bars and desserts’. Typically, these foods are deemed as ‘treat foods’ due to their fat, salt and/or sugar content, yet both groups made small contributions to whole grain intake (12 % on average), and over 34 and 49 % of the present study sample were consumers of these food groups. A practi-cal way to increase whole grain intakes in this population is to act on the finding that whole grain foods are poorly consumed outside of the home, and to work with various stakeholders to increase the availability of whole-grain-containing foods in restaurants and catering establishments. On a positive note, the overall high rate of whole grain consumers, as seen in the present study, contests previous views that inferior taste and texture may be the reason for such poor compliance(54). It may also reflect the 20-fold increase in availability of pro-ducts made with whole grain in the last decade(55). Such
increasing availability, coupled with growing consumer
Table 5. Percentage of Irish children and teenagers from the National Children’s Food Survey and the National Teens’ Food Survey meeting the whole grain recommendations advised by the United States Department of Agriculture(52)
Irish children and teenagers meeting whole grain recommendations
Recommendation of 48 g/d
Recommendation based on energy intakes*
Total population Approach 1 Approach 2 Approach 1 Approach 2
Children (5 – 12 years) 5·5 17·2 7·7 20·4
Teenagers (13 – 17 years) 14·7 39·2 12·0 32·4
* The recommendation suggests average daily intake amounts for whole grain at energy intakes of 4184 kJ (1000 kcal) to 13 389 kJ (3200 kcal)(17), and for those consuming , 4184 kJ (, 1000 kcal)(41).
Table 6. Mean daily intakes of energy (MJ/d), and macro- and micronutrients (per 10 MJ and % total energy) for non-consumers of whole grain and across tertiles of mean daily whole grain intakes in Irish children and teenagers
Children Teenagers
Tertiles of mean daily whole grain intakes Tertiles of mean daily whole grain intakes
Non-consumers Tertile 1 Tertile 2 Tertile 3 P
Non-consumers Tertile 1 Tertile 2 Tertile 3 P
Energy (MJ) 6·8a 6·7a 6·9a 7·6b *** 7·6a 7·8a 8·1a 9·4b ***
% Energy from protein 13·2 13·4 13·6 13·9 NS 14·0a 14·3a 14·9a,b 15·4b **
% Energy from carbohydrate 53·1 51·4 52·1 52·1 NS 48·9 48·5 48·8 49·8 NS
% Energy from total sugar 24·3 24·2 24·0 23·4 NS 20·5 20·1 20·4 20·7 NS
% Energy from added sugar 16·4a 15·3a 14·6a,b 13·3b *** 14·0a 12·8a,b 12·2a,b 11·5b *
% Energy from fat 33·4 34·7 33·8 33·5 NS 36·4 36·9 42·3 46·3 NS
% Energy from saturated fat 14·5 15·1 14·5 14·5 NS 14·5 14·5 14·4 14·2 **
Fibre/energy (g/10 MJ) 14·9a 16·8b 18·4c 19·6c *** 16·4a 16·9a 18·6b 22·0c ***
Na/energy (mg/10 MJ) 3042 3027 3103 3026 NS 2938a 3178b 3086a,b 3020a,b *
Fe/energy (mg/10 MJ) 12·1a,b 12·1a 13·5b 15·1c *** 15·5 15·8 14·3 17·1 NS
Ca/energy (mg/10 MJ) 1216 1219 1239 1294 NS 1010 996·5 1084 1162 NS
Vitamin E/energy (mg/10 MJ) 9·0 8·6 9·4 9·8 NS 9·8 9·4 10·1 11·9 NS
K/energy (mg/10 MJ) 3025a 3110a,b 3080a 3238b ** 3153a 3157a,b 3219b 3275a,b *
P/energy (mg/10 MJ) 1347a 1416a,b 1443b 1550c *** 1360a,b 1354a 1452b 1567c ***
Mg/energy (mg/10 MJ) 247·5a 260·0a 271·3b 305·5c *** 252·9a 257·9a 278·4b 316·7c ***
Thiamin/energy (mg/10 MJ) 2·2 2·0 2·1 2·6 NS 1·9 2·4 2·7 3·2 NS
Riboflavin/energy (mg/10 MJ) 2·4a,b 2·4a 2·5a,b 3·1b * 2·1a 2·3a 3·0a,b 3·9b *
Niacin/energy (mg/10 MJ) 25·3a,b 22·7a 24·9a,b 27·0b *** 23·1a 25·7a,b 28·2b,c 29·8c *
Vitamin B6/energy (mg/10 MJ) 3·0 2·7 2·8 3·3 NS 2·9 3·1 3·5 3·8 NS
Vitamin B12/energy (mg/10 MJ) 5·6 6·0 6·2 6·9 NS 5·2 5·5 6·0 6·9 NS
Vitamin D/energy (mg/10 MJ) 2·8 3·0 3·4 3·5 NS 2·2 3·1 3·4 3·5 NS
a,b,cMean values with unlike superscript letters were significantly different between non-consumers and tertiles of whole grain intakes for mean intakes of whole grain food
groups (adjusted for sex) (ANCOVA, Bonferroni post hoc test).
Mean values were significantly different: * P, 0·05; ** P, 0·01; *** P, 0·001; NS (P$ 0·05).
British
Journal
of
awareness, suggests a potential to further improve compliance to recommendations in future years.
There are a number of strengths and limitations associated with the present study that deserve mentioning. First, a defi-nite strength of this analysis was the thorough data collection methodology that was followed, providing very detailed infor-mation on whole grain intakes. Previous similar studies have used 24 h recall(24), FFQ(1,56)and 3 d weighed food diaries(14). The present study, however, used 7 d weighed (children) and semi-weighed (teenagers) food diaries, with continuous invol-vement of the research team (four visits per subject). In addition, over 46 % of whole grain data were collected at the brand level.
In terms of limitations, data received from manufacturers and food labels must be accepted with caution. Further investigation of whole grain pasta consumed in the present study labelled as 100 % durum whole wheat semolina was found to contain just 88 % whole grain content by alkylresorcinol analysis. A second limitation of the present study is the possibility of under-reporting, which would result in the underestimation of whole grain intakes. In addition, despite best efforts to encou-rage respondents to maintain usual eating practices, the burden of completing 7 d dietary records is acknowledged. Furthermore, the lack of involvement from very low socio-economic groups and those with poor or self-conscious health lifestyles must also be taken into account; these problems being not uncommon in large food-consumption surveys.
In conclusion, despite high consumer rates of whole grain, the percentage of Irish children and teenagers meeting whole grain recommendations advised by the United States Depart-ment of Agriculture(16)is poor. RTEBC were the greatest provi-der of whole grain, with wheat being the primary source. In the present study, whole grain intake was associated with a more nutrient-dense diet. To further improve whole grain intakes in Irish children and teenagers, a combination of effective nutri-tional education programmes and increased product availability and variety are required.
Acknowledgements
The present analysis was supported by Cereal Partners World-wide. A. P. N., B. A. Mc. N. and M. J. G. received the research funding; N. F. C. D. conducted the analysis for the paper and has no conflict of interest; the analysis was supervised by B. A. Mc. N. and A. P. N.; F. T. and H. S. are employed by Cereal Partners Worldwide and helped in designing the study and observed the analysis closely over the course of the study; M. J. G. was the prin-cipal investigator of the NCFS and the NTFS. All authors reviewed the manuscript. We acknowledge the assistance of Tim E. Grant (statistician at CStar, http://www.CStar.ie) for his advice on statisti-cal components of the study.
References
1. McKeown NM, Meigs J, Liu S, et al. (2002) Whole-grain intake is favourably associated with metabolic risk factors for type 2 diabetes and cardiovascular disease in the Fra-mingham Offspring Study. Am J Clin Nutr 76, 390 – 398.
2. Newby P, Maras J, Bakun P, et al. (2007) Intake of whole grains, refined grains, and cereal fiber measured with 7-d diet records and associations with risk factors for chronic dis-ease. Am J Clin Nutr 86, 1745 – 1753.
3. Jensen MK, Koh-Banerjee P, Franz M, et al. (2006) Whole grains, bran, and germ in relation to homocysteine and mar-kers of glycemic control, lipids, and inflammation. Am J Clin Nutr 83, 275 – 283.
4. Slavin J (2004) Whole grains and human health. Nutr Res Rev 17, 99 – 110.
5. Harland JI & Garton LE (2007) Whole-grain intake as a marker of healthy body weight and adiposity. Public Health Nutr 11, 554 – 563.
6. Pereira MA, Jacobs D Jr, Pins JJ, et al. (2002) Effect of whole grains on insulin sensitivity in overweight hyperinsulinemic adults. Am J Clin Nutr 75, 848 – 855.
7. Tighe P, Duthie G, Vaughan N, et al. (2010) Effect of increased consumption of whole-grain foods on blood pressure and other cardiovascular risk markers in healthy middle-aged persons: a randomized controlled trial. Am J Clin Nutr 92, 733 – 740.
8. Giacco R, Clemente G, Cipriano D, et al. (2010) Effects of the regular consumption of wholemeal wheat foods on cardiovascular risk factors in healthy people. Nutr Metab Cardiovasc Dis 20, 186 – 194.
9. Gold K, Wong N, Tong A, et al. (1991) Serum apolipoprotein and lipid profile effects of an oat-bran-supplemented, low-fat diet in children with elevated serum cholesterol. Ann N Y Acad Sci 623, 429 – 431.
10. Steffen LM, Jacobs D Jr, Murtaugh M, et al. (2003) Whole grain intake is associated with lower body mass and greater insulin sensitivity among adolescents. Am J Epidemiol 158, 243 – 250.
11. American Association of Cereal Chemists (2005) Definition/ Reports. http://www.aaccnet.org/definitions/wholegrain.asp (accessed September 2011).
12. Richardson DP (2003) Wholegrain health claims in Europe. Proc Nutr Soc 62, 161 – 169.
13. Whole Grains Council. Governemnt Guidance. http://www. wholegrainscouncil.org/whole-grain-stamp/governemnt-guidance (accessed October 2011).
14. Alexy U, Zorn C & Kersting M (2010) Whole grain in chil-dren’s diet: intake, food sources and trends. Eur J Clin Nutr 64, 745 – 751.
15. Thane CW, Jones AR, Stephen AM, et al. (2005) Whole-grain intake of British young people aged 4 – 18 years. Br J Nutr 94, 825 – 831.
16. U.S. Department of Agriculture & U.S. Department of Health and Human Services (2010) Dietary Guidelines for Ameri-cans 2010, 7th ed. Washington, DC: U.S. Government Print-ing Office.
17. Griffiths T (2007) Towards an Australian ‘daily target intake’ for whole grains. Food Australia 59, 12.
18. Mejborn H, Biltoft-Jensen A, Trolle E, et al. (2008) Whole-grain – Definition and Scientific Background for Rec-ommendations of Wholegrain Intake in Denmark. Søborg: Fødevareinstituttet, Danmarks Tekniske Universitet. 19. van der Kamp JW (2010) Wholegrain definition,
rec-ommended intake and results of Healthgrain. 2nd World Congress of Public Health Nutrition, Porto, Portugal. 20. NHS (2011) The eatwell plate.
www.nhs.uk/Livewell/Good-food/Pages/eatwell-plate.aspx
21. German Nutrition Society (2005) 10 guidelines of the German Nutrition Society (DGE) for a wholesome diet. http://www.dge.de/modules (accessed October 2011).
British
Journal
of
22. O’Neil CE, Zanovec M, Cho SS, et al. (2010) Whole grain and fiber consumption are associated with lower body weight measures in US adults: National Health and Nutrition Exam-ination Survey. Nutr Res 30, 815 – 822.
23. Thane CW, Jones AR, Stephen AM, et al. (2007) Comparative whole-grain intake of British adults in 1986 – 7 and 2000 – 1. Br J Nutr 97, 987 – 992.
24. Zanovec M, O’Neil CE, Cho SS, et al. (2010) Relationship between whole grain and fiber consumption and body weight measures among 6- to 18-year-olds. J Pediatr 157, 578 – 583.
25. Deschamps V, Malon A, Salanave B, et al. (2009) Compliance with French diet recommenations in 3 – 17-year-old children. The French nutrition and health survey (ENNS, 2006 – 2007). In 19th International Congress of Nutrition, Thailand. 26. Central Statistics Office (2003) Census 2002 Principal
Demo-graphic Results. Dublin: The Stationery Office.
27. Holland B, Welch A, Unwin I, et al. (1995) McCance & Widdowson’s The Composition of Foods, 5th ed. London: HMSO.
28. Agency FS (2002) McCance and Widdowson’s The Compo-sition of Foods, 6th summary ed. Cambridge: Royal Society of Chemistry.
29. Holland B, Unwin ID & Buss DH (1992) Fruits and Nuts. First Supplement to McCance & Widdowson’s The Composition of Foods, 5th ed. London: HMSO.
30. Chan W, Brown J & Buss D (1994) Miscellaneous Foods. Fourth Supplement to McCance & Widdowson’s The Compo-sition of Foods, 5th ed. London: HMSO.
31. Chan W, Brown J, Church S, et al. (1996) Meat Products and Dishes. Sixth Supplement to McCance & Widdowson’s The Composition of Foods, 5th ed. London: HMSO.
32. Chan W, Brown J, Lee S, et al. (1995) Meat, Poultry and Game Fifth Supplement to McCance & Widdowson’s The Composition of Foods, 5th ed. London: HMSO.
33. Holland B, Brown J & Buss D (1993) Fish and Fish Products. Third Supplement to McCance & Widdowson’s The Compo-sition of Foods, 5th ed. London: HMSO.
34. Holland B, Unwin I & Buss D (1991) Vegetables, Herbs and Spices. Fifth Supplement to McCance & Widdowson’s The Composition of Foods, 4 ed. London: HMSO.
35. Holland B, Unwin I & Buss D (1989) Milk Products and Eggs. Fourth Supplement to McCance & Widdowson’s The Compo-sition of Foods, 4th ed. London: HMSO.
36. Holland B, Unwin I & Buss D (1988) Cereal and Cereal Pro-ducts. Third Supplement to McCance & Widdowson’s The Composition of Foods, 4th ed. London: HMSO.
37. Holland B, Welch A & Buss D (1996) Vegetable Dishes. Second Supplement to McCance & Widdowson’s The Compo-sition of Foods, 5th ed. London: HMSO.
38. Joyce T, McCarthy SN & Gibney MJ (2008) Relationship between energy from added sugars and frequency of added sugars intake in Irish children, teenagers and adults. Br J Nutr 99, 1117 – 1126.
39. Gilsenan M, Lambe J & Gibney M (2002) Irish National Food Ingredient Database: application for assessing patterns of additive usage in foods. Food Addit Contam 19, 1105 – 1115.
40. Gidding SS, Dennison BA, Birch LL, et al. (2005) Dietary rec-ommendations for children and adolescents: a guide for practitioners: consensus statement from the American Heart Association. Circulation 112, 2061 – 2075.
41. Wearne S & Day M (1999) Clues for the development of food-based dietary guidelines: how are dietary guidelines being achieved by UK consumers? Br J Nutr 81, S119 – S126. 42. Mellen PB, Walsh TF & Herrington DM (2008) Whole grain intake and cardiovasuclar disease: a meta-analysis. Nutr Metab Cardiovasc Dis 18, 283 – 290.
43. Sun Q, Spiegelman D, van Dam RM, et al. (2010) White rice, brown rice, and risk of type 2 diabetes in US men and women. Arch Intern Med 170, 961 – 969.
44. Aune D, Chan DSM, Lau R, et al. (2011) Dietary fibre, whole grains, and risk of colorectal cancer: systematic review and dose – response meta-analysis of prospective studies. BMJ 343, d6617.
45. Masters RC, Liese AD, Haffner SM, et al. (2010) Whole and refined grain intakes are related to inflammatory protein concentrations in human plasma. J Nutr 140, 587 – 594. 46. Flint AJ, Hu FB, Glynn RJ, et al. (2009) Whole grains and
incident hypertension in men. Am J Clin Nutr 90, 493 – 498. 47. Deasy C, Walton J, Hannon EM, et al. (2006) Dietary fibre and NSP intake in Irish children aged 5 – 12 years. Proc Nutr Soc 65, 41A.
48. Bannon S, Walton J, Hannon EM, et al. (2009) Dietary fibre and NSP intake in Irish teenagers aged 13 – 17 years. Proc Nutr Soc 67, E272.
49. Williams CL, Bollella M & Wynder EL (1995) A new rec-ommendation for dietary fiber in childhood. Pediatrics 96, 985 – 988.
50. Harnack L, Walters S & Jacobs D Jr (2003) Dietary intakes and food sources of whole grains among US children and adoles-cents: data from the 1994 – 1996 continuing survey of food intakes by individuals. J Am Diet Assoc 103, 1015 – 1019. 51. Hannon EM & Flynn A (2007) Contribution of ready to eat
breakfast cereals to nutrient intakes in Irish children aged 5 – 12 years. Proc Nutr Soc 66, 43A.
52. Walsh E, Hannon EM, Walton J, et al. (2011) Contribution of ready to eat breakfast cereals to nutrient intakes in Irish teen-agers aged 13 – 17 years. In 11th FENS European Nutrition Conference, 26 – 29 October, Madrid.
53. Lang R, Thane CW, Caroline B-S, et al. (2002) Consumption of whole grain foods by British adults: findings from further analysis of two national dietary surveys. Public Health Nutr 6, 479 – 484.
54. Cleveland LE, Moshfegh AJ, Albertson AM, et al. (2000) Diet-ary intake of whole grains. J Am Coll Nutr 19, 331S – 338S. 55. Mintel Global New Products Database (2011)
www.mintel.-com (accessed March 2012).
56. Jacobs DJ, Meyer K, Kushi L, et al. (1998) Whole-grain intake may reduce the risk of ischemic heart disease death in post-menopausal women: the Iowa Women’s Health Study. Am J Clin Nutr 68, 248 – 257.