Green tea extract only affects markers of oxidative status postprandially:
lasting antioxidant effect of flavonoid-free diet*
J. F. Young
1, L. O. Dragsted
2†, J. Haraldsdo´ttir
1, B. Daneshvar
2, M. A. Kall
3, S. Loft
4, L. Nilsson
1,
S. E. Nielsen
2, B. Mayer
5, L. H. Skibsted
6, T. Huynh-Ba
7, A. Hermetter
5and B. Sandstro¨m
11
Research Department of Human Nutrition, Royal Veterinary and Agricultural University, Frederiksberg, Denmark
2Institute of Food Safety and Toxicology, Danish Veterinary and Food Administration, Søborg, Denmark
3Institute of Food Chemistry and Nutrition, Danish Veterinary and Food Administration, Søborg, Denmark
4Institute of Public Health, University of Copenhagen, Copenhagen, Denmark
5Institute of Biochemistry and Food Chemistry, Technical University of Graz, Graz, Austria
6Food Chemistry, Department of Dairy and Food Science, Royal Veterinary and Agricultural University, Frederiksberg,
Denmark
7Nestle´ Research Centre, Nestec Ltd., 1000 Lausanne 26, Switzerland
(Received 30 November 2000 – Revised 7 September 2001 – Accepted 8 December 2001)
Epidemiological studies suggest that foods rich in flavonoids might reduce the risk of cardio-vascular disease and cancer. The objective of the present study was to investigate the effect of green tea extract (GTE) used as a food antioxidant on markers of oxidative status after diet-ary depletion of flavonoids and catechins. The study was designed as a 2 £ 3 weeks blinded human cross-over intervention study (eight smokers, eight non-smokers) with GTE correspond-ing to a daily intake of 18·6 mg catechins/d. The GTE was incorporated into meat patties and consumed with a strictly controlled diet otherwise low in flavonoids. GTE intervention increased plasma antioxidant capacity from 1·35 to 1·56 (P,0·02) in postprandially collected plasma, most prominently in smokers. The intervention did not significantly affect markers in fasting blood samples, including plasma or haemoglobin protein oxidation, plasma oxidation lagtime, or activities of the erythrocyte superoxide dismutase, glutathione peroxidase, glutathione reductase and catalase. Neither were fasting plasma triacylglycerol, cholesterol, a-tocopherol, retinol, b-carotene, or ascorbic acid affected by intervention. Urinary 8-oxo-deoxyguanosine excretion was also unaffected. Catechins from the extract were excreted into urine with a half-life of less than 2 h in accordance with the short-term effects on plasma antioxidant capacity. Since no long-term effects of GTE were observed, the study essentially served as a fruit and vegetables depletion study. The overall effect of the 10-week period without dietary fruits and vegetables was a decrease in oxidative damage to DNA, blood proteins, and plasma lipids, concomitantly with marked changes in antioxidative defence.
Green tea extract intervention: Dietary depletion of fruits and vegetables: Biomarkers of oxidative damage: Biomarkers of antioxidative defence: Protein oxidation
Consumption of fruit and vegetables is widely encouraged because of the epidemiological indications of a relationship between increased intake and reduced risk of cancer and cardiovascular diseases. A major group of antioxidative compounds in fruit and vegetables, the polyphenols, has been suggested to contribute to these beneficial effects
(Hertog et al. 1993a, 1994, 1995). In a Dutch population, tea was found to be the main dietary source of five selected flavonoids (Hertog et al. 1993b). However, the beneficial effects of tea on cancer and cardiovascular diseases remain controversial (Goldbohm et al. 1996; Katan, 1997; Kohlmeier et al. 1997).
* The study has been carried out with financial support in part from a Danish Food Technology grant (FØTEK2, ‘Antioxidants from plants’) and in part from the Commission of the European Communities, Agriculture and Fisheries (FAIR) specific RTD programme, CT 95-0158 ‘Natural Antioxidants from Foods’. It does not necessarily reflect its views and in no way anticipates the Commission’s future policy in this area.
† Corresponding author: L. O. Dragsted, present address Mørkhøj Bygade 19, DK-2860, Søborg, Denmark, fax +45 33 95 60 01, email [email protected] Abbreviations:AAS, 2-amino-adipic semialdehyde; EC, epicatechin; EGC, epigallocatechin; GTE, green tea extract; 8-oxo-dG, 8-oxo-deoxyguanosine.
British Journal of Nutrition (2002), 87, 343–355 DOI: 10.1079/BJN2002523
qThe Authors 2002
https:/www.cambridge.org/core/terms. https://doi.org/10.1079/BJN2002523
As much as 26 – 30 % of the DM of fresh tea leaves may consist of flavonoids (Lin et al. 1998), among which the catechins are the most abundant. During the manufacture of black tea (a fermentation process) catechins are pro-gressively oxidised by polyphenol oxidase, to form polymer-isation products (Lin et al. 1998). The catechins in tea have a potent antioxidative capacity in model systems, including radical scavenging (Yen & Chen, 1995; Gardner et al. 1998) and provide protection against oxidative changes in plasma (Ishikawa et al. 1997; Lotito & Fraga, 1998) and LDL (Ishikawa et al. 1997; Zhang et al. 1997). Some studies indicate that green tea is a more potent anti-oxidant than black tea in in vitro model systems (Yen & Chen, 1995; Gardner et al. 1998), probably due to its higher content of catechins and lack of polymerisation pro-ducts (Lin et al. 1998).
If catechins can be incorporated into plasma they may be expected to affect the antioxidative status. Animal studies on pure catechins in rats have shown that these compounds are absorbed and transported to the tissues (Nakagawa & Miyazawa, 1997) and experiments with human subjects have shown that catechins are found in plasma (Nakagawa et al. 1997) and excreted into the urine (Das, 1971). Con-sumption of both green and black tea was found to increase plasma antioxidant capacity within 30 – 50 min (Serafini et al. 1996), but over a longer time scale (4 weeks) no effects on antioxidative parameters in blood were observed apart from a slight increase in antioxidative activity in plasma after green tea consumption (van het Hof et al. 1997).
If tea consumption has an effect on the antioxidative system an extract of tea could be expected to exhibit a similar effect. The present study investigated the effect of a green tea extract (GTE) on markers of oxidative status in blood and urine in a blinded double cross-over study with complete control of all dietary intakes. The GTE was incorporated into meat patties at a concentration of 1000 mg/kg, which has been demonstrated to protect
against oxidative changes in dried chicken meat (Nissen et al. 2000).
In order to study individuals with different levels of oxi-dative stress the study included both smokers and non-smo-kers.
Methods Subjects
Sixteen men volunteered for the study including eight non-smokers and eight non-smokers (10 – 15 cigarettes/d). Average age was 23 (range 20 – 31) years and average BMI was
22·7 (range 19·5 – 25·7) kg/m2. None of the subjects had
any chronic illness. Subjects received oral and written information about the study, and gave their written con-sent. The study was approved by the local Research Ethics Committee of Copenhagen and Frederiksberg (Jour-nal number KF01-342/97).
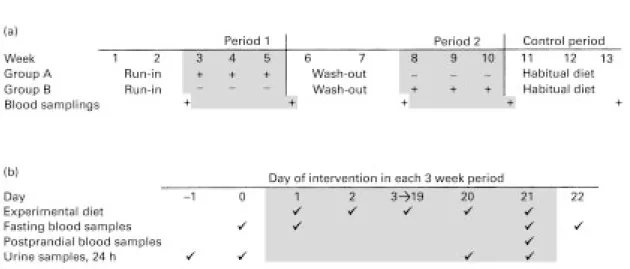
Study design and diet
The study design is illustrated in Fig. 1. It was a double-blind randomised 2 £ 3 week cross-over with 2 weeks wash-out before each intervention. Subjects were divided into groups A and B, with four smokers and four non-smo-kers in each group. A standardised diet with a low flavo-noid content, including 200 g meat patties/10 MJ, was served for the 2 £ 3 week study periods. For one of the 3-week periods the subjects consumed GTE incorporated into meat patties at a concentration of 1000 mg/kg. During the wash-out weeks the subjects excluded flavo-noid-containing foods from their diet. Tea, wine, spices, chocolate, cocoa and all products containing fruits, berries and vegetables, except potatoes and carrots were excluded from their diet. A list of allowed dietary items was distrib-uted to the participants, which included all meats, fish, shellfish, grain products (including whole grain) such as
Fig. 1. Study design. (a) Depiction of the overall design over the entire 13-week period, including two sequential periods, each with an initial 2-weeks wash-out followed by a 3-weeks cross-over intervention, and a final control period. (b) Depiction of the exact sampling times for blood and urine during each of periods 1 and 2. (+) Intervention with green tea extract; (2) sample collection.
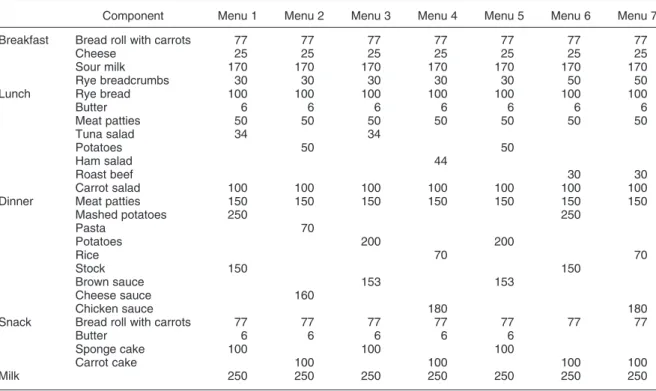
breads and pasta, eggs, potatoes, carrots, freeze dried coffee, mineral water and tap water. The freeze dried coffee was analysed by HPLC and found to be free from catechins. The diet during intervention consisted of seven menus consumed each week from Monday to Sunday (Table 1). The macronutrient and selected micronutrient contents were calculated using a computer program (Dan-kost) which is based on the Danish Veterinary and Food
Administration composition database (Møller, 1989)
(Table 2). Each subject’s energy requirement was esti-mated from body weight and degree of physical activity. All meals were prepared at the department in individual portions according to energy requirement. One of the daily main meals was taken at the department while the remaining (cold) meals were provided daily for intake at home. Subjects were instructed to return any leftovers to the department for weighing and subtraction from planned
intake and were asked daily about compliance. Freeze-dried coffee powder was provided for preparation of coffee. Coffee intake was recorded and varied between subjects but was held constant over the 6 weeks. No food or drink other than that provided from the department was allowed. Fasting blood samples were collected during each period on the morning of day 0, 1, 21 and 22, thus reflecting the preceding 24 h, i.e. day 0 and 1 samples reflect baseline concentrations before intervention (days 21 and 0, respectively) and days 21 and 22 samples reflect the last 2 d of each intervention period (days 20 and 21, respectively) (see Fig. 1(b)). In addition, one blood sample was taken 2.5 h after the hot meal at midday on day 21 of each period. The samples will be referred to in the text according to the 24 h they are reflecting within each period. A final blood sample was collected after week 13 when the subjects had been on their habitual diet for 3 weeks after the last intervention. This sample was collected to represent the participant’s natural back-ground. Twenty-four hour urine samples were collected at baseline, i.e. the 2 d before the intervention (days 21 and 0) and during the last 2 d of intervention (days 20 and 21). Body weight was determined before and after each intervention period.
Green tea extract and pork meat patties
Extract of Chinese green tea (Licosa-P/The´ chinois) was produced using the process described in a patent (Aesch-bach & Rossi, 1994). The extract was a hydrophilic mech-anical extract obtained by pressing the tea on a hydraulic laboratory press using propylene glycol as the carrier. The total polyphenol content of the tea extract was Table 2. The macronutrient and selected micronutrient content of
the experimental diet (per 10 MJ)* Content
Nutrient per 10 MJ % Energy
Protein (g) 91 16
Fat (g) 99 37
Carbohydrate (g) 277 47
Vitamin E (tocopherol equivalents) 2·9
Vitamin C (mg)† 12·6
Vitamin A (retinol equivalents) 3180
b-Carotene (mg)† 11·2
a-Carotene (mg)† 3·6
Lutein (mg)† 0·49
* For details of diet and procedures, see Table 1 and p. 344. † Analysed by HPLC; the remaining nutrients were calculated.
Table 1. Composition of the experimental diet (g/d) at an energy intake of 10 MJ/d
Component Menu 1 Menu 2 Menu 3 Menu 4 Menu 5 Menu 6 Menu 7
Breakfast Bread roll with carrots 77 77 77 77 77 77 77
Cheese 25 25 25 25 25 25 25
Sour milk 170 170 170 170 170 170 170
Rye breadcrumbs 30 30 30 30 30 50 50
Lunch Rye bread 100 100 100 100 100 100 100
Butter 6 6 6 6 6 6 6 Meat patties 50 50 50 50 50 50 50 Tuna salad 34 34 Potatoes 50 50 Ham salad 44 Roast beef 30 30 Carrot salad 100 100 100 100 100 100 100
Dinner Meat patties 150 150 150 150 150 150 150
Mashed potatoes 250 250 Pasta 70 Potatoes 200 200 Rice 70 70 Stock 150 150 Brown sauce 153 153 Cheese sauce 160 Chicken sauce 180 180
Snack Bread roll with carrots 77 77 77 77 77 77 77
Butter 6 6 6 6 6
Sponge cake 100 100 100
Carrot cake 100 100 100 100
Milk 250 250 250 250 250 250 250
Green tea and markers of oxidative status 345
https:/www.cambridge.org/core/terms. https://doi.org/10.1079/BJN2002523
117·3 mg gallic acid equivalent/g extract. Catechins con-tent as determined by HPLC are shown in Table 3.
GTE was incorporated at 1000 mg/kg in pork meat pat-ties, which were produced on a pilot scale using pork meat (25 % fat), water and salt as ingredients. Reference meat patties containing no added GTE were also produced. The process consisted in tempering of the meat (at 228C), mixing all the ingredients, grinding (3 mm), patty forming (approximately 40 g each patty) and frying (belt fryer, no use of additional fat or oil). Meat patties were frozen at 2258C, packed under vacuum in plastic pouches and stored at 2258C until use. A microbiological control was performed on the finished products.
Collection of urine and determination of 8-oxo-deoxyguanosine
Twenty-four hour urine samples were collected in 2·5 l plastic bottles. Fifty ml of 1 mol/l HCl and 10 ml of 10 % ascorbic acid were added to each 2·5 l bottle to increase stability during collection. Urines were weighed, density determined, pH adjusted to 3 – 4 with 1 mol/l HCl and stored at 280 8C until analysis. Urinary concentrations of 8-oxo-deoxyguanosine (8-oxo-dG), a marker of total oxi-datively damaged DNA in the body, were determined by column-switching HPLC with electrochemical detection as described previously (Loft & Poulsen, 1999).
Collection of blood samples and separation of erythrocytes and plasma
Venous blood samples were taken in the morning after at least 12 h of fasting. An additional postprandial sample was drawn on day 21 of each intervention, 2.5 h after consump-tion of the cooked meal. Blood samples were taken in EDTA-coated tubes after supine resting for 10 min. All sub-jects abstained from alcohol for at least 24 h before blood sampling, and the smokers abstained from smoking for at least 8 h before fasting blood samples, and 4.5 h before sampling of non-fasting blood samples. Subjects were instructed to avoid heavy physical activity for 36 h before blood sampling. Plasma samples for 2-amino-adipic semi-aldehyde (AAS) determination were centrifuged at 1500 g for 10 min at room temperature. Erythrocytes were washed three times with 3 vol. 0·9 % NaCl, resuspended in 1 vol. ultrapure (resistance .18 Mohm) water for lysis, and then stored at 280 8C until analysis. Samples
for a-tocopherol, retinol, b-carotene, antioxidant capacity and vitamin C determination were protected from light exposure and kept on ice. Samples were centrifuged at 3000 g for 15 min at 48C, and plasma for vitamin C ana-lyses were added to1 volume of 10 % meta-phosphoric
acid before freezing. Plasma was saturated with N2 gas
and stored at 280 8C until analysis for antioxidant capacity (maximum 7 d), retinol, a-tocopherol and b-carotene (maximum 7 months), cholesterol and triacylglycerol (20 months).
Ascorbate, plasma protein oxidation and antioxidant enzymes
Plasma and dietary samples were analysed for ascorbate (Kall & Andersen, 1999) and plasma proteins were ana-lysed for oxidised lysine residues (Daneshvar et al. 1997) by HPLC as described previously. Erythrocyte lysates were also analysed for protein oxidation products and for the activities of catalase, superoxide dismutase, glutathione peroxidase and glutathione reductase by methods detailed previously (Nielsen et al. 1999). Inter-series CV was less than 10 % for all of these analyses.
Plasma oxidation lagtime and plasma antioxidant capacity Oxidation of lipoproteins in unfractionated plasma was continuously measured by a fluorescence method as described previously (Hofer et al. 1995).
The postprandial samples collected on day 21 of each period were used immediately for determination of plasma antioxidant activity. Fifty ml of plasma (or controls: 10 ml 2 mmol/l Trolox +40 ml buffer or 50 ml buffer) were added to 2·45 ml 1·33 mmol/l methyl linoleate emulsion in 5·0 mmol/l oxygen-saturated PBS (pH 7·4) containing 0·1 % Tween 20 and the oxygen consumption was deter-mined as described previously (Jørgensen & Skibsted, 1993). Antioxidative capacity was estimated by calculating the area under oxygen consumption curves and the influ-ence of plasma was expressed as an antioxidative index (I) relative to samples including Trolox:
Ioxygen consumption relative to reference including Trolox
¼ area ðplasmaÞ=area ðreference including TroloxÞ:
Determination of plasma retinol,a-tocopherol,b-carotene,
triacylglycerol and cholesterol
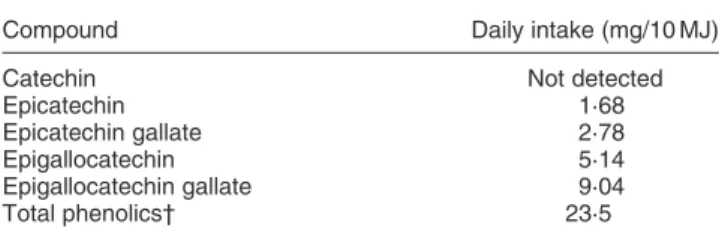
Plasma retinol, a-tocopherol and b-carotene were deter-mined by a contract laboratory (Medi – Lab, Copenhagen, Denmark) using a standard HPLC – procedure (Thurnham et al. 1988). Intra – series CV was 4 %, 4 % and 7 % and inter – series variation was 5 %, 5 % and 10 %, respectively, for retinol, a-tocopherol and b-carotene. Plasma triacylgly-cerol (kit no. 07 36791 Unimate5, Roche) and cholesterol (kit no. CHOD – PAP 2016630; Boehringer Mannheim, Mannheim, Germany) were determined on a Cobas Mira þ (Roche, Basel, Switzerland). Carotenoids in the Table 3. Daily intake of some polyphenols from green tea extract
(1000 mg/kg in the 200 g meat patties served per 10 MJ)*
Compound Daily intake (mg/10 MJ)
Catechin Not detected
Epicatechin 1·68
Epicatechin gallate 2·78
Epigallocatechin 5·14
Epigallocatechin gallate 9·04
Total phenolics† 23·5
* For details of diet and procedures, see Table 1 and pp. 344 – 345. † Total phenolic content was determined by the Folin-Ciocalteu method as
experimental diet were determined as described by Hart & Scott (1995).
Follow – up studies
Two small follow – up studies were performed in order to assess catechin uptake and whether catechins from meat patties containing GTE were absorbed to the same extent as catechins from GTE given in a water – alcohol mixture. In the first study five volunteers consumed an experi-mental diet with a low content of flavonoids as described in the main study for 4 d. On the second day in the morning they voided a spot urine sample and subsequently ingested 2 g GTE in 25 ml water – ethanol (2:1). Total urines were collected 4, 24 and 48 h after GTE intake.
The second study was a 3 £ 1 d cross-over, where three volunteers consumed a low-catechin diet as described in the main study for 2 d (day 1 – 2). On days 3 – 5, they were each day given either 500 mg GTE in 10 ml water – ethanol (2:1), 500 mg GTE in meat patties stored at 2258C for 12 months (from the main study), or 500 mg GTE mixed into freshly prepared meat patties. Urine samples (24 h) were collected from each volunteer during days 2 – 5. The volunteers in these studies were different from those in the main study.
The containers for urine collection in both follow-up studies were prepared as described for the main study and were additionally filled with Ar. Immediately at the end of each collection period the urine samples were satu-rated with Ar and analysed for catechins.
HPLC analyses of urine samples, green tea extract and instant coffee for content of epicatechin and
epigallocatechin
The content of epicatechin (EC) and epigallocatechin (EGC) was determined in the GTE, in the freeze dried coffee, and in fresh urine samples from the follow-up studies. The assay used for analysis was similar to those previously described for other flavonoids (Nielsen & Dragsted, 1998a,b) with respect to enzymic hydrolysis and solid phase extraction.
Enzymically hydrolysed urine samples, GTE or coffee were suspended in 5 % acetonitrile in water before addition of internal standard (10 mg catechin/l) and subjected to solid phase extraction. The HPLC – MS system consisted of a Hewlett Packard (Waldbronn, Germany) 1090 system with a a MSD 1100 mass spectrometric detector. The columns used were a Zorbax SB-C8 (4·6 £ 75 mm; 3·5 mm) column as column 1 and a Purospher RP-18
(4 £ 125 mm; 5 mm) column with guard cartridge
(4 £ 4 mm; 5 mm) as column 2 (Hewlett Packard).
Column temperature was maintained constant at 37 8C using a thermostatically controlled column compartment. U.v. detection was carried out at 280 nm, with peak scanning between 190 and 600 nm (2 nm step). The MS-detection was performed by single-ion monitoring using atmospheric pressure ionisation with electrospray interface
in positive mode. The drying gas (N2) was heated to 350 8C
and introduced at a flow-rate of 10·0 l/min. Nebuliser press-ure was set to 30 psig and capillary voltage to 4000 V. The
mobile phases used for HPLC were (flow of 0·4 ml/min): A, 1 % aqueous formic acid; B, 100 % acetonitrile; C, 100 % methanol. With the automatic six-port column-switching valve in position 1, the sample was injected onto column 1 and eluted through the diodearray detector, bypassing column 2 and the MS-detector, with a following linear gradient of mobile phase B in A (v/v): 5 % to 15 % from 0 to 5 min; 15 % to 25 % from 5 to 14 min. Between 14·1 – 15 min 100 % B was applied resulting in a short wash of column 1. EGC was eluted from column 1 at 7·5 min. By switching the column switching valve from position 1 to 2 at 7·2 min and back to position 1 at 7·8 min, this compound was eluted onto the second column. This procedure was repeated between 8·3 – 8·8 min and 9·5 – 10·0 min for cate-chin (internal standard) and EC, respectively. From 15·1 – 23 min column 1 was preconditioned with pure mobile phase A, and after shifting to column 2 at 21·5 min, elution of the tea catechins through the MS-detector was initiated using the following gradient of mobile phase C in A (v/v): 24 min, 25 % C; 28 – 37 min, 32 % C; 37·5 – 39 min, 100 % C; 39·1 min, 25 % C. A freshly prepared standard solution containing EC, EGC and catechin was analysed before and after each run to ensure a correct column-switching schedule. The EC and EGC detected were corrected for the internal standard (catechin) recovery in each urine sample.
Statistics
The statistical analysis of biomarkers in the cross-over study was done by paired t tests according to Pocock (1998). Significant period effects were observed for plasma ascorbate, 8-oxo-dG in urine and plasma antioxi-dant capacity, and corrections were made according to Pocock (1998). Plasma oxidation lagtime, b-carotene and AAS in erythrocyte lysates were analysed by comparing groups A and B after the first period using a two-sample t test due to period – effect interactions. The effect of smok-ing was analysed by two-sample t tests, comparsmok-ing
smo-kers and non-smokers using the baseline samples
collected after run-in. The effect of intervention on smo-kers and non-smosmo-kers was analysed separately using the same procedure as outlined above for the whole study. Multivariate ANOVA with a repeated statement for the day on intervention was performed for all biomarkers to additionally test for time trends during the whole interven-tion trial using the SAS statistical package (SAS 6.12; SAS Institute Inc., Cary, NC). A P-value of ,0·05 was con-sidered statistically significant.
Results
Subjects, baseline comparisons and influence of smoking status
All subjects were weight-stable, i.e. body weight changed less than 1 kg during the total experimental period for each subject. Group A and B differed with respect to plasma oxidation lagtime at week 2. There were no other differences between the groups after run-in. Smoking did not influence any of the markers after the 2 week run-in
Green tea and markers of oxidative status 347
https:/www.cambridge.org/core/terms. https://doi.org/10.1079/BJN2002523
period, but in the sample representing habitual diet (13 weeks), plasma ascorbate was significantly lower in smokers.
Biomarkers of oxidative damage and antioxidant defence Effects on blood and urine parameters after 3 weeks of experimental diet with or without addition of tea extract to a low-flavonoid diet are shown in Tables 4 and 5. There was no significant effect of intervention with tea extract on plasma protein oxidation (plasma AAS) or plasma oxidation lagtime analysed as delta change for each individual from beginning to end of period 1.
In erythrocytes no effect of GTE intervention was observed on markers of protein oxidation (AAS and
g-glu-tamyl semialdehyde in erythrocytelysates), and the
excretion of 8-oxo-dG in urine was not affected either. There was a significant decrease in plasma AAS and in g-glutamyl semialdehyde in erythrocyte lysates when the samples representing the participants’ habitual diet (week 13) were compared with the samples collected at the end of the periods with restricted diet. The downward trends in plasma AAS (Fig. 2(a)) and in AAS in erythrocyte lysates during the period with restricted diets were also sig-nificant as determined by repeated measures ANOVA. Plasma oxidation lagtimes increased significantly in each strictly controlled period, and also overall during the 10 weeks with a restricted diet as compared with habitual diet (Table 6 and Fig. 2(c)). The urinary excretion of 8-oxo-dG decreased significantly during each of the two
Table 5. Comparison of plasma lipid status markers and plasma antioxidant vitamins at the end of 3 weeks intake of experimental diet without or with green tea extract (1000 mg/kg) in meat patties (200 g/10 MJ per d) in sixteen subjects (each represented by the average of blood samples from 2
successive days)*
(Mean values with their standard deviations)
Basal diet Tea extract Paired difference
Biomarker Mean SD Mean SD Mean 95 % CI
Triacylglycerol (mmol/l) 1·02 0·23 1·04 0·22 0·019 20·036, 0·074 Cholesterol (mmol/l) 4·25 1·20 4·21 1·03 20·047 20·20, 0·11 Retinol (mmol/l) 1·73 0·31 1·75 0·25 0·019 20·082, 0·121 Vitamin C (mg/l) 2·36 0·88 2·50 1·06 0·14† 20·52, 0·80 b-Carotene (mmol/l) 1·43‡ 0·58 2·07‡ 0·60 ‡§ a-Tocopherol (mmol/l) 17·6 4·2 17·4 4·2 20·19 20·76, 0·38
* For details of diet and procedures, see Table 1 and p. 344.
† There was a significant period effect for this marker, and corrected statistical analysis was performed according to Pocock (1998).
‡ There was significant period – effect interaction for this marker, so statistical analysis was performed between groups in period I.
§ There was a significant effect of green tea extract intervention (P,0·05).
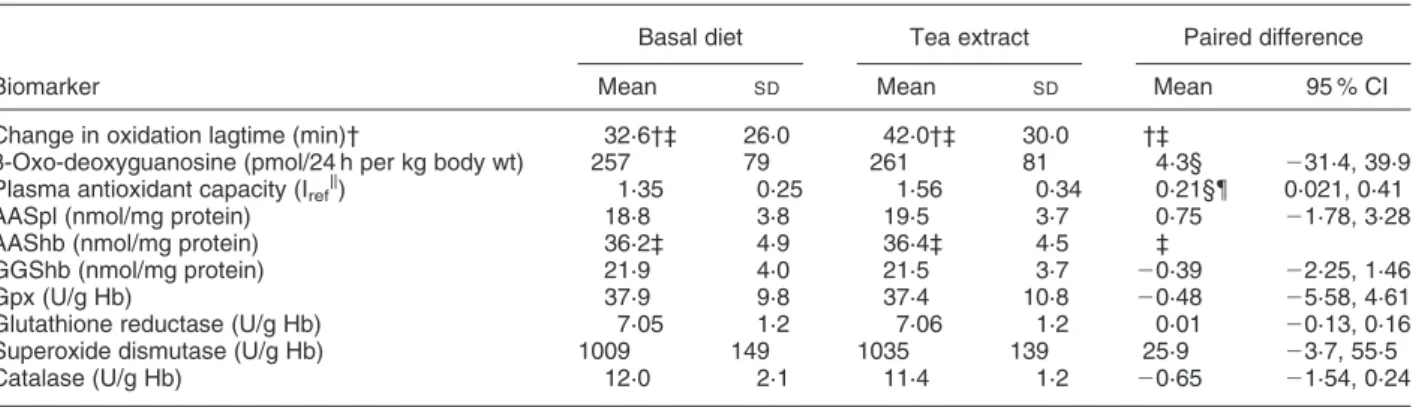
Table 4. Comparison of oxidative status markers in blood or urine at the end of 3 weeks intake of the experimental diet without and with green tea extract (1000 mg/kg) in meat patties (200 g/10 MJ per d) in sixteen subjects (average of blood samples from 2
successive days)*
(Mean values with their standard deviations)
Basal diet Tea extract Paired difference
Biomarker Mean SD Mean SD Mean 95 % CI
Change in oxidation lagtime (min)† 32·6†‡ 26·0 42·0†‡ 30·0 †‡
8-Oxo-deoxyguanosine (pmol/24 h per kg body wt) 257 79 261 81 4·3§ 231·4, 39·9
Plasma antioxidant capacity (Irefk) 1·35 0·25 1·56 0·34 0·21§{ 0·021, 0·41
AASpl (nmol/mg protein) 18·8 3·8 19·5 3·7 0·75 21·78, 3·28
AAShb (nmol/mg protein) 36·2‡ 4·9 36·4‡ 4·5 ‡
GGShb (nmol/mg protein) 21·9 4·0 21·5 3·7 20·39 22·25, 1·46
Gpx (U/g Hb) 37·9 9·8 37·4 10·8 20·48 25·58, 4·61
Glutathione reductase (U/g Hb) 7·05 1·2 7·06 1·2 0·01 20·13, 0·16
Superoxide dismutase (U/g Hb) 1009 149 1035 139 25·9 23·7, 55·5
Catalase (U/g Hb) 12·0 2·1 11·4 1·2 20·65 21·54, 0·24
AASpl, Plasma 2-amino-adipic semialdehyde; AAShb, 2-amino-adipic semialdehyde in erythrocyte lysates; GGShb, g-glutamyl semialdehyde in erythro-cyte lysates; Gpx, glutathione peroxidase, Hb, haemoglobin.
* For details of diet and procedures, see Table 1 and pp. 344 – 345.
† Due to a significant difference between the groups at baseline, the change in plasma oxidation lagtime from start to end of period I is shown. ‡ There was significant period – effect interaction for this marker, so statistical analysis was performed between groups in period I only. § There was a significant period effect for this marker, and statistical analysis was performed according to Pocock (1998).
k Iref, antioxidative capacity relative to reference including Trolox (see p. 346).
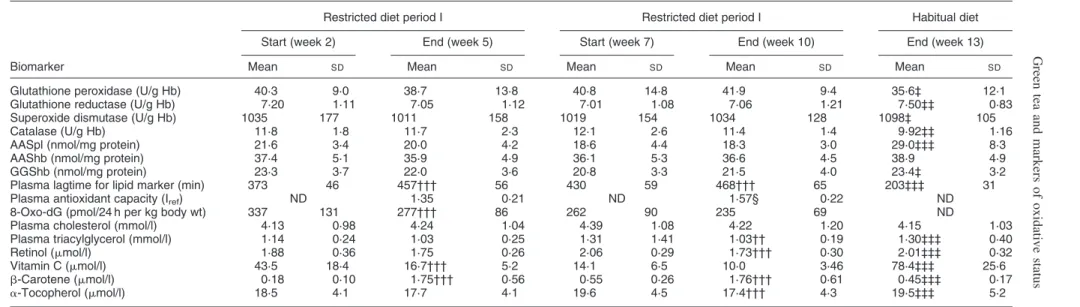
Table 6. Overall changes in biomarkers of oxidative status and in blood lipids from start to end of periods with controlled diets* (Mean values with their standard deviations)
Restricted diet period I Restricted diet period I Habitual diet Start (week 2) End (week 5) Start (week 7) End (week 10) End (week 13)
Biomarker Mean SD Mean SD Mean SD Mean SD Mean SD
Glutathione peroxidase (U/g Hb) 40·3 9·0 38·7 13·8 40·8 14·8 41·9 9·4 35·6‡ 12·1 Glutathione reductase (U/g Hb) 7·20 1·11 7·05 1·12 7·01 1·08 7·06 1·21 7·50‡‡ 0·83 Superoxide dismutase (U/g Hb) 1035 177 1011 158 1019 154 1034 128 1098‡ 105
Catalase (U/g Hb) 11·8 1·8 11·7 2·3 12·1 2·6 11·4 1·4 9·92‡‡ 1·16
AASpl (nmol/mg protein) 21·6 3·4 20·0 4·2 18·6 4·4 18·3 3·0 29·0‡‡‡ 8·3
AAShb (nmol/mg protein) 37·4 5·1 35·9 4·9 36·1 5·3 36·6 4·5 38·9 4·9
GGShb (nmol/mg protein) 23·3 3·7 22·0 3·6 20·8 3·3 21·5 4·0 23·4‡ 3·2
Plasma lagtime for lipid marker (min) 373 46 457††† 56 430 59 468††† 65 203‡‡‡ 31
Plasma antioxidant capacity (Iref) ND 1·35 0·21 ND 1·57§ 0·22 ND
8-Oxo-dG (pmol/24 h per kg body wt) 337 131 277††† 86 262 90 235 69 ND
Plasma cholesterol (mmol/l) 4·13 0·98 4·24 1·04 4·39 1·08 4·22 1·20 4·15 1·03 Plasma triacylglycerol (mmol/l) 1·14 0·24 1·03 0·25 1·31 1·41 1·03†† 0·19 1·30‡‡‡ 0·40
Retinol (mmol/l) 1·88 0·36 1·75 0·26 2·06 0·29 1·73††† 0·30 2·01‡‡‡ 0·32
Vitamin C (mmol/l) 43·5 18·4 16·7††† 5·2 14·1 6·5 10·0 3·46 78·4‡‡‡ 25·6 b-Carotene (mmol/l) 0·18 0·10 1·75††† 0·56 0·55 0·26 1·76††† 0·61 0·45‡‡‡ 0·17 a-Tocopherol (mmol/l) 18·5 4·1 17·7 4·1 19·6 4·5 17·4††† 4·3 19·5‡‡‡ 5·2
Hb, haemoglobin; AASpL, plasma 2-amino-adipic semialdehyde; AAShb, 2-amino-adipic semialdehyde in erythrocyte lysates; GGShb, g-glutamyl semialdehyde in erythrocyte lysates; Iref, antioxidative capacity relative to reference including Trolox in postprandial plasma samples; 8-oxo-dG, 8-oxo-deoxyguanosine; ND, not determined.
* For details of diet and procedures, see Table 1 and p. 344.
Mean values were significantly different from those at the start of the period by paired t test: †† P,0·01, ††† P,0·001.
Mean values were significantly different from those at the end of the restricted diet period by paired t test (week 10): ‡ P,0·05, ‡‡ P,0·01, ‡‡‡ P,0·001. Mean value was significantly different from that obtained in week 5: § P,0·05.
Green tea and markers of oxidative status 349 https:/www.cambridge.org/core/terms . https://doi.org/10.1079/BJN2002523 Downloaded from https:/www.cambridge.org/core
. University of Basel Library
, on
10 Jul 2017 at 15:17:12
intervention periods, and also exhibited a significant over-all decrease of 29 (95 % CI 14, 44) % over time during the 8 weeks on restricted diet (Fig. 2(b)). At baseline (week 2) there were no significant differences between smokers and non-smokers for any of the biomarkers of oxidative stress although the urinary excretion of 8-oxo-dG was 17 (95 % CI 24, 48) % higher in smokers than in non-smokers. There were no significant differences between smokers and non-smokers with respect to the changes observed over time for the oxidative damage markers (Figs. 2 and 3).
Enzymes in antioxidant defence
No changes were observed in activities of the antioxidative enzymes superoxide dismutase, glutathione peroxidase, glutathione reductase and catal in erythrocytes after inter-vention and none of these markers were affected by smok-ing status at baseline.
All the enzyme activities were fairly stable during the periods with restricted diets, but changed markedly as the volunteers returned to their habitual diets. Superoxide dis-mutase and glutathione reductase increased when the restricted diet was substituted for the habitual diet as deter-mined by paired comparisons. Glutathione peroxidase and catalase decreased (Table 6).
Total antioxidative capacity in postprandially collected plasma
There was a significant period effect for plasma antioxida-tive capacity. The capacity was higher in the second period. Plasma antioxidative capacity increased signifi-cantly overall as determined by paired t test and the increase remained after correction for the period effect (Table 4). The effect was most pronounced in group B which had GTE in the second period. The effect was not significant overall in the non-smokers but was significantly increased among the smokers after intervention with tea extract.
Plasma cholesterol and triacylglycerol
Cholesterol and triacylglycerol in plasma were not affected by tea extract intervention (Table 5). Tea extract did not affect these markers in either smokers or non-smokers.
Plasma cholesterol and triacylglycerol did not differ between the groups A and B or between smokers and non-smokers at baseline (week 2). Triacylglycerols in plasma decreased significantly in the last intervention period, and also increased when the volunteers returned to their habitual diets.
Vitamin C in diet and plasma
The calculated content of vitamin C in the diet is listed in Table 2. Plasma ascorbate was significantly lower in smo-kers than in non-smosmo-kers on their habitual diets. The actual ascorbic acid content of the intervention diet was below the detection limit, i.e. ,1 mg/100 g diet, but the dehydro-ascorbic acid content was 12·6 mg/10 MJ per d. There was no effect of the GTE intervention on plasma ascorbate, neither on total plasma vitamin C (Table 5), nor when smo-kers and non-smosmo-kers were analysed separately.
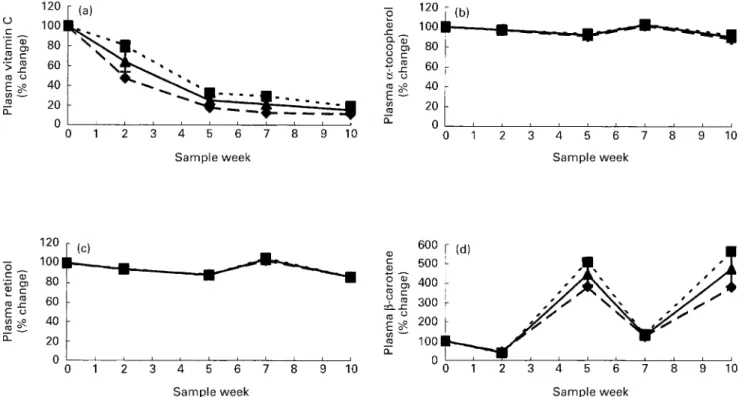
Compared with the reference blood sample reflecting habitual diet (week 13), the plasma vitamin C concen-tration decreased steeply within the first 2 weeks of the study by 36 % resulting in a total decrease by 85 % at the end of the 10th week (Table 6), similar for smokers and non-smokers (Fig. 3(a)).
Fig. 2. Biomarkers of oxidative stress (mean values and standard deviations): (a) plasma protein oxidation (2-amino-adipic semi-aldehyde; AAS); (b) urinary excretion of 8-oxo-deoxyguanosine (8-oxo-dG); (c) plasma total lipoprotein lagtime in sixteen subjects throughout the study period with restricted diets expressed as per-centage of the value obtained 3 weeks after its completion (reflect-ing habitual diet, depicted as day 0). Values for smokers (--B--), non-smokers (--V--) and both (—O—) are shown.
Plasmaa-tocopherol, retinol andb-carotene Plasma a-tocopherol and retinol were not affected by inter-vention with tea extract in either smokers or non-smokers (Table 5).
There was a small decrease by 16 % and 11 %, respect-ively, from start to end of the second intervention period in plasma retinol and a-tocopherol (Table 6). Similar decreases were observed in smokers and non-smokers between habitual and intervention diet (Fig. 3).
The basal intervention diet had a relatively high content of b-carotene, 11·2 mg/10 MJ per d, which meant that mean daily intake was 16·2 mg/d, similar in group A and B
(range 13·4 – 20·2 mg/d) and that plasma b-carotene
increased significantly during both intervention periods. There was a significant decrease in b-carotene after the last intervention when compared with the level after 3 weeks with habitual diet. The b-carotene plasma levels did not reach baseline levels within the wash-out period giving rise to carry-over from the first to the second intervention period (Fig. 3). When tested at the end of the first intervention period tea extract had an increasing effect upon the plasma b-carotene level (Table 5). Group A had a uniformly larger increase in b-carotene than group B in both periods, indicat-ing that this was not due to the tea extract. The response was not influenced by smoking status.
Catechins in urine
The analysis for catechins was very sensitive with a detec-tion limit of 0·5 ng/ml urine and linearity in the range of
0·5 – 50 ng/ml (r2 0·998). The standards were stable in
the HPLC vials for up to 1 week at room temperature, and at 2208C for 3 months.
In the first follow-up study we observed that 80 % of the excreted EC and EGC were detected in urine within 4 h, whereas 20 % were excreted between 4 and 24 h. At 48 h no catechins were detectable (see Fig. 4). This points to an excretion half-life of about 1.6 h for both substances. There was good concordance between double determi-nations for each individual (CV was 6·1 % for EC and 5·3 % for EGC), but relatively large inter-individual vari-ations in total excretion (CV was 27 % for EC and 19 % for EGC). A mean of 3·2 % of EC and 1·3 % of EGC was excreted in the first follow-up study.
In the second follow-up study, EC and EGC were observed in 24-h urine samples from each of the three vol-unteers on the days where GTE was ingested, whereas only a trace was found in urine from day 2 where the volunteers had abstained from catechin-containing foods for 24 h, (see Table 7). After correcting for the recovery of catechin in each sample, 3·7 % of the EC and 2·8 % of the EGC from the ingested GTE were found in the urine. EC and EGC were excreted in urine after ingestion of the same GTE-containing meat patties which were used in the main study, indicating that EC and EGC are absorbable from enriched meat patties.
Discussion
It is still controversial whether green tea can protect against cancer and heart disease (Goldbohm et al. 1996; Katan, Fig. 3. Plasma concentrations of antioxidant vitamins (mean values and standard deviations): (a) vitaminC; (b) a-tocopherol; (c) retinol; (d) b-carotene in sixteen subjects throughout the study period with restricted diets expressed as percentage of the value obtained 3 weeks after its completion (reflecting habitual diet, depicted as day 0). Values for smokers (--B--), non-smokers (– –V– –) and both (—O—) are shown.
Green tea and markers of oxidative status 351
https:/www.cambridge.org/core/terms. https://doi.org/10.1079/BJN2002523
1997; Kohlmeier et al. 1997), but the high content of anti-oxidants in green tea, catechins in particular, has been suggested to cause such effects through a protective mech-anism against radical-mediated damage (Imai & Nakachi, 1995; Benzie et al. 1999; Klaunig et al. 1999). Although green or black tea, tea extracts or isolated catechins have shown potent protective effects against oxidative stress in various model systems in vitro and in animal experiments (Loft & Poulsen, 1999), recent studies with human subjects have recorded limited effects in accordance with our pre-sent results. Van het Hof et al. (1997) did not observe any effects on resistance to LDL oxidation, plasma lipid oxidation or antioxidative enzyme activities in volunteers
after intake of tea for 2 weeks. Similarly, black tea poly-phenols increased the resistance of human plasma to lipid peroxidation in vitro but not ex vivo after ingestion of black tea (Cherubini et al. 1999).
The present study included a group of smokers with a potentially higher oxidative stress. In a cross-sectional study Imai & Nakachi (1995) observed a decrease in lipid peroxides in fasting blood samples from heavy smo-kers who took ten cups of green tea/d or more, but Princen et al. (1998) did not observe any effect on LDL-oxidation, cholesterol levels, or plasma triacylglycerols in a random-ised controlled study on smokers receving six cups of black or green tea a day for 4 weeks. In the present study we did not observe differences between smokers and non-smokers in fasting blood samples using any of the selected markers of oxidative status or lipid status either before or after intervention with catechin-rich tea extract after what corre-sponds to a more ordinary intake of about 1 – 2 cups of tea/d which is within the estimated median intake of 20 – 50 mg daily of catechins in Denmark (Dragsted et al. 1997). As expected, the smokers in the present study had lower ascorbate levels in plasma samples representing habitual diet. In the postprandial samples we observed a significant effect of GTE intervention on plasma anti-oxidant capacity in smokers only, when smokers and non-smokers were analysed separately, indicating that GTE has a more prominent effect in oxidatively stressed individuals. Thus, our observations in smokers is in fair agreement with the results of others although the dose of catechins in the present study may not have been suffi-ciently large for an effect on lipid oxidation.
The unexpectedly high bioavailability of b-carotene caused significant period – effect interactions and when analysed at the end of the first intervention period, tea extract seemed to increase plasma b-carotene. A sparing effect of GTE catechins on plasma b-carotene can there-fore not be excluded to be present also in vivo. However, there is a large inter-individual variation in response to b-carotene, and extreme subjects are sometimes character-ised as ‘non-responders’ and ‘high-responders’, respect-ively (Bowen et al. 1993; Parker, 1996). In the present study the larger response in group A, observed in both intervention periods, seemed to be due to a larger number of ‘high-responders’ in this group and we therefore conclude that GTE probably had no true sparing effect on b-carotene in the present study. This is in line with the observation that plasma b-carotene did not have a time-course similar to any markers of free-radical mediated damage in the present study.
Results of our follow-up studies indicate that as much as 2·7 % of the dose of EC and 2·0 % of EGC may have been absorbed from the meat patties fortified with catechins, but that excretion is very fast with urinary excretion half-lives of less than 2 h. The protein-rich matrix did not seem to greatly influence catechin uptake in accordance with results concerning other polyphenols (Hollman et al. 1997). Naka-gawa et al. (1997) have shown that up to 2 % epigallocate-chin gallate and 1.3 % EGC are incorporated into plasma 90 min after ingestion of GTE in capsules in fair agreement with our results. Our results on antioxidant vitamins in plasma also confirm the results of others, who did not Fig. 4. Urinary excretion of (a) epicatechin and (b) epigallocatechin
in five volunteers ( , , , , A) at various intervals up to 48 h after ingestion of 2 g green tea extract containing 16·3 mg epicatechin and 51·4 mg epigallocatechin. Each sample was analysed in dupli-cate and the total amounts excreted in each interval are shown as bars.
Table 7. Excretion of epigallocatechin (EGC) and epicatechin (EC) after intake of green tea extract in three different regimens*
EGC† EC†
Diet Mean SD Mean SD
Enriched meat patties‡ 2·02 1·00 2·73 1·26 Meat patties with added extract§ 2·12 0·06 2·62 1·75
Extract only 2·68 0·83 3·20 0·57
* For details of procedures, see p. 344. † Expressed as percentage of ingested amount.
‡ Enriched during production and stored for 12 months at 2258C. § Green tea extract added right before ingestion.
see any changes in tocopherols, b-carotene, ascorbic acid or uric acid after consumption of teas or tea extracts at 5 – 20 times higher doses than ours but with less control over dietary intakes (Nakagawa et al. 1997; van het Hof et al. 1997).
We observed that the antioxidant capacity increased, as measured 2 h after a tea extract-containing meal. This effect on the antioxidative capacity in plasma confirms the results of several others (van het Hof et al. 1997; Pietta et al. 1998; Benzie et al. 1999; Sung et al. 2000) who also observed an increased total antioxidant activity in plasma shortly after consumption of a single or multiple doses of green or black tea. The presence of only a short-term effect may readily be explained by the short half-life of catechins from GTE as seen in Fig. 4.
The lack of long-term effects from the GTE intervention allows for a post-hoc analysis of the longitudinal effects of a flavonoid-free diet on the biomarkers of oxidative damage and defence in the present study. We have pre-viously observed a significant increase in plasma AAS after high intakes of juices rich in ascorbate and plant phe-nols (Young et al. 1999) and Castenmiller et al. (1999) observed a significant correlation between plasma ascor-bate and plasma AAS among sixty-four volunteers in a spinach intervention study (Castenmiller et al. 1999). We have also observed a decrease in plasma ascorbate and in plasma protein oxidation in a recent study over a period of 2 weeks with a fruit- and vegetable-free diet similar to the one used in the present study (Young et al. 2000). It is possible that dietary changes induced a change in protein turnover or degradation. However, a similar decrease in protein oxidation, in 8-oxo-dG excretion and in the increased resistance of plasma lipoproteins to oxidation in the present study points to a more general relief of oxi-dative stress after depletion of flavonoid- and ascorbate-rich fruits and vegetables from the diet, contrary to common beliefs.
The decrease in the urinary excretion of 8-oxo-dG might also have resulted from a decrease in the efficiency of DNA-repair. Other studies on DNA damage in relation to fruit and vegetable intakes show an equivocal picture (Velthuis-te Wierik et al. 1995; Hertog et al. 1997; Djuric et al. 1998), whereas no significant effect of vitamin C, vitamin E or b-carotene on the excretion of 8-oxo-dG has been observed in placebo-controlled intervention studies and in meta-analyses (van Poppel et al. 1995; Prieme´ et al. 1997; Poulsen et al. 1998; Loft & Poulsen, 2000). Studies on plasma lipid oxidation, plasma oxidation lagtimes and plasma malondialdehyde in relation to diet generally point to an increase in oxidative damage with diets low in fruits, vegetables or vitamin C, in disagree-ment with our findings (Fuller et al. 1996; Omaye et al. 1996; Anderson et al. 1997; Miller et al. 1998; Maskarinec et al. 1999). Complex pro- and antioxidant effects could together with large differences in study material and proto-cols possibly explain much of the apparent extensive
vari-ation and discrepancies regarding the effects of
antioxidants, fruits and vegetables on DNA, lipid and pro-tein oxidation.
In conclusion, GTE incorporated into meat patties in doses realistic for addition to processed foods only leads
to a short-term change in plasma antioxidant capacity and has no long-term effects on oxidation parameters within the blood or urine compartments in smokers or in non-smokers. The study can therefore be seen as a 10 weeks controlled study with dietary depletion of all food antioxidants derived from fruits and vegetables, except for carrots and potatoes. During the depletion we observed a decrease in oxidative damage to proteins, DNA, and lipids, concomitantly with a major reduction in plasma ascorbate and minor changes in other vitamins and in anti-oxidant enzyme activities. We speculate that these seem-ingly positive effects on oxidative status are partly due to depletion of some pro-oxidant compounds co-existing with vitamin C in fruits and vegetables and this underlines the general lack of solid knowledge of the mechanisms by which a diet rich in fruits and vegetables cause a decrease in the risk of chronic diseases.
Acknowledgements
The authors wish to thank Anni Schou, Vibeke Kegel, Joan Frandsen, Hanne Fenger Eriksen, Susanne M. Hansen, Bir-gitte Alstrup Jørgensen, and Ella Jessen for excellent assistance, and Nestle´ R&D Bjuv (Sweden) for providing the meat products used in this study.
References
Aeschbach R & Rossi P (1994) Alkylene glycol extraction of anti-oxidants from vegetable matter. Nestec Ltd. (US patent US5795609).
Anderson D, Phillips BJ, Yu TW, Edwards AJ, Ayesh R & But-terworth KR (1997) The effects of vitamin C supplementation on biomarkers of oxygen radical generated damage in human volunteers with low or high cholesterol levels. Environmental and Molecular Mutagenesis 30, 161 – 174.
Benzie IFF, Szeto YT, Strain JJ & Tomlinson B (1999) Consump-tion of green tea causes rapid increase in plasma antioxidant power in humans. Nutrition and Cancer 34, 83 – 87.
Bowen PE, Garg V, Stacewicz-Sapuntzakis M, Yelton L & Schreiner RS (1993) Variability of serum carotenoids in response to controlled diets containing six servings of fruits and vegetables per day. Annals of the New York Academy of Sciences 691, 241 – 243.
Castenmiller JJM, Lauridsen ST, Dragsted LO, van het Hof KH, Linssen JPH & West CE (1999) Beta-carotene does not change markers of enzymatic and non-enzymatic antioxidant activity in human blood. Journal of Nutrition 129, 2162 – 2169. Cherubini A, Beal MF & Frei B (1999) Black tea increases the
resistance of human plasma to lipid peroxidation in vitro, but not ex vivo. Free Radical Biology and Medicine 27, 381 – 387. Daneshvar B, Frandsen H, Autrup H & Dragsted LO (1997) Gamma-glutamyl semialdehyde and 2-amino-adipic semialde-hyde: biomarkers of oxidative damage to proteins. Biomarkers 2, 117 – 123.
Das NP (1971) Studies of flavonoid metabolism. Absorption and metabolism of (+)-catechin in man. Biochemical Pharmacology 20, 3435 – 3445.
Djuric Z, Depper JB, Uhley V, Smith D, Lababidi S, Martino S & Heilbrun LK (1998) Oxidative DNA damage levels in blood from women at high risk for breast cancer are associated with dietary intakes of meats, vegetables, and fruits. Journal of the American Dietetics Association 98, 524 – 528.
Dragsted LO, Strube M & Leth T (1997) Dietary levels of plant
Green tea and markers of oxidative status 353
https:/www.cambridge.org/core/terms. https://doi.org/10.1079/BJN2002523
phenols and other non-nutritive components: could they pre-vent cancer? European Journal of Cancer Prepre-vention 6, 522 – 528.
Fuller CJ, Grundy SM, Norkus EP & Jialal I (1996) Effect of ascorbate supplementation on low density lipoprotein oxidation in smokers. Atherosclerosis 119, 139 – 150.
Gardner PT, McPhail DB & Duthie GC (1998) Electron spin resonance spectroscopic assessment of the antioxidant potential of teas in aqueous and organic media. Journal of the Science of Food and Agriculture 76, 257 – 262.
Goldbohm RA, Hertog MGL, Brants HAM, van Poppel G & van den Brandt PA (1996) Consumption of black tea and cancer risk: A prospective cohort study. Journal of the National Cancer Institute 88, 93 – 100.
Hart DJ & Scott KJ (1995) Development and evaluation of an HPLC method for the analysis of carotenoids in foods, and the measurement of the carotenoid content of vegetables and fruits commonly consumed in the UK. Food Chemistry 54, 101 – 111.
Hertog MGL, de Vries A, Ocke´ MC, Schouten A, Bueno-de-Mes-quita HB & Verhagen H (1997) Oxidative DNA damage in humans: comparison between high and low habitual fruit and vegetable consumption. Biomarkers 2, 259 – 262.
Hertog MGL, Feskens EJM, Hollman PCH, Katan MB & Kromh-out D (1993a) Dietary antioxidant flavonoids and risk of corn-ary heart disease: the Zutphen elderly study. Lancet 342, 1007 – 1011.
Hertog MGL, Feskens EJM, Hollman PCH, Katan MB & Kromh-out D (1994) Dietary flavonoids and cancer risk in the Zutphen elderly study. Nutrition and Cancer 22, 175 – 184.
Hertog MGL, Hollman PCH, Katan MB & Kromhout D (1993b) Estimation of daily intake of potentially anticarcinogenic flavo-noids and their determinats in adults in The Netherlands. Nutri-tion and Cancer 20, 21 – 29.
Hertog MGL, Kromhout D, Aravanis C, Blackburn H, Buzina R, Fidanza F, Giampaoli S, Jansen A, Menotti A, Nedeljkovic S, Pekkarinen M, Simic BS, Toshima H, Feskens EJM, Hollman PCH & Katan MB (1995) Flavonoid intake and long-term risk of coronary heart disease and cancer in The Seven Countries Study. Archives of Internal Medicine 155, 381 – 386. Hofer G, Lichtenberg D & Hermetter A (1995) A new fluor-escence method for the continuous determination of surface lipid oxidation in lipoproteins and plasma. Free Radical Research 23, 317 – 327.
Hollman PC, Tijburg LB & Yang CS (1997) Bioavailability of flavonoids from tea. Critical Reviews of Food Science and Nutrition 37, 719 – 738.
Imai K & Nakachi K (1995) Cross sectional study of effects of drinking green tea on cardiovascular and liver diseases. British Medical Journal 310, 693 – 696.
Ishikawa T, Suzukawa M, Ito T, Yoshida H, Ayaori M, Nishiwaki M, Yonemura A, Hara Y & Nakamura H (1997) Effect of tea flavonoid supplementation on the susceptibility of low-density lipoprotein to oxidative modification. American Journal of Clinical Nutrition 66, 261 – 266.
Jørgensen K & Skibsted L (1993) Carotenoid scavenging of rad-icals. Effects of carotenoid structure and oxygen partial press-ure on antioxidative activity. Zeitschrift fu¨r Lebensmittel Untersuchung und Forschung 196, 423 – 429.
Kall M & Andersen C (1999) Improved method for simultaneous determination of ascorbic acid and dehydroascorbic acid, isoas-corbic acid and dehydroisoasisoas-corbic acid in food and biological samples. Journal of Chromatography B: Biomedical Sciences and Applications 730, 101 – 111.
Katan MB (1997) Flavonoids and heart disease. American Jour-nal of Clinical Nutrition 65, 1542 – 1543.
Klaunig JE, Xu Y, Han C, Kamendulis LM, Chen J, Heiser C,
Gordon MS & Mohler ER III (1999) The effect of tea con-sumption on oxidative stress in smokers and nonsmokers. Pro-ceedings of the Society Experimental Biology and Medicine 220, 249 – 254.
Kohlmeier L, Weterings KG, Steck S & Kok FJ (1997) Tea and cancer prevention: an evaluation of the epidemiologic litera-ture. Nutrition and Cancer 27, 1 – 13.
Lin J-K, Lin C-L, Liang Y-C, Lin-Shiau S-Y & Juan I-M (1998) Survey of catechins, gallic acid, and methylxanthines in green, oolong, pu-erh, and black teas. Journal of Agricultural Food Chemistry 46, 3635 – 3642.
Loft S & Poulsen HE (1999) Markers of oxidative damage to DNA: antioxidants and molecular damage. Methods in Enzy-mology 300, 166 – 184.
Loft S & Poulsen HE (2000) Antioxidant intervention studies related to DNA damage, DNA repair and gene expression. Free Radical Research 33, S67 – S83.
Lotito SB & Fraga CG (1998) (+)-Catechin prevents human plasma oxidation. Free Radical Biology and Medicine 24, 435 – 441.
Maskarinec G, Chan CL, Meng L, Franke AA & Cooney RV (1999) Exploring the feasibility and effects of a high-fruit and -vegetable diet in healthy women. Cancer Epidemiology Biomarkers and Prevention 8, 919 – 924.
Miller ER III, Appel LJ & Risby TH (1998) Effect of dietary pat-terns on measures of lipid peroxidation: results from a random-ized clinical trial. Circulation 98, 2390 – 2395.
Møller A (1989) Food Composition tables. Copenhagen: National Food Agency.
Nakagawa K & Miyazawa T (1997) Absorption and distribution of tea catechin, (-)- epigallocatechin-3-gallate, in the rat. Jour-nal of NutritioJour-nal Science and Vitaminology 43, 679 – 684. Nakagawa K, Okuda S & Miyazawa T (1997) Dose-dependent
incorporation of tea catechins, (-)- epigallocatechin-3-gallate and (-)-epigallocatechin, into human plasma. Bioscience Bio-technology Biochemistry 61, 1981 – 1985.
Nielsen SE & Dragsted LO (1998a) Column-switching high-per-formance liquid chromatographic assay for the determination of quercetin in human urine with ultraviolet absorbance detection. Journal of Chromatography 707B, 81 – 89.
Nielsen SE & Dragsted LO (1998b) Column-switching high-per-formance liquid chromatographic assay for determination of apigenin and acacetin in human urine with ultraviolet absor-bance detection. Journal of Chromatography 713B, 379 – 386. Nielsen SE, Young JF, Daneshvar B, Lauridsen ST, Knuthsen P, Sandstro¨m B & Dragsted LO (1999) Effect of parsley (Petro-selinum crispum ) intake on urinary apigenin excretion, blood antioxidant enzymes and biomarkers for oxidative stress in human subjects [see comments]. British Journal of Nutrition 81, 447 – 455.
Nissen LR, Mansson L, Bertelsen G, Huynh-Ba T & Skibsted LH (2000) Protection of dehydrated chicken meat by natural anti-oxidants as evaluated by electron spin resonance spectrometry. Journal of Agricultural and Food Chemistry 48, 5548 – 5556. Omaye ST, Burri BJ, Swendseid ME, Henning SM, Briggs LA,
Bowen HT & Ota RB (1996) Blood antioxidants changes in young women following beta-carotene depletion and repletion. Journal of the American College of Nutrition 15, 469 – 474. Parker RS (1996) Absorption, metabolism, and transport of
caro-tenoids. FASEB Journal 10, 542 – 551.
Pietta P, Simonetti P, Gardana C, Brusamolino A, Morazzoni P & Bombardelli E (1998) Relationship between rate and extent of catechin absorption and plasma antioxidant status. Biochemis-try and Molecular Biology International 46, 895 – 903. Pocock SJ (1998) Clinical Trials. A Practical Approach.
Chiches-ter, UK: Wiley & Sons.
damage in cancer initiation and promotion. European Journal of Cancer Prevention 7, 9 – 16.
Prieme´ H, Loft S, Nyysso¨nen K, Salonen JT & Poulsen HE (1997) No effect of supplementation with vitamin E, ascorbic acid, or coenzyme Q10 on oxidative DNA damage estimated by 8-oxo-7,8-dihydro-20-deoxyguanosine excretion in smokers. American Journal of Clinical Nutrition 65, 503 – 507. Princen HM, van Duyvenvoorde W, Buytenhek R, Blonk C,
Tij-burg LB, Langius JA, Meinders AE & Pijl H (1998) No effect of consumption of green and black tea on plasma lipid and anti-oxidant levels and on LDL oxidation in smokers. Arteriosclero-sis ThromboArteriosclero-sis and Vascular Biology 18, 833 – 841.
Serafini M, Ghiselli A & Ferro LA (1996) In vivo antioxidant effect of green and black tea in man. European Journal of Clinical Nutrition 50, 28 – 32.
Sung H, Nah J, Chun S, Park H, Yang SE & Min WK (2000) In vivo antioxidant effect of green tea (In Process Citation). Euro-pean Journal of Clinical Nutrition 54, 527 – 529.
Thurnham DI, Smith E & Flora PS (1988) Concurrent liquid-chromatographic assay of retinol, alpha-tocopherol, beta-caro-tene, alpha-carobeta-caro-tene, lycopene, and beta-cryptoxanthin in plasma, with tocopherol acetate as internal standard. Clinical Chemistry 34, 377 – 381.
van het Hof KH, de Boer HSM, Wiseman SA, Lien N, Weststrate JA & Tijburg LBM (1997) Consumption of green or black tea
does not increase resistance of low-density lipoprotein to oxi-dation in humans. American Journal of Clinical Nutrition 66, 1125 – 1132.
van Poppel G, Poulsen H, Loft S & Verhagen H (1995) No influ-ence of beta-carotene on oxidative DNA damage in male smo-kers. Journal of the National Cancer Institute 87, 310 – 311. Velthuis-te Wierik EJ, van Leeuwen RE, Hendriks HF, Verhagen
H, Loft S, Poulsen HE & van den BH (1995) Short-term mod-erate energy restriction does not affect indicators of oxidative stress and genotoxicity in humans. Journal of Nutrition 125, 2631 – 2639.
Yen G & Chen H (1995) Antioxidant activity of various tea extracts in relation to their antimutagenicity. Journal of Agri-cultural and Food Chemistry 43, 27 – 32.
Young JF, Dragsted LO, Daneshvar B, Lauridsen ST, Hansen M & Sandstro¨m B (2000) The effect of grape skin extract on oxi-dative status. British Journal of Nutrition 84, 505 – 513. Young JF, Nielsen SE, Haraldsdo´ttir J, Daneshvar B, Lauridsen
ST, Knuthsen P, Crozier A, Sandstro¨m B & Dragsted LO (1999) Effect of fruit juice intake on urinary quercetin excretion and biomarkers of antioxidative status. American Journal of Clinical Nutrition 69, 87 – 94.
Zhang A, Chan PT, Luk YS, Ho WKK & Chen ZY (1997) Inhibi-tory effect of jasmine green tea epicatechin isomers on LDL-oxidation. Nutritional Biochemistry 8, 334 – 340.
Green tea and markers of oxidative status 355
https:/www.cambridge.org/core/terms. https://doi.org/10.1079/BJN2002523