e
Pergamon International Journalfor Quality in Health Care, Vol. 8, No.3, pp. 271-277, 1996 Copyright © 1996 Elsevier Science Ltd. All rights reserved Printed in Great BritainPII: 81353--4505(96)00026-9 1353--4505/96 $15.00+0.00
Quality Assurance in Swiss University Hospitals:
a Survey Among Clinical Department Heads
B. GRAZ, J. P. VADER, B. BURNAND
and
F. PACCAUD
Institute of Social and Preventive Medicine, University of Lausanne, Lausanne, Switzerland
Objective: To obtain information to help design and implement quality improvement programmes.
Design: Questionnaire survey. Setting: Swiss University Hospitals.
Study participants: Clinical Department heads. Main outcome measures: Attitudes towards quality assurance and percentage of departments with procedures for measurement and improve-ment of structure, process and outcome of medical care.
Results: Among 138 departments responding, 69 indicated a designated person or group in charge of quality and 57 were involved in coUaborative quality improvement programmes. Mortality data at the level of the department was unavailable to 33o/o of respondents, and data on adverse treatment effects to 67o/o of them. Most respondents ( 69o/o) favoured the use of outcome indicators for quality control; only 13o/o favoured indicators pertaining to process or structure of care. Among indicators of outcome, patient satisfaction was the preferred indicator (25o/o of respondents), followed by morbidity (16o/o) and mortality (12o/o) data.
Conclusion: Although the quality of medical care in Switzerland enjoys an excellent reputation, this study highlights important gaps in the infor-mation system and the processes necessary to evaluate quality. Copyright
©
1996 Eslevier Science Ltd.Received 29 August 1995; accepted 7 March 1996.
Key words: Quality of health care, quality control, quality assurance, health care, attitude of health personnel, Switzerland, hospitals, teaching.
INTRODUCTION
Quality in health care has been the subject of little formal research in Switzerland. As part of an inter-university project aimed at quality improvement in health care, a survey was conducted on current activities in university hospitals and on the attitudes of department heads towards quality assurance. The rationale for this survey was the need to obtain informa-tion on the situainforma-tions in which programmes are to be implemented in the university hospitals. In addition, a new health insurance law, scheduled for gradual application beginning in 1996, will require health care providers to implement "scientific and systematic measures to guarantee the quality and appropriateness of care ... ". It is
expected that university medical schools will play a leading role in the development and implementation of such measures.
A bibliographic search of the 1976 to 1995 Medline database, using quality assurance and attitude of health personnel as key words (as well as "attitude" or "opinion" as text words) revealed that surveys of opinions of clinical leaders toward quality assurance have been relatively scarce, the closest ones being a study on hospital leaders' opinions in the United States [1] and another one among surgical consultants in Great Britain [2]. Because little is known (or published) in this area, we report here the results of the Swiss survey.
Correspondence: J.P. Vader, Institut Universitaire de Medecine Sociale et Preventive, Rue du Bugnon 17, 1005 Lausanne, Switzerland, Fax: +41 21 314 73 73, Phone: +41 21 314 72 72, email: John-Paul.Vader@inst.hospvd.ch.
METHOD
Because involvement of clinical opinion lea-ders is a major predictive factor of success of quality improvement programmes [3], a series of meetings with leaders in clinical medicine in the five university hospitals was organized in order to discuss the project and obtain input on the content of the proposed survey. A questionnaire was constructed taking into account the opi-nions expressed at these preliminary meetings. It
included 49 questions divided into four sections, three of them labelled according to Donabe-dian's classification of constituents of quality of care (structure, process and outcome), with short definitions of each term, and a further section on characteristics of the respondents and their departments. Some of the questions pertained to actual activities of quality measurement and improvement, and others to opinions or atti-tudes towards quality assurance. The question-naire was formulated in French and German, so that respondents could answer in their working language. It was sent to 246 department heads,
whose names were obtained from lists of depart-ments provided by key informants in each university hospital, and included all clinical services in each institution. The mailing lists were used as received, although it later became evident that a number of recipients were not directly involved in patient care.
The questionnaire was anonymous and anon-ymity was further guaranteed through avoid-ance of publishing breakdown or sub-group analysis that, in the Swiss context, could easily
lead to identification of specific individuals, departments or hospitals.
The initial mailing was in June 1994, with a reminder being sent after 10 weeks. Quantitative results were analysed using the Epi Info software [4]. Responses to open-ended questions were manually coded.
RESULTS
Of246 questionnaires sent, 147 were returned, giving a global response rate of 60%. The proportion of non-clinical departments was significantly higher among non-responders (31.3% non-clinical departments, versus 6.1% among responders, p<O.Ol). Among respon-ders, departments considered non-clinical (9 respondents) were excluded (i.e., laboratories of clinical chemistry and haematology, plus insti-tutes· of pathology and biochemistry), giving results from 138 clinical departments. The response rate for clinical departments was 67% and did not differ significantly by hospital, ranging from 61% to 75% (Chi-square 2.43, P
=
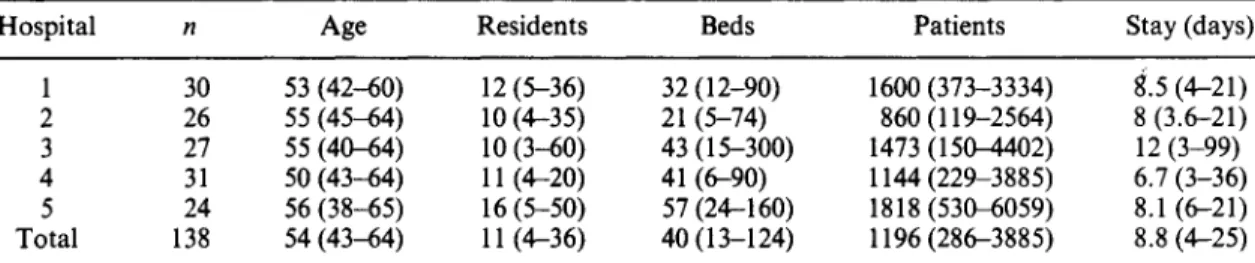
0.67). Respondents included at least one representative of every clinical specialty. Ques-tion-specific response rates ranged from 38% to 99% of the 138 analysed questionnaires.Table 1 shows data on respondents and their departments. There was considerable heteroge-neity among departments in terms of number of beds, physicians and patients. Three percent of department heads were female.
A detailed analysis of non-responders was not TABLE 1. Characteristics of respondents and their department. Median values; figures in parentheses are 1Oth and
90th percentiles
Hospital n Age Residents Beds Patients
1 30 53 (42-60) 12 (5-36) 32 (12-90) 1600 (373-3334) 2 26 55 (45-64) 10 (4-35) 21 (5-74) 860 (119-2564) 3 27 55 (40-64) 10 (3-60) 43 (15-300) 1473 (150-4402) 4 31 50 (43-64) 11 (4-20) 41 (6-90) 1144 (229-3885) 5 24 56 (38-65) 16 (5-50) 57 (24-160) 1818 (530-6059) Total 138 54 (43-64) 11(4-36) 40 (13-124) 1196 (286-3885) Legend
n: Number of of clinical department heads who answered the questionnaire
Age: Age of the respondent
Stay (days) 8.5 (4-21) 8 (3.6-21) 12 (3-99) 6.7 (3-36) 8.1 (6-21) 8.8 (4-25)
Residents: Number of physicians (internes, residents and chief-residents) training in the department Beds: Number of beds in the department
Patients: Number of patients treated in the department during 1993 Stay: Median of average length of stay per department.
Quality assurance in Swiss University Hospitals possible: a comprehensive data-base on depart-ment heads in university hospitals does not exist. In addition, the authors' commitment to con-fidentiality and anonymity precluded a search of additional information on non-responders.
A number of activities for measurement and improvement of structure, process and outcome of medical care were already in use, as shown in Table 2. These procedures tended to be concen-trated in some departments: for example, 62% had disease-specific guidelines, guidelines on appropriateness of some investigations and a mechanism to check the use of guidelines. At the other extreme, 5% of (clinical) department heads indicated that information on none of the four investigated elements concerning structure of medical care listed in Table 2 was available. And only 13% of heads said that they knew all three rates (mortality, adverse treatment effects and nosocomial infection) in their department. Regarding organization and initiatives of qual-ity assurance, 50% of the 138 responding clinical departments had an institutionalized responsi-bility for quality. The collaborative programmes referred to in Table 2 were: interdepartmental, inter-university, international, or with specialty
273 societies. It was up to the department heads to decide whether their programmes should be considered related to quality improvement.
Concerning the "person in charge of quality assurance", this was either a senior staff physi-cian (49%), a group (35%), a chief-resident (10%) or other (6%). In Swiss university hos-pitals, a senior staff physician is a fully qualified member of the permanent staff of the depart-ment; a chief-resident is not part of the perma-nent staff but is directly responsible for supervising residents who are doing their five years of practical specialty training after com-pletion of the six-year medical school.
Thirty eight percent of departments had a programme for improving drug prescription practices and 25% had a list of diagnostic tests that should not be ordered on a routine basis.
Information readily available to respondents on quality of care in their department was as follows: department mortality rate was known to 67% of respondents; the incidence of hospital infections in their own department was known to 34% and 31% had information on the propor-tion of patients having suffered important side-effects in their department. Fifty-eight heads of TABLE 2. Proportion of departments having institutionalized quality assurance
activities, according to department heads Quality assurance activity
Outcome:
Patient diagnostic statistics
Knowledge of department mortality rate
Patient satisfaction known through a questionnaire Knowledge of department rate of nosocomial infection Knowledge of department rate of adverse treatment effects Process:
Department clinical meetings Disease-specific guidelines
Guidelines on appropriateness of some investigations Mechanism to check the use of guidelines
Anatomo-patho-clinic confrontation
Collaborative programme related to quality improvement Programme for appropriate use of drugs
Structure:
Written document on tasks and responsibilities of staff members Person in charge of quality assurance
Rules against excess work load of staff in direct contact with patients Written document on quality assurance
*% of departments having the activity.
t 54% said that they do not have such rules.
%* 83% 67% 40% 34% 33% 98% 84% 80% 65% 63% 41% 38% 71% 50% <47% t 17%
department responded to the open question on how they would define an "important side effect". The array of responses could be divided into two groups: direct criteria (e.g., morbidity, complications, mortality, permanent impair-ment, decreased quality of life) and indirect criteria (i.e., modification of treatment, length of prolonged stay).
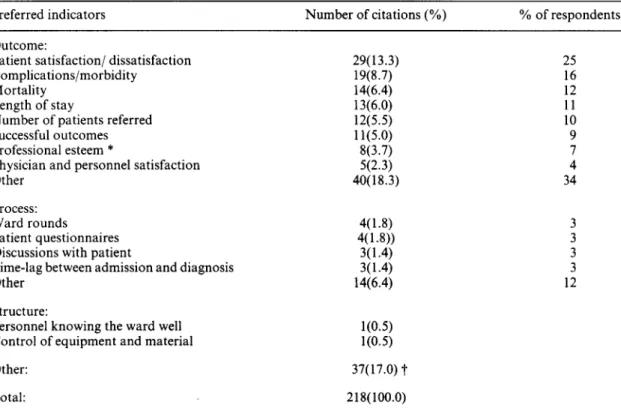
One hundred and sixteen respondents (79%) expressed their opinion on the best indicators for monitoring quality of care in their depart-ment (open-ended question). Answers were categorized as presented in Table 3. The vast majority (114 respondents, with 151 citations) proposed at least one indicator measuring an outcome of health care, according to Donabe-dian's classification of quality constituents [5]. A measure of patient satisfaction was mentioned at least once by 25% of respondents, while 16% favoured one or two measures of complications or morbidity and 12%, data on mortality.
Indicators pertaining to process or structure of care were mentioned by 13% of respondents.
The information that department heads would like to have in order to reasonably interpret mortality rates from their wards is presented in Table 4. Only 53 heads of depart-ment (38% of respondents) answered this ques-tion. Among those indicating that such information is not necessary for them, four explained that the mortality rate in their depart-ment was very low.
Barriers to implementation of quality assur-ance programmes were mainly attributed to lack of resources (Table 5). Obstacles classified as "psychological" were related to "self-satisfac-tion" of the medical personnel, or "lack of awareness of the problem of medical errors", etc. In spite of obstacles, 81% of respondents would be interested in comparing their depart-ment with others for quality of care and 69% felt some form of co-ordination among the five TABLE 3. Preferred indicators of quality in health care, according to 116 heads of clinical departments
(summary). Two answers per respondent were possible Preferred indicators
Outcome:
Patient satisfaction/ dissatisfaction Complications/morbidity
Mortality Length of stay
Number of patients referred Successful outcomes Professional esteem *
Physician and personnel satisfaction Other
Process: Ward rounds
Patient questionnaires Discussions with patient
Time-lag between admission and diagnosis Other
Structure:
Personnel knowing the ward well Control of equipment and material Other: Total: Number of citations (%) 29(13.3) 19(8. 7) 14(6.4) 13(6.0) 12(5.5) 11(5.0) 8(3.7) 5(2.3) 40(18.3) 4(1.8) 4(1.8)) 3(1.4) 3(1.4) 14(6.4) 1(0.5) 1(0.5) 37(17.0) t 218(100.0) % of respondents 25 16 12 11 10 9 7 4 34 3 3 3 3 12
*Professional esteem includes peer recognition and number of patients referred by colleagues to the department.
t37 Other:- 16 answers did not fit into any of Donabedian's categories- 12 answers were unintelligible or illegible- 9 answers were comments without any proposed indicator.
Quality assurance in Swiss University Hospitals TABLE 4. Desired additional information for inter-pretation of department mortality rate, according to 53
department heads
Number of Desired information citations Cause of death, autopsy report, diagnoses 15
Severity of illness 14
No information desired or necessary 10 Comparison with other departments 5
Patient age structure 4
Procedures 3
Simple, useful statistics 2
Total: 53
TABLE 5. Main obstacles to implementing a more ambitious departmental programme of quality
assur-ance, according to 119 department heads Main obstacle
Lack of personnel
Lack of computer facilities Lack of financial means Lack of agreement on methods Psychological obstacles
Lack of knowledge or information Total:
*Seven double answers.
Number of quotations 80 (64%) 14 (11 %) 11 (9%) 10 (8%) 7 (5%) 4 (3%) 126* (100%)
university hospitals for the promotion of quality in their field was necessary.
DISCUSSION
Deserved or not, Switzerland has a long-standing reputation for high quality in many fields, from watches to machines, with a special mention for chocolate and cheese. Health care is no exception and it might be surprising to discover that health care is just beginning to become a subject of formal assessment and improvement initiatives. One reason for this relatively late start of formal quality assurance initiatives could be that Swiss health profes-sionals, as well as patients and citizens, are all persuaded that they provide, or enjoy, the best possible health care, so there is no reason to
275
worry about quality. This study did not assess quality per se but focused on attitudes and practices related to its promotion.In response to the question on preferred indicators of quality, patient satisfaction (or dissatisfaction) came first. This was somewhat surprising, as this indicator is influenced by many factors other than medical care, especially in hospital settings. It must be noted that the question was open-ended, making it possible for respondents to give answers that did not necessarily follow Donabedian's structuring of quality measures. Be that as it may, comparing Table 2 and Table 3 reveals a striking mismatch. For example, despite the fact that clinical guide-lines are in common use, their use is not thought of as a good indicator of quality of health care in the department. In addition, only a small minority (12% of respondents) chose to mention mortality among the two indicators they would most favour, (whereas 67% of respondents were aware of the figures for their own department). The related question on desired additional information for the interpretation of depart-mental mortality rates (Table 4) raised little interest, with one of the lowest question-specific response rates. The fact that mortality rate attracts so little interest may point to an almost virgin context: Swiss hospitals have not had their death rates published, as has been the case in the United States and, more recently, in the United Kingdom [6-8]. In these countries, public release of hospital-specific mortality data has initiated wide debate and criticism in international jour-nals, and elsewhere, on the use and misuse of hospital "league tables". These debates could well have produced the cautious attitudes we observed towards mortality data in Switzerland. In a random sample of US hospitals, compared and ranked according to their death rates by the Health Care Financing Administration, 70% considered data on mortality rates as being of "poor" usefulness for improving quality [1], whereas 30% thought of them as of "fair" usefulness or better. In order for physicians to use mortality data in a reasonable way, key information needs to be available to them, making interpretation and constructive criticism possible. Our results point to an apparent unawareness of this fact. In view of the ease of obtaining crude mortality data, this indicator of quality will probably be quickly taken up in
Switzerland and the knowledge of its limitations is vital.
A lack of practice and knowledge in quality assurance was also apparent from other results presented here: a minority of departments were involved in a quality assurance programme stretching beyond their own confines. The incidence rates of important side-effects and/or nosocomial infections were unknown or unavail-able in two-thirds of departments. Indicators pertaining to process or structure of care were considered important by only 13% of respon-dents, revealing a possible lack of awareness of the importance of elements other than mere outcome in quality of health care. An additional clue to gaps in the system is the fact that "appropriateness of care" was mentioned only twice as a preferred indicator of quality, although this concept has been used in several clinical studies in Switzerland itself[9-12], and is explicitly mentioned in the new health insurance law.
University hospital department heads fre-quently mentioned both their interest in colla-borating in quality assurance programmes and their lack of means to carry out such pro-grammes: personnel, resources, information and consensus on methods for measuring quality of health care (Table 5). These elements are similar from those found by Karran et al. [2] among 57 surgical consultants, 75% of whom felt that "there were significant inadequacies in support staff, needed not only for assistance in collection and verification of data but also for subsequent analysis".
Among the limitations of the study is its relatively low response rate of 67% of clinical departments. For comparison, Karran et al. [2] obtained 72% from surgical consultants after two mailings and Berwick et al. [ 1] 78% from hospital leaders after four mailings plus a telephone call. We must consider that a possible selection bias might have occurred, with differ-ential participation of those heads of department most interested or active in promotion of health care quality. In that case, however, our findings of relatively low prevalence of quality improve-ment programmes may actually be overesti-mated. Although by general standards a response rate of two thirds is at the lower limit of acceptability, it was at the upper limit of our expectations. We had opted for a limited volume
of the questionnaire in an attempt to reach an optimum between precision of gathered infor-mation and response rate when surveying very busy individuals. Question-specific rates were uneven, raising questions about the possible appropriateness of some parts of the question-naire to some departments (e.g., not all depart-ments had in-patient beds).
Swiss physicians have not been subject to much inspection of their performance. This could make the Swiss health care system a suitable place for experimenting with implemen-tation of quality improvement programmes designed from scratch with the help of national leaders in clinical medicine. In such a context, it should be possible to avoid the reported impres-sion of "loss of control" occurring when "some-one else knows more about the impact of physicians' work than they do" [13).
New quality improvement programmes are planned in Switzerland for the near future, in the frame of both the current inter-university project and as a mandatory activity as a result of a new law coming into effect in 1996. This study was a first step towards the goal of collaborative quality of care programmes that would be welcome by those who provide care. It provided insight on what resources are needed by depart-ment heads: fair motivation, information and training on quality measurement and improve-ment techniques, and increased resources. For the latter, solutions will most likely have to be found in the framework of existing budgets. Concerning the lack of training, courses for clinical leaders will be offered in 1996 in the documentation, development and implementa-tion of quality assurance. It is hoped that Swiss
health care professionals will then be better able to approach and document a general five-star status (resembling neighbouring palace hotels), and fill in some odd holes - not all of them in cheese.
REFERENCES
1. Berwick D M and Wald D L, Hospital leaders' opinions of the HCFA mortality data. JAMA
263: 247-249, 1990.
2. Karran S J, Ranaboldo C J and Karran A, Review of the perception of general surgical staff within the Wessex region of the status of quality assurance and surgical audit. Ann R Col/ Surg Eng/75(4 suppl): 104-107, 1993.
Quality assurance in Swiss University Hospitals 3. Berwick D M, Sounding board: continuous
improvement as an ideal in health care. N Eng
J Med 320: 53-56, 1989.
4. Dean A G, Dean J A, Burton J H and Dicker R C, Epi Info, version 5. A word processing, database and statistics system for epidemiology and microcomputers. Centers for Disease Con-trol, Atlanta, USA, 1990.
5. Donabedian A, Evaluating the quality of medical care. Milbank Memorial Fund Quart 44: 166-206, 1966.
6. Anon, Dicing with death rates (editorial) The Lancet 341: 1183-1184, 1993.
7. Dean M, London perspective: Hospital mortality league tables. The Lancet 334: 1561., 1994. 8. McKee M and Hunter D, Mortality league
tables: Do they inform or mislead? Quality in Health Care 4: 5-12, 1995.
9. Gonvers J J, Burnand B and Froehlich F eta/.,
Adequation de l'endoscopie digestive haute dans une consultation de policlinique (Abstract).
277
Schweiz Med Wochenschr 123 Suppl 50/1: 18, 1993.10. Larequi-Lauber T, Vader J P, Burnand B, Fankhauser H, De Tribolet N and Paccaud F, Appropriateness of surgical cure for lumbar disc hernia (Abstract).Proceedings of the annual meet-ing of the International Society for Technology Assessment in Health Care. Baltimore, 1994. 11. Froehlich F, Pache I and Burnand B,
Appro-priateness of colonoscopy in two open-access endoscopy units. (Abstract) Gastroenterology
108: Al5, 1995.
12. Parret Th, Schneider R, Rime B, Saghafi L, Pannatier A and Francioli P, Evaluation de !'utilisation des antibiotiques: une etude prospec-tive dans un centre hospitalier universitaire.
Schweiz Med Wochenschr 123: 403-413, 1993. 13. Ellwood P M, Continuous improvement as an
ideal in health care. N Eng J Med 318: