microcompression experiment and
finite element simulation
Ruth Schwaigera)and Matthias Weber
Karlsruhe Institute of Technology (KIT), Institute for Applied Materials (IAM), 76021 Karlsruhe, Germany
Benedikt Moser
EMPA Thun, Swiss Federal Institute for Materials Testing and Research, Laboratory for Materials Technology, 3602 Thun, Switzerland; and Suisse Technology Partners Ltd., 8212 Neuhausen, Switzerland
Peter Gumbsch
Karlsruhe Institute of Technology (KIT), Institute for Applied Materials (IAM), 76021 Karlsruhe, Germany; and Fraunhofer Institute for Mechanics of Materials IWM, 79108 Freiburg, Germany
Oliver Kraftb)
Karlsruhe Institute of Technology (KIT), Institute for Applied Materials (IAM), 76021 Karlsruhe, Germany (Received 16 May 2011; accepted 14 July 2011)
Over the past two decades, nanoindentation has been the most versatile method for mechanical testing at small length scales. Because of large strain gradients, it does not allow for
a straightforward identification of material parameters such as yield and tensile strength, though. This represents a major drawback and has led to the development of alternative microscale testing techniques with microcompression as one of the most popular ones today. In this research, the influence of the realistic sample configuration and unavoidable variations in the experimental conditions is studied systematically by combing in-situ microcompression experiments on ultrafine-grained nickel and finite element simulations. It will be demonstrated that neither qualitative let alone quantitative analyses are as straightforward as they may appear, which diminishes the apparent advantages of microcompression testing.
I. INTRODUCTION
Over the past two decades, nanoindentation has been the most versatile method for mechanical testing at small length scales. Because of large strain gradients, it does unfortunately not allow for a straightforward identi fica-tion of material parameters such as yield and tensile strength. This represents a major drawback for the use of nanoindentation in the assessment of mechanical proper-ties of materials. This limitation together with significant progress in micromachining has led to the development of alternative microscale testing techniques with micro-compression1as one of the most popular ones today. The focused ion beam (FIB) technique is probably the most established method for fabricating pillars in (sub)micrometer dimensions. To date, a variety of FIB machined materials have been studied by microcompression,2including single crystalline pure metals and alloys, nanoporous and nano-crystalline metals, and amorphous metals.
Microcompres-sion promises to probe intrinsic materials properties as a function of decreasing sample size without the interference of strain gradients.3In general, a conventional nanoindenter with aflat-end tip is used to compress the pillar samples and facilitates the measurement of the load–displacement and hence the stress–strain curves of materials for pillar sizes ranging from several micrometers to sizes as small as 300 nm in diameter.4,5Indeed, it was demonstrated in several experimental6and computational7–10studies that the mechanical strength of single crystalline metallic pillars is directly related to the pillar diameter and the initial dislocation structures.
However, also in the case of microcompression, there are some limitations11,12: the pillars often exhibit imper-fections regarding their shape, which makes it difficult to evaluate to what extent the data is representative of the intrinsic material properties. Other sources of error are the misalignment between tip and pillar, the compliance of the sample base, and the friction between the indenter tip and the pillar. Zhang et al.13presented guidelines for the design of microcompression experiments based on a series offinite element (FE) simulations using an isotropic elastic–plastic constitutive law. They concluded that if done correctly, that is, controlling the fillet radius in relation to the pillar radius as well as the aspect ratio of the pillar, microcompression testing can be used to measure the
a)
Address all correspondence to this author. e-mail: [email protected]
b)
This author was an editor of this focus issue during the review and decision stage. For the JMR policy on review and publication of manuscripts authored by editors, please refer to http://www.mrs. org/jmr-policy
mechanical properties of mechanically isotropic materials with reasonable accuracy as well as to explore size effects in such materials.
Despite the difficulties in specimen preparation, micro-compression is extremely useful, when only a limited volume of material is available. This is often the case for ultrafine-grained (ufg) and nanocrystalline metals, which mostly are produced as foils or thin films or other ge-ometries of reduced dimensions. Although those geome-tries are in most cases suitable for uniaxial tension tests, the tensile ductility of ufg and nanocrystalline metals is rather low in comparison to the ductility of their coarse-grained counterparts and the tensile stress–strain curves show failure soon after the onset of yielding.14
There has been some success in developing
fine-grained metals with high strength and good ductility,15,16 even for grain sizes smaller than 100 nm,17,18 but in general, the limited strain hardening capacity at smaller grain sizes limits the uniform tensile elongation.19,20 Similarly, materials processing artifacts or the sample quality can be responsible for the relatively low strains to failure. Thus, compression tests are necessary to directly evaluate the strain-hardening response of a material as a function of strain. In compression tests, though, low strain hardening makes pillars prone to plastic buckling, indica-tions of which have indeed been observed in micrometer-sized nanocrystalline compression samples.21Although it was shown by FE simulation that the contact friction be-tween the indenter tip and the compression pillar helps to suppress plastic buckling,13 it is not yet clear how geo-metrical imperfections and other experimental uncertainties will influence the mechanical behavior if the material does not exhibit sufficient strain hardening.
In this study, the mechanical behavior of Ni with a nominal grain size of 200 nm was investigated by microcompression and FE simulations. The pillars of circular cross section and several micrometers in diameter were produced by FIB. Because of the still large ratio of pillar diameter to grain size, the deformation can be treated on a continuum basis in the FE simulations, rendering the material a good model material for system-atic investigations of the test method itself. Furthermore, for those dimensions, the influence of an ion-damaged layer can be neglected.22 The deformation experiments were conducted in-situ in a scanning electron microscope (SEM). Direct observation in the SEM allows for the determination of the instantaneous pillar shape based on the images extracted from recorded movies. The instanta-neous pillar geometry together with the load applied by the indenter gives much better access to the instantaneous applied stress than the usually determined simple engi-neering stress, which assumes that the pillar deforms symmetrically. This research is intended to numerically investigate the influence of the realistic sample configura-tion and unavoidable variaconfigura-tions in the experimental
conditions on the mechanical response. The experimentally determinedflow curve of the material was used as input for the FE simulations, and the influence of geometrical and material parameters on the mechanical behavior of the samples has been studied systematically. It will be demon-strated that neither qualitative let alone quantitative analyses are as straightforward as they may appear.
II. EXPERIMENTAL DETAILS A. Sample preparation
Electrodeposited Ni with a nominal grain size of 200 nm (procured from Integran Technologies, Mississauga, ON, Canada) was investigated. The actual average grain size of this ufg material was 320 nm as determined from quan-titative image analysis.23 The foil was carefully ground and polished on one side using SiC paper of 500, 1200, and 4000 grain size and diamond suspensions of 6, 3, 1, and 0.25lm grain size. The thickness of the foil (of 10-mm side length) after the polishing procedure was approxi-mately 100lm. It was glued onto an AI SEM stub using a standard cyanoacrylate glue. The free-standing micro-compression pillars were fabricated in a FEI Nova 200 NanoLab Dual Beam (FEI, Hillsboro, OR). The pillars were milled in a two-step process similar to that of Volkert and Lilleodden.4Thefirst step was a “rough cut,” which inv-olved milling a ring of 50lm in outer diameter, and leaving an inner area of 20lm diameter. The rough cut was perf-ormed using an accelerating beam voltage and beam current of 30 keV and 5 nA, respectively. The purpose of cutting away such a large area was to allow sufficient space for the indenter to come in contact with the pillar, rather than with the surrounding bulk material, and to allow for a good view during the in-situ compression tests. The “fine cut” then involved multiple steps to the desired diameter of 5lm at much lower beam currents to minimize Ga1-ion damage. “Single passes” were used and the dwell time was adjusted to obtain the pillar height for an approximate aspect ratio of at least 1:2. The actual dimensions were measured prior to testing in the SEM. The pillar fabrication with the sample surface normal to the FIB creates a slight taper of the pillar,4 which was approximately 4° for our pillars.
B. In-situ microcompression tests
The compression experiments were conducted in a Zeiss DSM 962 SEM equipped with a custom-built instrumented microindentation device, which has been described in detail in Ref. 24. The indenter is based on a load cell mounted on a piezo-actuated positioning stage. As described in Ref. 25, the setup was extended by another stick-slip positioning stage to allow full Cartesian posi-tioning of the specimen with respect to the indenter tip with several millimeters of positioning range. The com-pression tests were carried out using a diamondflat punch
of 10 lm diameter under open loop control, prescribing a rate of voltage increase on the piezo stack. The load on the sample and the displacement of the piezo stack were recorded. During the experiments, the SEM images were stored in a videofile. A pattern of small dots created by electron beam deposition [Fig. 1(a)] facilitates the quan-titative evaluation of the deformation from the video frames. The microcompression tests were typically per-formed with two intermediate unloading and reloading cycles, to observe the linear elastic response of the pillar. The samples were tested under constant displacement rate
of 10 nm/s. The load–displacement data shown were
corrected for compliance of the setup.
The increase in the column diameter was measured in four positions along the pillar axis during the deforma-tion. Because the pillar volume does not change as a result of the plastic deformation, the relative decrease in pillar height, which is measured in the experiment, is equivalent to the change of the transverse cross-sectional areas. Assuming that the cross-sectional areas remain circular, they can be directly determined from the pillar diameter. Thus, the change of the cross-sectional areas gives a direct assessment of the true strain, and together with the applied load, the true stress was determined.
III. DESCRIPTION OF THE FINITE ELEMENT SIMULATIONS
Three-dimensional FE simulations of the microcom-pression experiments were performed using ABAQUS (Standard Version 6.9-3; HKS, Pawtucket, RI). In the simulations, isotropic homogeneous material behavior without strain rate sensitivity was assumed. Eight-node linear hexahedron elements (C3D8) with full integration
were used for discretization. The length of the element edge was approximately 0.25lm in the pillar volume. The mesh consisted of about 60,000 elements. The compres-sion of the pillar was exerted by a rigid surface represent-ing theflat-end nanoindenter tip.
A. Geometrical model
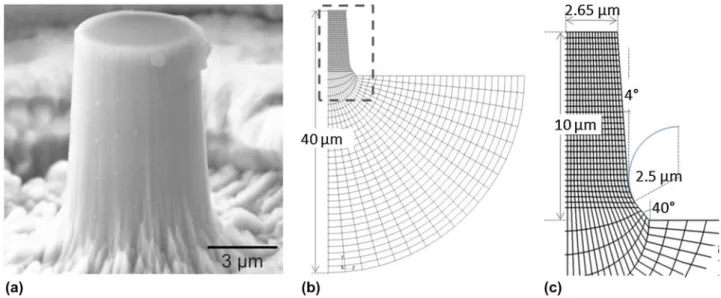
The goals of the simulations were twofold: In thefirst place, they aim at a better understanding of the mechan-ical response measured in the experiments. Thus, the shape of the“real” pillars was recreated in the geometrical model, and the true stress–true strain response of the material obtained from the in-situ microcompression tests was used as input material behavior. In addition, the deformation of a“perfect” cylindrical pillar of comparable dimensions was modeled to better understand the general influence of the experimental uncertainties. The cylindri-cal reference pillar had a height, diameter, and radius of the fillet between the base material and the pillar of 10, 5.3, and 2.5lm, respectively. The geometrical model had an overall side length of 40 lm, which brings the model boundaries sufficiently far away from the pillar to guar-antee that the boundary conditions have no significant influence on the mechanical quantities investigated. An overview of the FE geometry and details of the tapered FE pillar with the undeformed mesh are shown in Figs. 1(b) and 1(c), respectively. The parameters that were system-atically varied included the pillar taper, the misalignment between pillar and indenter tip, and the friction between the pillar surface and the indenter tip. To model our experiments, a friction coefficient l of 0.12 was used, as determined from sliding experiments with a spherical di-amond tip. The friction coefficient measurement was based
FIG. 1. The micropillars were prepared by focused ion beam (FIB) with the sample surface normal to the ion beam. (a) The preparation procedure resulted in a taper of approximately 4°. The pattern of small dots was created by electron beam deposition and helps to evaluate the pillar deformation quantitatively. (b) The geometry of the model. (c) The details of the pillar shape as represented in thefinite element (FE) model. The pillar diameter, height, and taper correspond to the actual dimensions. The pillar base reflects the shape typical of the preparation method.
on a slow sliding velocity and is thus close to the static friction coefficient. The measured value of 0.12 is between 0.1 and 0.15, typical of well-polished metallic surfaces and diamond.26The simulation parameters are summarized in Table I. The misalignment of the experimental setup was considered by tilting the pillar with respect to the normal axis of the rigid surface representing the indenter. For perfect alignment, the pillar surface was perpendicular to the indenter axis. In the simulations, the rigid surface moved at a constant velocity to a maximum value of 3lm. After loading, the sample was unloaded at the same rate.
B. Material parameters
The input stress–strain curve was represented by a piecewise linear approximation. The influence of the general materialflow behavior was investigated assuming three different behaviors: ideal plastic, softening, and hardening behavior with only small variations in the slopes of the curves, as shown in Fig. 2. A Young’s modulus of 220 GPa and and a Poisson’s ratio of 0.3 were used, which are reasonable values for Ni.
IV. RESULTS AND DISCUSSION A. In-situ microcompression
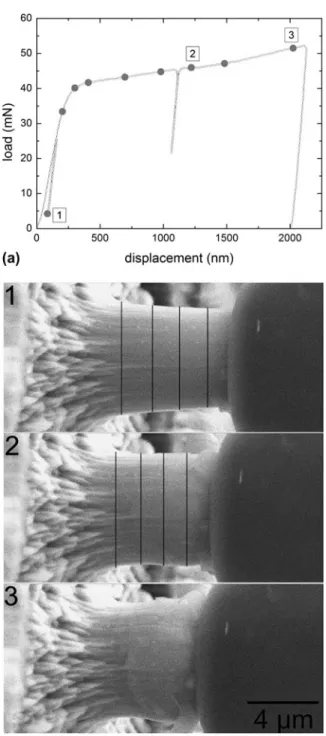
Figure 3(a) shows a representative experimentally de-termined loading curve with three load–unload sequences.
During thefirst unload–reload in the elastic regime, the loading curve exhibits a slightly steeper slope as a conse-quence of adjustments of the pillar to the indenter tip, which has not been perfectly aligned. During plastic deformation, the force keeps increasing with increasing displacement. In Fig. 3(b), three SEM images recorded during the experiment are shown at different stages of the deformation as marked in the load–displacement curve in Fig. 3(a). The four parallel lines in Fig. 3(b) represent the four positions along the pillar axis, in which the local true cross-sectional area was determined. As can be seen, the pillar exhibits strong barreling, which affects the apparent hardening behavior or, more generally speaking, yields significant inaccuracies in the engineering stress versus strain curves.12Because of the tapered geometry of the micropillar, the stress throughout the pillar is not homogeneous and the simple analysis used for calculating engineering stress–strain curves does not capture the complexity of the deformation. For example, a computa-tional study has reported an overestimation of the elastic modulus and the yield stress as a result of pillar taper.13 Given that the pillar shown in Fig. 1(b) had a sidewall taper angle of approximately 4°, it is expected that the top of the pillar experienced a larger imposed stress during compression, resulting in inhomogeneous plastic defor-mation localized at the pillar top.
True stress and true strain determined from image analysis are shown in Fig. 4. Figure 4(a) shows the true plastic strain versus the displacement of the indenter tip for the four lines in Fig. 3(b). As can be seen, the true plastic strain increases with increasing displacement along all positions on the pillar. Furthermore, plastic strain is not distributed homogeneously over the pillar height; there is a clear increase in plastic strain from bottom to top, which is related to the initial taper. The pillar top experiences the largest plastic strains, while the pillar base shows almost no deformation at all. In experiments on tapered single crystalline4and amorphous samples27 plastic deformation was also observed to be most pronounced at the pillar top. Based on the image analysis, it is possible to plot the true stress versus the true plastic strain as shown in Fig. 4(b) for the four positions indicated in Fig. 3(b).
Figure 4(b) demonstrates that after initial hardening in the early stages of plastic deformation up to plastic strains of approximately 0.05, the electrodeposited ufg Ni exhibits softening behavior with increasing strain. The apparent strain hardening at small strains may result from a gradual involvement of the grains in the plastic deformation as a result of the range of grain sizes present in the sample. The average grain size of the ufg Ni is in the range where dislocations dominate the deformation pro-cess,28but the number of stored dislocations appears not to be sufficient to result in further increases in the flow stress with increasing deformation.
TABLE I. Parameters used in thefinite element simulations.
Diameter of pillar top 5.3lm
Height 10.0lm
Fillet radius of cylindrical pillars 2.5lm
Taper 0–4°
Misalignment angles 0–3° Friction coefficient 0–0.12
FIG. 2. Input stress–strain curves for the parameter study conducted by FE simulations.
True stress–true strain curves, which are flat in the plastic regime,29 and strain softening30 have also been observed in compression tests of ufg metals processed by severe plastic deformation (spd). It has been suggested that dynamic recovery prevents the accumulation of defects
and thus prevents strain hardening in ufg spd metals.29 However, the microstructures of spd-processed metals are in general very different from those of electrodeposited samples with respect to the grain boundary structure and the defect density,31 and the results are therefore not directly comparable.
Recrystallization may be another reason for the strain softening observed in the electrodeposited ufg Ni; the initially strain-hardened microstructure would then be transformed through nucleation of new crystallites, which would imply the motion of grain boundaries and thus the development of a new microstructure with typically different grain size. Detailed microstructural investiga-tions of the deformed pillars would be necessary, which are beyond the scope of this study.
The stress–strain behavior determined from the in-situ microcompression experiment [Fig. 4(b)] corresponds to the piecewise linear approximation of the softening behavior used as input for the FE simulations (Fig. 2). The FE load–displacement curve for softening behavior FIG. 3. In-situ micropillar compression. (a) Load–displacement curve
with intermediate unloads to obtain an estimate of the elastic modulus of the material. The video frames were analyzed for different displace-ments as indicated by the full symbols. (b) Video frame sequence showing the compression experiment. The four lines across the pillar mark the four positions, where the diameter change of the pillar was determined throughout the experiment. The frames shown correspond to displacements in (a) marked with corresponding numbers.
FIG. 4. True strain and true stress of ultrafine-grained (ufg) Ni de-termined from the in-situ microcompression experiment. (a) Distribu-tion of the plastic strain along the pillar axis determined in four posiDistribu-tions as shown in Fig. 3(b). (b) True stress versus true plastic strain reflecting strain softening of the ufg Ni investigated.
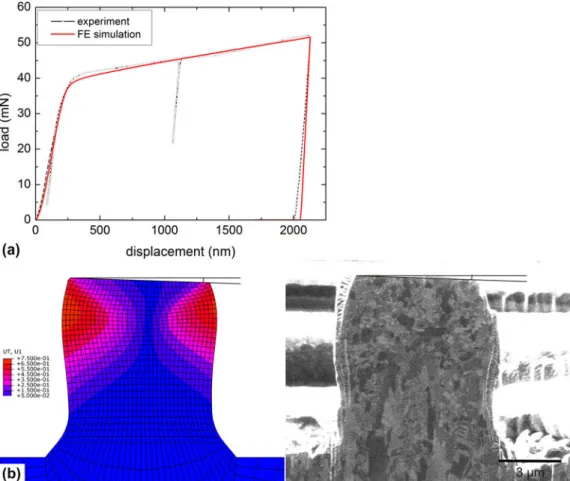
and a geometrical model with a misalignment angle of 2° shows good agreement with the experimental data [Fig. 5(a)]. The slopes of the unloading curves in particular at the beginning of unloading, which is typically used for elastic modulus determination, are almost identical in experiments and simulation. While the start of plastic deformation is well captured, there are slight deviations in the loading curve during plastic deformation. Deviations from the experimental behavior can be expected since the assumption of linear softening behavior is rather simple. Also, further optimization of other parameters might im-prove the match of the curves. However, we would like to point out that nofitting process was involved. The angle between the surface of the deformed pillar and the sample surface was measured to be 2° [Fig. 5(b)], and, indeed, the computational and experimental pillars exhibit very similar shapes. Both pillars are shown after thefinal un-loading. To obtain a better understanding of the different model parameters, they were systematically varied, as described below.
B. Effect of the material yield behavior
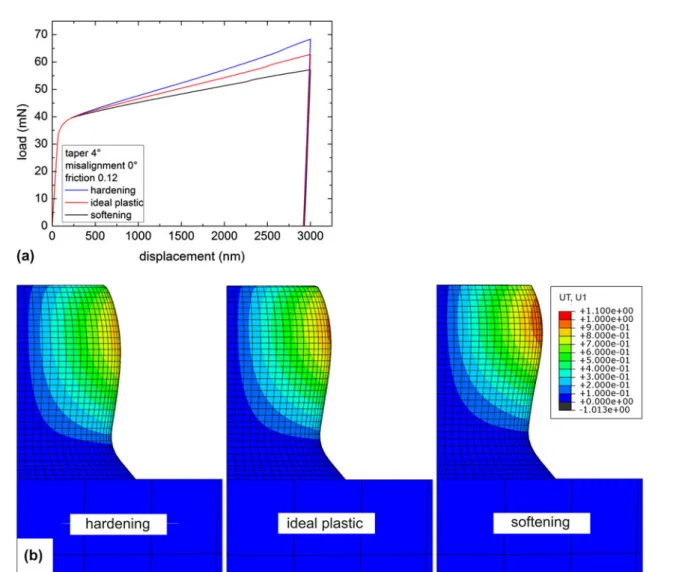
Small variations in the material flow curve may have an effect on the load–displacement curves. In this study, in addition to softening behavior, ideal elastic–plastic behavior and hardening with the same amount in the hardening rate as in softening were investigated. The results are shown in Fig. 6. The FE pillar had a taper of 4° and was loaded with perfect alignment between tip and pillar. The three load–displacement curves in Fig. 6(a) have very similar shapes with a stretched transition from elastic to plastic behavior. Similar observations on nano-crystalline Pd were attributed to hardening behavior.20All curves in Fig. 6(a) exhibit an increase in load with increasing displacement with the slope being largest for hardening. Based on those curves and applying basic textbook analyses to estimate the engineering stress–strain behavior, strain hardening would be inferred for all input flow curves. The geometrical hardening for an aspect ratio of 2° and 4° taper is significant, and the small variations in theflow behavior have a relatively small effect on the
FIG. 5. Comparison of experimental and computational results. (a) The load–displacement curves show good agreement. The stress–strain curve determined based on image analysis was approximated by piecewise linear functions and used as input for the FE simulations. (b) The cross section through the center of the FE model after unloading reveals a shape and dimensions similar to the ufg pillar. The radial displacement (also shown by the coloring) is not symmetric because of the misalignment, which was determined to be approximately 2°. The ufg pillar was cross sectioned and imaged using a FIB. The pillar is shown at an angle of approximately 88°, and the cross section was accidentally set slightly off-center. Prior to cross sectioning, Pt was deposited, which can be seen to partially cover the pillar sidewalls.
load–displacement curves. After deformation, the pillar shapes show only small differences. Because of the con-straints at the pillar top and at the base, all pillars exhibit barreling, which is most pronounced for the softeningflow curve, as shown by the larger displacement of the material in Fig. 6(b).
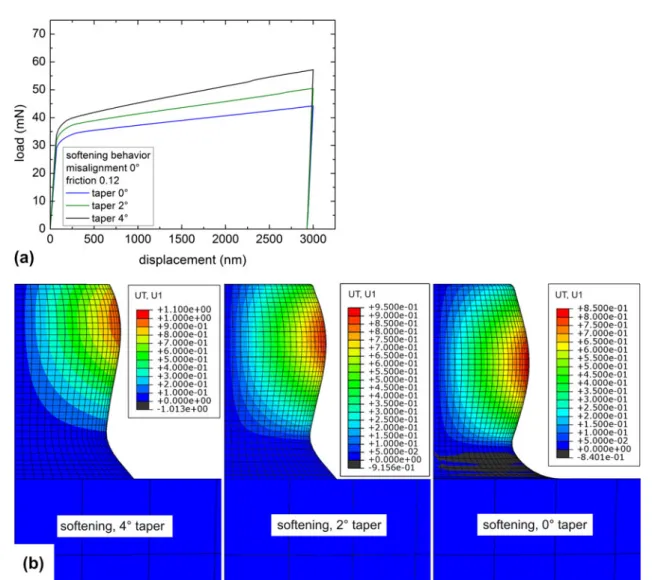
C. Taper effects
While the hardening (or softening) behavior of the material affects the geometry of the deformed pillar [Fig. 6(b)], the pillar taper causes additional changes of the geometry and geometrical hardening. The taper angle significantly influences the loading response as shown in Fig. 7(a) for the case of material softening. For all three taper angles shown, even for the cylindrical pillar, the load increases with increasing displacement, which appears to reflect hardening behavior. While the effect on the slope in the elastic regime is small for the taper angles investigated, as reflected in both the loading and the unloading portions
of the curves, the differences in the plastic regime are more pronounced. In general, the deviations of the mechanical response from the load–displacment of the cyclindrical pillar increase with increasing pillar taper. With respect to the pillar shape, a cylindrical pillar exhibits a more symmetrical contour than the tapered pillars [Fig. 7(b)], and the maximum displacement of the deformed material in the x-direction is smaller than in the case of 2° and 4° taper angles. Since the differences of the load–displacement curves are small in the elastic regime, errors in the ex-perimental determination of the elastic modulus are mainly caused by errors in the determination of the relevant cross-sectional area. Following the same line of reasoning, errors in the experimentally determined yield stress and strain hard-ening are more pronounced. The latter is seen in Fig. 7(a) as different slopes in the plastic loading regime. A higher initial yield point and errors in the elastic modulus were observed in isotropic FE simulations of tapered columns for bilinear hardening behavior.13
FIG. 6. Influence of the material flow curve. The deformation behavior of a tapered pillar (with 4° taper angle) was investigated for three different flow curves. 0° misalignment and a friction coefficient of 0.12 were assumed. (a) The load–displacement curves for three different material flow curves all result in increasing load with increasing displacement. (b) Deformed shape (color indicates displacement in the horizontal direction) of the unloaded pillar for the three differentflow curves.
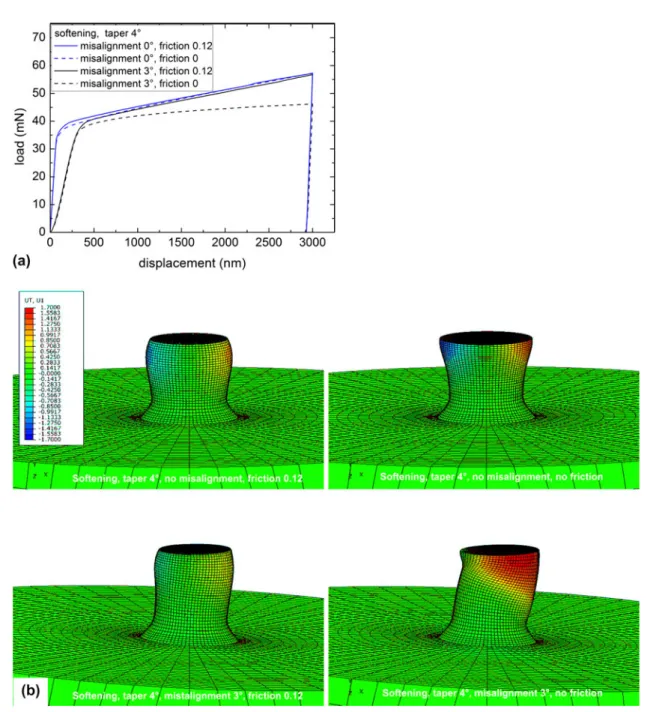
D. Influence of misalignment and friction
In the case of tapered pillars and perfect alignment between pillar and indenter tip, friction has only a small influence on the load–displacement curves, as can be seen in Fig. 8(a) for the case of material softening. Neverthe-less, the deformed shape in the absence of friction is very different [Fig. 8(b)]. For perfect alignment, the pillars deform symmetrically and the constraint effect as a result of friction is clearly visible. Friction prevents the lateral movement of the top surface during the experiment.
For a misalignment of 3°, the elastic loading portion of the curve exhibits a very different slope, whereas the misalignment has almost no effect on the unloading slope. It is interesting to note that there is little difference in the slope of the curves in the plastic regime for 3° misalign-ment. However, in the absence of friction, the misalignment
causes a more abrupt transition from elastic to plastic behavior and a reduced slope in the plastic regime, whereas no significant effect on the elastic part was observed. Deformation localizes close to the pillar top, and bending becomes more prominent resulting in a plastic instability [Fig. 8(b)], which is also reflected in the reduced slope of the load–displacement curve in the plastic regime.
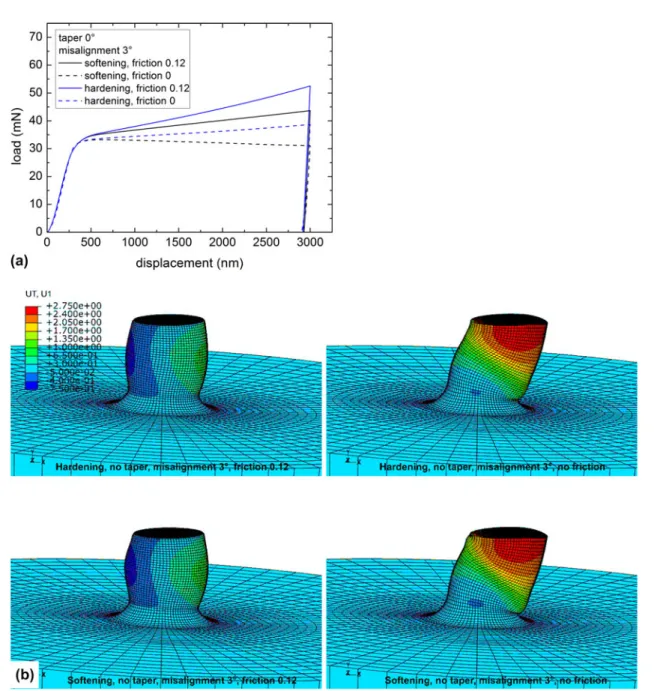
The taper in general reduces the stress concentrations at the base and also the strain localization since the stresses are highest at the top. The influence of friction and misalignment is more pronounced in the case of cylindrical pillars. This is illustrated in Fig. 9(a) for both hardening and softening behaviors and a misalignment angle of 3°. For both behaviors, the load–displacement curves exhibit abrupt transitions from elastic to plastic deformation in the absence of friction. Also, the slope of FIG. 7. Influence of taper angle on the deformation behavior of micropillars for material softening. (a) Load–displacement curves for 0°, 2°, and 4° taper angles with only little difference in the elastic regimes. The onset of yield and the geometrical hardening effect increase with increasing taper angles. (b) Shape comparison for 0°, 2°, and 4° taper angles after unloading (color indicates the displacement in the horizontal direction). For higher taper angles, deformation localizes closer to the pillar top. In all cases, barreling as a result of friction and the solid connection to the substrate is observed.
the load–displacement curves in the plastic regime is re-duced; in the case of softening, the load even decreases with further displacement. Both observations are indica-tive of plastic instability, which can also be inferred from the deformed pillars shown in Fig. 9(b). Interestingly, the slope of the load–displacement curve in the plastic regime is higher for material softening and contact friction than for material hardening in the absence of friction. The effects of friction between the tip and the pillar are ap-parently more prominent than the difference between the material behaviors themselves. In the case of cylindrical pillars and misalignment, the main issue is the occurrence of
plastic instability, which can clearly be seen in Fig. 9(b). The localization of deformation at the pillar top and the plastic instability starting close to the pillar base were observed for both material hardening and softening behav-iors. The stabilizing effect of friction can also be seen here for both material behaviors.
Zhang et al.13and Raabe et al.32investigated the effect of friction by isotropic continuum FE simulations and anisotropic crystal-plasticity FE simulations, respectively. In both studies, plastic instabilities occurred at smaller strains when the samples had a larger aspect ratio (diameter to height) or lower friction coefficients, in agreement with FIG. 8. Influence of friction and misalignment for a pillar with 4° taper and material softening. (a) Load–displacement curves for misalignment angles of 0° and 3° with and without friction. (b) Deformed pillars after unloading for misalignment angles of 0° and 3° with and without friction. Bending becomes more pronounced when pillar and tip are not well aligned and in the absence of friction. Friction stabilizes the pillar. (Color indicates displacement in the horizontal direction.)
our results. It was shown that for single-slip orientations and zero friction, the stress–strain curves were not significantly affected by plastic instabilities if the samples had an aspect ratio of 2–3 (at small strains of approximately 5%). However, as shown above for the cylindrical pillars with an aspect ratio of 2 and for the cases of material softening behavior or a low rate of strain hardening, friction between pillar and tip is critical to prevent the localization of shear and plastic instability even for such low strains.
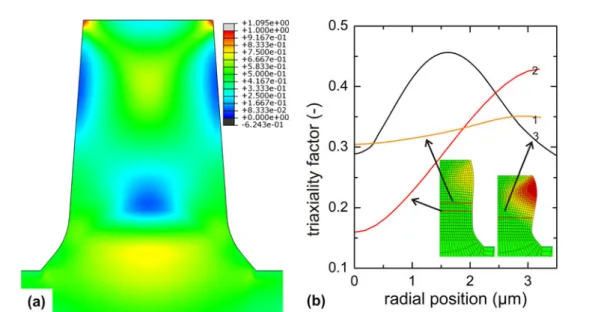
E. Stress multiaxiality
The stress state of the pillars tested in microcompres-sion is often assumed to be uniform. However, the
constraints due to friction and at the pillar base lead to a multiaxial stress state and higher shear stresses at the sample top. To quantify these effects for our experiment, we have analyzed the triaxiality factor, which is defined as the ratio of hydrostatic stress to the equivalent “von Mises” stress. This factor becomes 0 for pure shear and 1/3 for uniaxial loading. In Fig. 10(a), the triaxiality factor is shown for a pillar of 4° taper deformed to a displacement of 1.5 lm, which corresponds to half of the maximum deformation in the simulations and an engineering strain of 15%. The constraint effects at the contact with the tip and at the pillar base together with the aspect ratio of 2 result in a multiaxial stress state that varies over both the pillar FIG. 9. Friction influence on cylindrical pillars deformed at 3° misalignment. (a) Load–displacement curves for material hardening and softening. Friction has little effect in the elastic regime, while for both material behaviors the slope in the plastic regime is reduced in the absence of friction. (b) Deformed pillars after deformation at 3° misalignment with and without friction. (Color indicates displacement in the horizontal direction.)
height and the cross sections. Only at approximately half the pillar height, a uniform and almost uniaxial stress state is observed as shown in Fig. 10(b) (orange curve). Here, the triaxiality factor is plotted versus the distance from the pillar center for different levels of deformation. While for 1.5-lm displacement a region of almost uniform uniaxial deforma-tion could be identified, for 3-lm displacement or 30% engineering strain no such region exists. The interference of the contact friction and constraints of the pillar base become more prominent with increasing displacement. These con-straints are also relevant to cylindrical pillars, which was also observed in crystal plasticity FE simulations of single-crystal micropillars.33,34Experimentally, the heterogeneity of the stress field was observed to affect the evolution of dislocation structures and the stress–strain response of the single-crystal pillars.33
V. CONCLUSIONS
In the past few years, microcompression testing has been established and was used to investigate size effects in mechanical behavior of materials. Typically, it was stated that these experiments offer, compared with con-ventional indentation, the advantage that the applied stress state is uniaxial and that it is straightforward to determine stress–strain curves quantitatively at small scale for a wide variety of materials. Although the determination of flow stresses at small plastic strains, which are often reported in the literature, is somewhat less affected, our results clearly indicate that the measured load–displacement curves are the result of a complex interplay of material behavior, pillar taper, friction between pillar and indenter
tip, and misalignment of the pillar with respect to the loading axis. As shown in this work, for materials with small strain hardening or strain softening, the effect of misalignment, friction, and taper can even become pre-dominant in controlling the overall load–displacement behavior out balancing the actual material properties. Un-fortunately, these factors are largely unknown or are difficult to be avoided in the experiment.
It is seen that the exact shape of the deformed pillar depends sensitively on these factors even when similar loading responses are determined. Therefore, a combina-tion of experiments, including in-situ observacombina-tion of the pillar shape, and FE simulation allow for a quantitative analysis of the stress–strain behavior (see Fig. 3). Thus, it was possible to show, to the best of our knowledge, for the first time softening behavior in electrodeposited ufg Ni. However, the analysis is very costly. Furthermore, the analysis has only been possible since the plastic deforma-tion could be modeled on a continuum basis. This can be justified if the microstructural length scale, that is, the grain size, is much smaller than the pillar diameter. If this is not the case, the approach is no longer valid and mesoscopic models need to be applied, and the interplay of material behavior, sample size, and experimental conditions become even more complex.
For certain conditions in our simulations, we have seen shear instabilities, which may relate to frequently ob-served formation of shear bands in materials such as nanocrystalline or amorphous metals. In particular, decreasing friction between tip and pillar or increasing misalignment promotes these instabilities. Particular care needs to be taken when studying size effects in this FIG. 10. Nonuniform stress state of the pillar with 4° taper angle and material softening. The tip and the pillar were perfectly aligned, and a friction coefficient of 0.12 was assumed. (a) The triaxiality factor (defined as the ratio of hydrostatic stress to equivalent “von Mises” stress) for 1.5-lm displacement is plotted on the original geometry with almost uniform and uniaxial stress at approximately half the pillar height. (b) Triaxiality factor for 1.5-lm and 3-lm displacements at different positions along the pillar height over the radial distance from the pillar center.
context as it becomes more difficult to control experi-mental conditions for smaller pillars.
ACKNOWLEDGMENT
Funding by the German Research Foundation DFG (SCH855/4-1) within the DFG Research Group FOR714 is gratefully acknowledged.
REFERENCES
1. M.D. Uchic, D.M. Dimiduk, J.N. Florando, and W.D. Nix: Sample dimensions influence strength and crystal plasticity. Science 305 (5686), 986 (2004).
2. J.R. Greer and J.T.M. De Hosson: Plasticity in small-sized metallic systems: Intrinsic versus extrinsic size effect. Prog. Mater. Sci. 56 (6), 654 (2011).
3. W.D. Nix, J.R. Greer, G. Feng, and E.T. Lilleodden: Deformation at the nanometer and micrometer length scales: Effects of strain gradients and dislocation starvation. Thin Solid Films 515(6), 3152 (2007).
4. C.A. Volkert and E.T. Lilleodden: Size effects in the deformation of sub-micron au columns. Philos. Mag. 86(33), 5567 (2006). 5. D. Jang and J.R. Greer: Size-induced weakening and grain
boundary-assisted deformation in 60 nm grained Ni nanopillars. Scr. Mater. 64(1), 77 (2011).
6. O. Kraft, P.A. Gruber, R. Mönig, and D. Weygand: Plasticity in confined dimensions. Annu. Rev. Mater. Res. 40, 293 (2010). 7. T.A. Parthasarathy, S.I. Rao, D.M. Dimiduk, M.D. Uchic, and
D.R. Trinkle: Contribution to size effect of yield strength from the stochastics of dislocation source lengths in finite samples. Scr. Mater. 56(4), 313 (2007).
8. J. Senger, D. Weygand, P. Gumbsch, and O. Kraft: Discrete dislocation simulations of the plasticity of micro-pillars under uniaxial loading. Scr. Mater. 58(7), 587 (2008).
9. C. Motz, D. Weygand, J. Senger, and P. Gumbsch: Initial dislocation structures in 3-D discrete dislocation dynamics and their influence on microscale plasticity. Acta Mater. 57(6), 1744 (2009).
10. J. Senger, D. Weygand, C. Motz, P. Gumbsch, and O. Kraft: Aspect ratio and stochastic effects in the plasticity of uniformly loaded micrometer-sized specimens. Acta Mater. 59(8), 2937 (2011). 11. Z.W. Shan, R.K. Mishra, S.A. Syed Asif, O.L. Warren, and
A.M. Minor: Mechanical annealing and source-limited deformation in submicrometre-diameter Ni crystals. Nat. Mater. 7(2), 115 (2008). 12. D. Kiener, C. Motz, and G. Dehm: Micro-compression testing: A critical discussion of experimental constraints. Mater. Sci. Eng., A 505(1-2), 79 (2009).
13. H. Zhang, B.E. Schuster, Q. Wei, and K.T. Ramesh: The design of accurate micro-compression experiments. Scr. Mater. 54(2), 181 (2006).
14. C.C. Koch: Ductility in nanostructured and ultra fine-grained materials: Recent evidence for optimism. J. Metastable Nanocryst Mater 18, 9 (2003).
15. R.Z. Valiev, I.V. Alexandrov, Y.T. Zhu, and T.C. Lowe: Paradox of strength and ductility in metals processed by severe plastic deformation. J. Mater. Res. 17(1), 5 (2002).
16. Y. Wang, M. Chen, F. Zhou, and E. Ma: High tensile ductility in a nanostructured metal. Nature 419, 912 (2002).
17. L. Lu, L.B. Wang, B.Z. Ding, and K. Lu: High-tensile ductility in nanocrystalline copper. J. Mater. Res. 15(2), 270 (2000). 18. K.M. Youssef, R.O. Scattergood, K.L. Murty, J.A. Horton, and
C.C. Koch: Ultrahigh strength and high ductility of bulk nano-crystalline copper. Appl. Phys. Lett. 87, 091904 (2005).
19. E. Ma: Instabilities and ductility of nanocrystalline and ultra fine-grained metals. Scr. Mater. 49(7), 663 (2003).
20. L. Kurmanaeva, J. Ivanisenko, J. Markmann, K. Yang, H-J. Fecht, and J. Weissmüller: Work hardening and inherent plastic instability of nanocrystalline metals. Phys. Status Solidi RRL 4(5–6), 130 (2010).
21. Q. Wei, Z.L. Pan, X.L. Wu, B.E. Schuster, L.J. Kecskes, and R.Z. Valiev: Microstructure and mechanical properties at different length scales and strain rates of nanocrystalline tantalum produced by high-pressure torsion. Acta Mater. 59, 2423 (2011).
22. D. Kiener, C. Motz, M. Rester, M. Jenko, and G. Dehm: FIB damage of Cu and possible consequences for miniaturized mechan-ical tests. Mater. Sci. Eng., A 459(1–2), 262 (2007).
23. R. Schwaiger, B. Moser, M. Dao, N. Chollacoop, and S. Suresh: Some critical experiments on the strain rate sensitivity of nano-crystalline nickel. Acta Mater. 51(17), 5159 (2003).
24. R. Rabe, J.M. Breguet, P. Schwaller, S. Stauss, F.J. Haug, J. Patscheider, and J. Michler: Observation of fracture and plastic deformation during indentation and scratching inside the scanning electron microscope. Thin Solid Films 469, 470, 206 (2004).
25. B. Moser, K. Wasmer, L. Barbieri, and J. Michler: Strength and fracture of Si micropillars: A new scanning electron microscopy-based micro-compression test. J. Mater. Res. 22 (4), 1004 (2007).
26. D. Tabor: Hardness of Metals (Clarendon Press, Oxford, 1951). 27. Y.H. Lai, C.J. Lee, Y.T. Cheng, H.S. Chou, H.M. Chen, X.H. Du,
C.I. Chang, J.C. Huang, S.R. Jian, J.S.C. Jang, and T.G. Nieh: Bulk and microscale compressive behavior of a Zr-based metallic glass. Scr. Mater. 58(10), 890 (2008).
28. M. Dao, L. Lu, R.J. Asaro, J.T.M.D. Hosson, and E. Ma: Toward a quantitative understanding of mechanical behavior of nano-crystalline metals. Acta Mater. 55(12), 4041 (2007).
29. Y.M. Wang and E. Ma: Strain hardening and strain rate sensitivity of ultrafine-grained metals. J. Metastable Nanocryst. Mater. 17, 55 (2003).
30. D. Jia, Y.M. Wang, K.T. Ramesh, E. Ma, Y.T. Zhu, and R.Z. Valiev: Deformation behavior and plastic instabilities of ultrafine-grained titanium. Appl. Phys. Lett. 79(5), 611 (2001).
31. R.Z. Valiev, R.K. Islamgaliev, and I.V. Alexandrov: Bulk nano-structured materials from severe plastic deformation. Prog. Mater. Sci. 45(2), 103 (2000).
32. D. Raabe, D. Ma, and F. Roters: Effects of initial orientation, sample geometry and friction on anisotropy and crystallographic orientation changes in single crystal microcompression deforma-tion: A crystal plasticityfinite element study. Acta Mater. 55(13), 4567 (2007).
33. P.A. Shade, R. Wheeler, Y.S. Choi, M.D. Uchic, D.M. Dimiduk, and H.L. Fraser: A combined experimental and simulation study to examine lateral constraint effects on microcompression of single-slip oriented single crystals. Acta Mater. 57(15), 4580 (2009).
34. Y.S. Choi, M.D. Uchic, T.A. Parthasarathy, and D.M. Dimiduk: Numerical study on microcompression tests of anisotropic single crystals. Scr. Mater. 57(9), 849 (2007).