SCIENTIFIC ARTICLE
Detection of small tendon lesions by sonoelastographic
visualization of strain profile differences: initial experiences
Aline R. Buck&Nina Verstraete&Yufei Li&
Andreas Schweizer&Jess G. Snedeker&Florian M. Buck
Received: 25 October 2011 / Revised: 9 December 2011 / Accepted: 11 December 2011 / Published online: 5 January 2012 # ISS 2012
Abstract
Purpose To assess the capability of a commercial sonoelas-tography system to detect small tendon lesions by quantita-tive analysis of elastogram profiles.
Materials and methods Strips of equine digital flexor dons were used to model small human tendons. Two ten-dons were examined. From each tendon, six unmodified tendon strips (controls) and six tendon strips with a central defect of the same tendons were compared. The tendon strips were placed under a physiological tensile strain of 5%. Sonoelastographic visualization of the strain profile was performed. Regions of interest (ROI) were defined left and right of the tendon defects. Average tissue strains in these ROI were compared with tissue strain in controls. Results In the first series of experiments, there was a sig-nificant (p00.011) difference in the strain profile in regions proximal and distal to the tendon lesions compared with the respective tendon areas in the control tendon strips. In a
second series of experiments, similar trends were observed, but the differences were not significant (p00.824).
Conclusion Even under carefully controlled experimental conditions using computational post-processing of sonoe-lastograms, tendon lesions could only be partially detected within elastograms from a clinical sonoelastography system. The ability to detect differences in some strain profiles indicates that tensile sonoelastography has the potential to identify small tendon lesions (such as those in the hand), but that substantial improvements with respect to quantitative analysis are required to make such measures diagnostically relevant.
Keywords Sonoelastography . Small tendon lesions . Strain profile
Introduction
Elastography is a method of quantitative imaging of the dis-tribution of biological tissue strains and elastic modulus [1,2]. “Strain” is a dimensionless ratio of length change of a de-formed material to its original unloaded length. Sonoelastog-raphy (SE), the combination of elastogSonoelastog-raphy and ultrasound, has been evaluated in various diagnostic situations in clinical radiology. It has been proven to be a reliable and useful modality that is complementary to conventional ultrasound in the evaluation of lesions in the liver, spleen, female breast, lymph nodes, thyroid, and prostate, to name the most impor-tant fields of recent research activity [3–8].
The experience with SE in musculoskeletal radiology has until now been very limited. So far, publications have mainly focused on the evaluation of degenerative changes to the Achilles tendon and patellar tendon, and strain quantification in tendons and ligaments [2,9–16].
A. R. Buck
:
F. M. BuckDepartment of Radiology, Orthopedic University Hospital Balgrist,
Zurich, Switzerland
N. Verstraete
:
Y. Li:
J. G. SnedekerDepartment of Mechanical Engineering, ETH Zurich, Zurich, Switzerland
Y. Li
:
A. Schweizer:
J. G. SnedekerDepartment of Orthopedic Surgery, Orthopedic University Hospital Balgrist,
Zurich, Switzerland
F. M. Buck (*)
University Clinic Balgrist, Forchstrasse 340, 8008 Zurich, Switzerland e-mail: [email protected]
In musculoskeletal radiology, ultrasound is often used to evaluate tendons and ligaments, preferably in locations close to the skin, in locations that allow for dynamic exam-ination [17–21].
Full or partial ruptures of small tendons, for example, tendons of the wrist and hand, are mostly caused by pre-existing degenerative diseases, systemic diseases, recurrent micro-traumas or trauma. Aging of the population and a general rise in sporting activities had led to an increase in the frequency of tendon tears. This problem is therefore fre-quently encountered in daily medical practice. Physical exam-ination can be limited by post-traumatic local edema or severe pain so that even complete tendon tears are not detected. Yet, correct and early diagnosis of tendon lesions can lead to better treatment planning and healing of the tendon [17]. Because of the small dimensions at the potentially injured locations nei-ther MR tomography nor ultrasound alone guarantee satisfy-ing diagnostic certainty in all patients. The ability of SE to delineate small tendon lesions is still unknown, but would be very important in estimating the power of this tool.
The visualization of a partial tendon tear of a small tendon is challenging irrespective of the modality (MRI or ultrasound) chosen. Ultrasound can be helpful in distinguishing a tendon tear from other entities such as tendinopathy [17–19,21,22]. However, small ruptures in finger tendons are hard to detect with ultrasound techniques.
When a lesion is present in a tendon, tensile loads applied on the tendon will be distributed differently at certain defined points in the tendon compared with tendons without lesions [23]. As a result, strains will not be equal along the whole tendon, since intact parts must carry more of the load (Fig.1). In this study, we investigated whether these strain differences could be detected with SE. The hypothesis was that the regions around a lesion would appear more compliant on an SE longitudinal image than on a longitudinal image of analogous regions in tendons without lesions. Therefore, the purpose of this study was to test the feasibility of detecting small tendon lesions by sonoelastographic visualization of strain profile differences.
Materials and methods
This study utilized equine superficial digital flexor tendons obtained from the slaughterhouse. No animals were sacrificed for this study and no human tissue was used. Therefore, no institutional review board approval was needed according to the rules of the university where the study was conducted.
Tendon preparation and experimental set-up
A small human tendon lesion model as previously described was used [24]. Briefly, tendon strips were cut from a fresh
unembalmed equine tendon (superficial digital flexor ten-don) that was kept cool, but never frozen, at 5°C over a maximum period of 1 day. Two tendons were harvested and each was utilized for a series of blocked experiments. From each tendon, 12 strips with rectangular cross-sections were cut (35 × 4 × 1 mm), with 6 strips randomly allocated to the treatment group in which lesions were made to model the change in strain profile. Strips were formed using four microtome blades separated by 1-mm metal plates. In this manner, 3 tendon strips were generated in a single cut. This procedure was chosen to produce specimens with highly comparable fiber direction and mechanical properties. From these 3 strips at least 1 was assigned to the control group and at least 1 was assigned to the experimental group.
The ends of the tendon strips were carefully wrapped with a narrow band of gauze and the strips were clamped onto a loading device designed to apply axial strain along the fibers of the tendon (Fig. 2). Some instant adhesive (Loctite 454, cyanoacrylate; Henkel Technologies, Düssel-dorf, Germany) was used to attach the fabric to the tendon strips to ensure secure attachment to the clamp [25]. The length of the tendon that could carry a load ranged from 30.0 mm to 44.0 mm. Strains were incrementally applied in steps of 0.5 mm.
Fig. 1 Strain profile in a loaded tendon with a central defect. Red
represents the largest strain possible in this model. Dark blue repre-sents the lowest strain possible. The presence of the lesion causes
higher strain than normal in regions of intact tissue due to “load
In the experimental group, lesions were made in the central midsubstance of the tendon strips using a biopsy punch with a 2-mm diameter (Biopsy Punch 2 mm, Stiefel Laboratories, Offenbach am Main, Germany). The lesion was applied in the center of the tendon when the tendon was under load.
The loading device was filled with phosphate-buffered saline to prevent drying of the tendon during the exper-iment. The tendon was covered with a gel pad (Sonar-Aid, Geistlich Pharma AG, Wolhusen, Switzerland) to improve the conduction of ultrasound and prevent inferior image quality because of unfocused ultrasound waves too close to the probe. Images of the experimental set-up are shown in Fig. 2. Tendons with lesions and control tendons were alternated for the ultrasound imaging and the analysis.
Imaging
Sonoelastography was performed using an ultrasound sys-tem (HI VISION 900, Hitachi Medical Syssys-tems, Wiesbaden, Germany) containing sonoelastography software. A 10.0- to
13.0-MHz linear array probe (EUP-L54M, Hitachi Medical Systems GmbH, Wiesbaden, Germany) was used.
All samples were placed under 5% strain when the images were taken. The samples were imaged for over 20 s while applying rhythmic compressions to the middle of the tendon with the ultrasound probe vertically on the tendon. A series of images was selected for each tendon strip. The selection criterion for images of tendon strips belonging to the control group was that the ultrasound system had to indicate that the image sequences obtained yielded a “sufficient quality,” indicating adequate tissue deformation to enable analysis by the commercial software. We further applied the criteria that the elastogram color map based on elasticity calculations by the algorithm [26, 27], when overlaid onto the regular B-mode ultrasound image, had to cover the tendon continuously (without any gray areas present). For the experimental group, the images had to fulfill an additional criterion: the lesion had to be centered in the image. Between 7 and 18 elastograms satisfying these criteria were collected for each tendon at peak load and analyzed as described below.
Image analysis
The combined autocorrelation method (CAM) algorithm as described by the manufacturer calculates elasticity and superimposes the strain images onto the B-mode ultrasound images by means of a color scale. The color map used by the SE software ranges from blue, indicating a“hard” (stiffer) structure, to red, indicating a“soft” (less stiff) structure [26,
27].
Each image was then analyzed using a custom-built Matlab code (Matlab R2008a; MathWorks, Natick, MA, USA). This algorithm interpreted colors in the elastogram as a value ranging from 0.3 (blue) to 1.0 (red) and deter-mined an average value in a rectangular shaped region of interest (ROI) that was manually defined to approximately cover the middle 50% of the tendon cross-section. This ROI was further subdivided into three sections: a right section, a middle section, and a left section. The average color value was calculated for each section. For tendons with lesions, the lesions were centered in the middle region. Because of the defect in the middle section of the tendons with lesions, we hypothesized that the elastogram would differ in the right and left sections owing to the higher stretching of these subregions.
Statistical analysis
The difference in color values between control and lesion tendon strips was analyzed using a two-sided t test. SPSS software (version, 16; SPSS, Chicago, IL, USA) was
Fig. 2 Experimental set-up. a Tendon strips (arrow) were carefully clamped onto a loading device designed to apply b axial strain along the fibers of the tendon (arrow). The loading device was filled with phosphate-buffered saline to prevent drying of the tendon during the experiment. For visualization purposes an elastic band was clamped onto the loading device instead of a tendon. Asterisk strain detector cable
employed. Results with a p value<0.05 were considered statistically significant.
In a first analysis, the average color values of the left and right sections of each tendon were compared between the control and lesion groups. In a second analysis, the average color value per tendon strip was calculated and these values were compared between lesion and control groups.
Results
Two independent experiments were conducted, each analyz-ing 6 control tendon strips and 6 tendon strips with lesions. The color values of the left and right sections of the ROI in tendon strips with lesions and control tendon strips were compared (Table1; Fig.3). In the first experimental series, there were significant (p00.0114) differences detected in the elastogram of the tendon subregions next to the tendon lesion compared with the respective tendon areas in the tendon strips without lesions. In the second series, no differ-ences were observed (p00.8244).
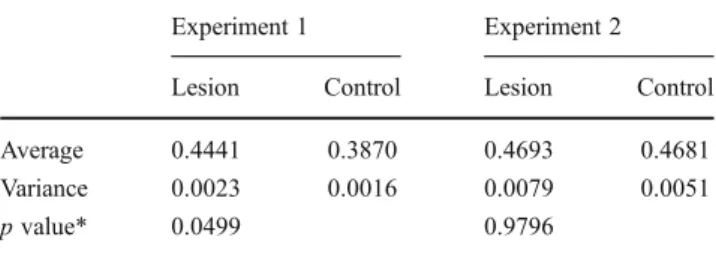
The average color values of the control tendon strips and the tendon strips with lesions were compared (Table 2; Fig. 4). Whereas in series 2 there were no differences between the tendon strips with lesions and uninjured con-trols, there was a significant difference between the two groups in series 1 (p00.0499).
Discussion
The results of the experiments indicate that partial tendon lesions could be detected using sonoelastography. In the first experimental series there were statistically significant differ-ences in the elastogram profiles between control tendon strips and tendon strips with lesions. In the first analysis, evaluating the relative differences between the left and right sections of the control and lesion groups, the difference was confirmed with a p value of 0.011. In the second analysis, examining the difference in elastograms between intact
tendons and injured tendons, absolute differences were also confirmed when using a significance level of 5% (p value 0.0499). In contrast, the second experimental series failed to yield either relative differences between injured and non-injured regions in the same tendon, or absolute differences between injured tendons and non-injured controls.
The observed differences in the first series were in accor-dance with our hypothesis that tendons with lesions would appear more deformable than intact tendons. “Load shunt-ing” from damaged regions to intact regions was expected to cause the intact tissues to deform more under similar whole tendon strains [23]. The elastograms from tendons with lesions accordingly reflected more elasticity (softer struc-tures) than control tendon strips.
In the second series, it remains unclear why the results from the first series were not replicated. Since the test set-up, machine, and analysis were configured identically, we suspect that inter-tendon differences could have been a cause, although both tendons showed no abnormality mac-roscopically or on ultrasound. Given the limited availability of the device (on loan for the study), we could not examine additional tendons. However, we can draw firm conclusions
Table 1 Color values of left and right sections of control tendon strips and tendon strips with lesions
Experiment 1 Experiment 2
Lesion Control Lesion Control
Number of tendon strips evaluated 12 12 12 12 Average 0.4500 0.3887 0.4735 0.4656 Variance 0.0039 0.0020 0.008 0.006 p value* 0.0114 0.8244 *Two-sided t test
Fig. 3 Color values in the two experiments of the left and right sections of control tendon strips and tendon strips with lesions
Table 2 Average color values for control tendon strips and tendon strips with lesions
Experiment 1 Experiment 2
Lesion Control Lesion Control
Average 0.4441 0.3870 0.4693 0.4681
Variance 0.0023 0.0016 0.0079 0.0051
p value* 0.0499 0.9796
regarding the clinical viability of the device, given even these somewhat limited results.
From our initial experience, the software in its current form is of limited value for using elastograms for diagnosis of small tendon lesions. Even using a highly controlled experimental set-up, well-defined injury model, ideal imaging access with the relative ability to load the tissue reproducibly, and a quan-titative (offline) image analysis routine, lesion diagnosis was inconsistent. To create a clinically viable diagnostic test, a color value should be set, above which the test is considered positive (lesion present). Since the color values of individual tendon strips within groups (lesion or control) often differed substan-tially, the positive predictive value of the test and the negative predictive value would be very low. Besides, our experience indicates that the variability when performing the test must be kept to a minimum to ensure a conclusive read-out, and such conditions would be very challenging to execute in a clinical setting. Further, it would be crucial to define the confounding influence of“tendon quality” in terms of underlying tendinop-athy and could significantly influence the performance of SE in identifying tendon lesions in patients with tendinopathy.
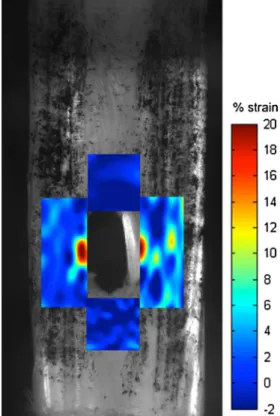
The implementation of the elastography analysis soft-ware generated substantial noise on the resultant elasto-grams (Fig. 5). This noise could only be compensated for by manually adjusting the ROI to avoid obvious image registration artifacts, and by the large oversampling of elas-tograms for a given tendon under identical load conditions in the custom post-processing step.
In other words, there was very large intra-specimen var-iability among the collected elastograms that could have been caused by the selection of the ROI:
1. Up to 25 elastograms were obtained per tendon strip. The ROI had to be manually chosen per image and could vary for images of the same tendon strip. The reproducibility of the analysis technique (the selection of the ROI is the only variable factor here) was tested by analyzing the same images from a control tendon strip and a tendon strip with a lesion twice (by the same user in a blinded fashion). The error between the two analy-ses was calculated as the difference in the means of the color values divided by the average of the means. For the repeated analysis of the control tendon, an average error of 3.22% was found, with a maximum error (for one individual section) of 10.61%. For the repeated analysis of the tendons with lesions an average error of 0.44% was found with a maximum error of 5.04%. The reduced error suggests that the ROI might be posi-tioned more reliably for tendons with lesions.
2. Applied load: it was difficult to maintain the same rhythm and force for the vertical compressions with the ultrasound probe during the time the images were made. It was clear that the applied force and frequency of the compressions can influence the color map of the elastogram.
3. Image noise: image noise could differ during the time the images were gathered, introducing another source of variation.
Inter-tendon strip variability could have been caused by the timing of stretching and saturation: obtaining an appropriate set of images took different amounts of time depending on the individual experiments. Tendon is a viscoelastic material, and
Fig. 4 Average color values for control tendon strips and tendon strips with lesions
Fig. 5 Sonoelastography images: examples of a, b experiment 1 and c, d 2. The tendon strips in a and c are from the control group, whereas the tendon strips in b and d had a central tendon defect (arrows). The location of the tendon defects is marked with a white arrow
experimental drift due to material creep could have an influence.
Addressing these challenges may sufficiently decrease the experimental variability to more conclusively determine whether actual differences exist in the elastograms of ten-dons with a lesion [28].
Changes in the mechanical properties of tendons are a well-established feature of tendon diseases [2]. Injury or disease of tendons leads to pathological biomechanical properties such as stiffness or failure when loaded [29]. Sonoelastography provides a way of visualizing and mea-suring these mechanical properties in vivo in a non-invasive way. The mechanical information acquired by sonoelastog-raphy cannot be seen with the traditional imaging modalities such as conventional ultrasound or MRI. Pathological ten-don tissue often presents with the same echogenicity as the surrounding normal tendon tissue because of edema, hem-orrhage, mucoid degeneration or partial tendon tears [30,
31]. Therefore, sonoelastography is a useful supplement to conventional ultrasound in differentiating normal tendon tissue from isoechogenic, but biomechanically substantially different, tendon lesions.
The Achilles tendon is the most widely researched tendon in the human body [9, 12, 16, 30, 32]. De Zordo et al. revealed distinct softening of symptomatic Achilles tendons compared with healthy volunteers [9,30]. Sonoelastography seems valuable in differentiating healthy from symptomatic extensor tendons in lateral epicondylitis and a useful tool in the detection of intratendinous and peritendinous alterations of lateral epicondylitis [11]. The reproducibility of sonoe-lastographic strain measurements of tendons has been in-vestigated recently. The authors found good reproducibility of strain measurements, whereas intra-reader and inter-reader agreement was higher for measurements in the lon-gitudinal plane than for those in the transverse plane [12]. However, sonoelastography is a relatively new technique and the authors believe that the results published have to be considered preliminary. Sonoelastography seems to be a promising tool for visualizing the altered elastic properties of normal tendons. More longitudinal studies are needed to verify these preliminary findings. In particular, correlation of sonoelastography findings with MR findings and histol-ogy will be of interest [32].
In contrast to previous publications, our study focused on the strain profile visualization of healthy tendons with a circumscribed defect placed under load. Previous publica-tions have focused on the elastic properties of tendons affected by pathological processes such as tendinopathy.
In conclusion, it is possible to detect small tendon lesions by visualizing strain profile differences in mechanically loaded tendons. However, there are many imaging factors that must be controlled to achieve reliable measurements, perhaps including the degenerative state of the tendon itself.
These logistical constraints, combined with limitations of current commercial implementations of the elastogram anal-ysis software, lead us to conclude that much work remains to be done to make sonoelastography viable for the clinical detection of small tendon lesions.
References
1. Ophir J, Céspedes I, Ponnekanti H, Yazdi Y, Li X. Elastography: a quantitative method for imaging the elasticity of biological tissues.
Ultrason Imaging. 1991;13(2):111–34.
2. Li Y, Snedeker JG. Elastography: modality-specific approaches, clinical applications, and research horizons. Skeletal Radiol. 2011;40(4):389–97.
3. Itoh A, Ueno E, Tohno E, Kamma H, Takahashi H, Shiina T, et al. Breast disease: clinical application of US elastography for
diagno-sis. Radiology. 2006;239(2):341–50.
4. Lyshchik A, Higashi T, Asato R, Tanaka S, Ito J, Hiraoka M, et al.
Cervical lymph node metastases: diagnosis at sonoelastography—
initial experience. Radiology. 2007;243(1):258–67.
5. Rubaltelli L, Corradin S, Dorigo A, Stabilito M, Tregnaghi A, Borsato S, et al. Differential diagnosis of benign and malignant thyroid
nod-ules at elastosonography. Ultraschall Med. 2009;30(2):175–9.
6. Céspedes I, Ophir J, Ponnekanti H, Maklad N. Elastography: elasticity imaging using ultrasound with application to muscle
and breast in vivo. Ultrason Imaging. 1993;15(2):73–88.
7. Friedrich-Rust M, Ong M-F, Herrmann E, Dries V, Samaras P, Zeuzem S, et al. Real-time elastography for noninvasive assess-ment of liver fibrosis in chronic viral hepatitis. AJR Am J
Roent-genol. 2007;188(3):758–64.
8. Spalazzi JP, Gallina J, Fung-Kee-Fung SD, Konofagou EE, Lu HH. Elastographic imaging of strain distribution in the anterior cruciate ligament and at the ligament-bone insertions. J Orthop Res. 2006;24(10):2001–10.
9. De Zordo T, Chhem R, Smekal V, Feuchtner G, Reindl M, Fink C, et al. Real-time sonoelastography: findings in patients with symp-tomatic achilles tendons and comparison to healthy volunteers.
Ultraschall Med. 2010;31(4):394–400.
10. Crevier-Denoix N, Ravary-Plumioën B, Evrard D, Pourcelot P. Reproducibility of a non-invasive ultrasonic technique of tendon force measurement, determined in vitro in equine superficial
dig-ital flexor tendons. J Biomech. 2009;42(13):2210–3.
11. De Zordo T, Lill SR, Fink C, Feuchtner GM, Jaschke W, Bellmann-Weiler R, et al. Real-time sonoelastography of lateral epicondylitis: comparison of findings between patients and healthy
volunteers. AJR Am J Roentgenol. 2009;193(1):180–5.
12. Drakonaki EE, Allen GM, Wilson DJ. Real-time ultrasound elas-tography of the normal Achilles tendon: reproducibility and pattern description. Clin Radiol. 2009;64(12):1196–202.
13. Farron J, Varghese T, Thelen DG. Measurement of tendon strain during muscle twitch contractions using ultrasound elastography. IEEE Trans Ultrason Ferroelectr Freq Control. 2009;56(1):27–35. 14. Fleming BC, Beynnon BD. In vivo measurement of ligament/ tendon strains and forces: a review. Ann Biomed Eng. 2004;32
(3):318–28.
15. Fredberg U, Bolvig L. Significance of ultrasonographically detected asymptomatic tendinosis in the patellar and Achilles tendons of elite soccer players: a longitudinal study. Am J Sports
Med. 2002;30(4):488–91.
16. Kuo PL, Li PC, Shun CT, Lai JS. Strain measurements of rabbit Achilles tendons by ultrasound. Ultrasound Med Biol. 1999;25
17. Bianchi S, Martinoli C, Abdelwahab IF. High-frequency ultra-sound examination of the wrist and hand. Skeletal Radiol.
1999;28(3):121–9.
18. Bianchi S, Martinoli C, Abdelwahab IF. Ultrasound of tendon tears. I. General considerations and upper extremity. Skeletal Radiol. 2005;34(9):500–12.
19. Bianchi S, Poletti PA, Martinoli C, Abdelwahab IF. Ultrasound appearance of tendon tears. II. Lower extremity and myotendinous
tears. Skeletal Radiol. 2006;35(2):63–77.
20. Tagliafico A, Rubino M, Autuori A, Bianchi S, Martinoli C. Wrist and hand ultrasound. Semin Musculoskelet Radiol. 2007;11
(2):95–104.
21. Rasmussen O. Sonography of tendons. Scan J Med Sci Sports.
2000;10:360–4.
22. Martinoli C, Bianchi S, Dahmane M, Pugliese F, Bianchi-Zamorani MP, Valle M. Ultrasound of tendons and nerves. Eur
Radiol. 2002;12(1):44–55.
23. Snedeker JG, Pelled G, Zilberman Y, Ben Arav A, Huber E, Muller R, et al. An analytical model for elucidating tendon tissue structure and biomechanical function from in vivo cellular confocal microscopy images. Cells Tissues Organs. 2009;190(2):111–9.
24. Fessel G, Wernli J, Li Y, Gerber C, Snedeker JG. Exogenous collagen cross-linking recovers tendon functional integrity in an experimental model of partial tear. J Orthop Res 2011;
doi: 10.1002/jor.22014.
25. Rigozzi S, Muller R, Snedeker JG. Local strain measurement reveals a varied regional dependence of tensile tendon mechanics
on glycosaminoglycan content. J Biomech. 2009;42(10):1547–52.
26. Shiina T, Yamakawa M. Fast reconstruction of tissue elastic mod-ulus image by ultrasound. Conf Proc IEEE Eng Med Biol Soc. 2005;1:976–80.
27. Shiina T, Yamakawa M, Nitta N, Ueno E. Real-time tissue elasticity imaging using the combined autocorrelation method. MEDIX Supplement, Special Issue: Clinical Applications of HITACHI Real-Time Tissue Elastography. Hitachi Medical Corporation; 2007.
28. Miller NR, Bamber JC. Thresholds for visual detection of Young’s
modulus contrast in simulated ultrasound image movies. Phys Med
Biol. 2000;45(8):2057–79.
29. Steiner M. Biomechanics of tendon healing. J Biomech. 1982;15
(12):951–8.
30. Klauser AS, Peetrons P. Developments in musculoskeletal ultra-sound and clinical applications. Skeletal Radiol. 2010;39
(11):1061–1071.
31. Frey H. [Realtime elastography. A new ultrasound procedure for the reconstruction of tissue elasticity]. Radiologe. 2003;43 (10):850–5.
32. Klauser AS, Faschingbauer R, Jaschke WR. Is sonoelastography of value in assessing tendons? Semin Musculoskelet Radiol. 2010;14