ContentslistsavailableatScienceDirect
Industrial
Crops
and
Products
j ou rn a l h o m epa g e :w w w . e l s e v i e r . c o m / l o c a t e / i n d c r o p
Optimization
of
the
recovery
of
phenolic
compounds
from
Algerian
grape
by-products
Sonia
Medouni-Adrar
a,∗,
Lila
Boulekbache-Makhlouf
a,
Yves
Cadot
b,
Lamia
Medouni-Haroune
c,
Farid
Dahmoune
a,
Aida
Makhoukhe
a,
Khodir
Madani
aaLaboratoiredeBiomathématiques,Biophysique,Biochimie,etScientométrie(L3BS),FacultédesSciencesdelaNatureetdelaVie,UniversitédeBejaia,
06000Bejaia,Algeria
bINRA,UE1117VigneVin,42rueGeorgesMorel,49071BeaucouzéCedex,France
cLaboratoiredeMicrobiologieAppliquée,FacultédesSciencesdelaNatureetdelaVie,UniversitédeBejaia,06000Bejaia,Algeria
a
r
t
i
c
l
e
i
n
f
o
Articlehistory: Received28April2015
Receivedinrevisedform17August2015 Accepted18August2015 Keywords: Grapeby-products Phenolics Extractionmethods Optimization
Responsesurfacemethodology
a
b
s
t
r
a
c
t
Grapeseedsandskinareby-productsofwinemakingorjuicemakingoperationswhichare consid-eredasagoodsourceofbioactivecompounds.Inthisstudy,thetotalphenoliccontent(TPC)fromVitis viniferaL.cv.AhmarBou-Amarseedsandskinwasoptimizedbyconventionalsolventextraction(CSE) andmicrowave-assistedextraction(MAE)usingresponsesurfacemethodology(RSM),thena compara-tivestudywascarriedout.TheoptimalconditionsforseedsextractedbyCSEwere:74.33%v/vofethanol concentration,65.23minextractiontime,0.1g/70.86mlsolid/liquidratio,andforthoseextractedby MAEwere:59.88sirradiationtimeand373.15Wmicrowavepower.Theextractobtainedunderthese conditionsshowedaTPCof96.56±1.29mgGAE/gand73.15±0.20mgGAE/gDWforCSEandMAE, respectively.Concerningskin,theoptimalconditionsforCSEwere:51.46%v/vofacetone concentra-tion,89.80minextractiontime,0.1g/32.25mlsolid/liquidratioandforMAEwere:113.74sirradiation timeand384.44Wmicrowavepower.TheextractobtainedundertheseconditionsshowedaTPCof 39.57±0.23mgGAE/gand54.84±0.41mgGAE/gDWforCSEandMAE,respectively.TheTPCofseeds extractobtainedwithMAEwas24%lowerthanthatoftheCSEextract;also,theantioxidantactivityof CSEextractisbetterthanthatofMAEextract.While,theTPCofskinextractobtainedwithMAEwas28% higherthanthatoftheCSEextractandtheantioxidantcapacitywassignificantlyhigherthanthatofthe CSEextract.Theresultsindicatethattheextractsofcv.AhmarBou-Amarseedsandskincontainahigh quantityofpolyphenols;therefore,theycanbeconsideredasagoodsourceofnaturalantioxidants.
©2015ElsevierB.V.Allrightsreserved.
1. Introduction
Grapes (Vitis vinifera L.), are the world’s largest fruit crop (Ghafooretal.,2010;Yangetal.,2009),withatotalproductionof approximately75.1milliontonsin2013(O.I.V.,2015).Although, a highpart of grapesis made into wine, another partis dried intoraisins,asignificantpartisconsumedastablegrapes(Nelson, 1979).Thecv.AhmarBou-AmargrapeisoriginatedinAlgeria,itis widespreadintheKabilyregionwithalowcommercialvalue,and isgenerallyconsumedasafreshfruit.
VitisviniferaL.containslargeamountsofphytochemicalssuchas phenoliccompounds(Yangetal.,2009)whichofferhealthbenefits viatheirimportantantioxidantactivity(Andjelkovicetal.,2013).
∗ Correspondingauthor.Fax:+21334214762.
E-mailaddress:sonia.medouni@yahoo.fr(S.Medouni-Adrar).
Thegrapepolyphenoliccompoundsarefoundessentiallyinseeds andskinswithapproximately75%(Ghafooretal.,2010);these lev-elsareinfluencedbythegrapevarietyandenvironmentalfactors (Cadotetal.,2008;Cheynieretal.,1998;Katalinicetal.,2010).
Grapeseedsandskinswhich arealow-value by-productsof wine making or juice making operations are considered to be a cheap and a good source of the high-quality phenolic com-pounds(Buci ´c-Koji ´cetal.,2007;Spignoetal.,2007),sotheycan beexploitedasnaturalantioxidantagentstoneutralizefree radi-calsinbiologicalsystems(Buci ´c-Koji ´cetal.,2007;Ghafooretal., 2010).
Extractionisacriticalstepintheisolationofactivecompounds fromplantmaterial(Afoakwahetal.,2012;Dragovi ´c-Uzelacetal., 2012).Differentextractionmethodshavebeeninvestigatedinthis regard;conventionalextractionmethodsaregenerallybasedon choosingtheaccuratesolventinordertoenhancethesolubility ofactivecompounds(Dragovi ´c-Uzelacetal.,2012;Ravaljietal., http://dx.doi.org/10.1016/j.indcrop.2015.08.039
2012).These methodsnecessitatelongerextractiontime which producesathermaldeteriorationforthemajorityoftheactive com-pounds(Wong-Pazetal.,2014).Recently,environmentalfriendly techniquesarebeinginterestedtodevelopthe“GreenChemistry” conceptsuchasultrasound-assistedextraction(Bimakretal.,2013) andmicrowave-assistedextraction(MAE)(Afoakwahetal.,2012; Rafieeetal.,2011;Wong-Pazetal.,2014;Zhengetal.,2011).
Microwave-assistedextractionisconsideredasanovel extrac-tionmethodthatcombinesmicrowaveandconventionalsolvent extraction(Lopez-AvliaandYoung,1994).Itisatechniqueused toextractactivecompoundsfromarangeofrawmaterialsusing theenergyofmicrowaveradiationtoheightenthetemperature ofthesolvents successfullyand rapidly(Afoakwah et al.,2012; Zhengetal.,2011).MAEisalsoabletodecreasejointlythesolvent consumptionandextractiontimeincomparisontoconventional techniques.Moreover,ithasthepossibilitytoimproveextraction quality(HithamaniandRamalakshmi,2013;Ravaljietal.,2012; Wong-Pazetal.,2014).
Consideringthevariabilityofthestructuresofphenolic com-poundspresentindifferentpartsofgrape(Rivera-Dominguezetal., 2010),itisimportanttodevelopanoptimalextractionmethodfor eachmatrix.Astheextractionmethodsareaffectedbydifferent parametersaswellastheinteractionofallthesefactors,theuse ofanoptimizationmodelingisnecessarytofacilitatethe deter-minationoftheoptimumextractionconditions.Responsesurface methodology(RSM)isamathematicaltechniquewhichisableto generatestatisticalmodelsandtakeintoconsiderationthe possi-bleinterrelationshipsbetweenthedifferenttestparameterswhile reducingthenumberofessaysandallowingforconsiderable reduc-tionofoperationcostandtime(Dahmouneetal.,2014).
Many authors investigated Conventional Solvent Extraction procedure(CSE)ofphenoliccompoundsandtheirpropertiesfrom grapeseedsandskinsandfromotherplantmaterials(Bordigaetal., 2011;Katalinicetal.,2010;Pineloetal.,2005a).However,limited informationhasbeenpublishedontheuseofmicrowaveforthe extractionoftotalphenoliccompoundsfromgrapeseedsandskins. Moreover,thereisalittlepublishedinformationabout optimiza-tionmodelingandcomparisonofCSEandMAEextractionprocess fromgrapeby-products.Finally,tothebestofourknowledge,no literaturereportexistsontheextractionofpolyphenolsfromgrape cv.AhmarBou-Amar.Therefore,thereisaneedtodevelopan opti-malmethodfortheextractionofphenoliccompoundsfromthe by-productsofthisvariety.Thus,theobjectivesofthecurrentstudy areto:(1)optimizethephenoliccompoundsextractionfromseeds andskinofgrapeVitisviniferacv.AhmarBou-AmarbyCSEandMAE, studyingtheeffectsofdifferentparametersontheextraction effi-ciency,usingBox-BehnkenDesign(BBD)and CentralComposite Design(CCD)ofRSM.(2)ComparetheoptimizedCSEwithMAE pro-cessbasedonthetotalphenoliccontent(TPC)andtheantioxidant activity.
2. Materialsandmethods 2.1. Chemicals
Folin–Ciocalteau’sphenolreagent,sodiumcarbonate(Na2Co3),
disodium hydrogen phosphate (Na2HPO4), sodium
dihydro-genphosphate (NaH2PO4)and allsolvents used wereobtained
from Prolabo (made in CE). Potassium persulfate (K2S2O8),
trifluoroacetic Acid (C2HF302) and ABTS:
2,2-azinobis-3-ethylbenzothiazoline-b6-sulfonic acid (C18H18NaO6S4) were
purchasedfromSigmaAldrich(Germany).Potassiumferricyanide (C6N6FeK3),ferricchloride(FeCl3·6H2O),trichloroaceticacid,gallic
acidandquercetinfromBiochem-chemopharma(UK).
2.2. Biologicalmaterial
ThefruitsamplesofVitisviniferacv.AhmarBou-Amarwere col-lectedintheareaofAmizour(Bejaia,Algeria).Grapeseedsandskin weremanuallyseparatedfromthepulpanddriedat40◦Cinahot airoven.Thedriedsamplesweremilledwithanelectricalgrinder, thepowderwassiftedbyastandardsieveandjusttheportionwith particlesize<500mwasused.
2.3. Effectofsolventnature
Inafirststage,theeffectofsolventnaturewasstudied:four solventswereused:50% (v/v)methanol,50% (v/v)ethanol,50% (v/v)acetoneand water. Theextractionwascarriedout witha CSEbyfixingextractiontime (30min)and sample/solventratio (100mg/10ml)atambienttemperature,afterthat,each sample wascentrifugedat10000rpm,thenfilteredthroughWhatmanN01
paperbyBüchnerfunnel.Thesupernatantwasusedinorderto determinetotalphenoliccompounds(TPC).
2.4. Preparationofextractsaccordingtotheexperimentaldesign 2.4.1. CSEprocess
Samples were extracted using the best solvent selected in thefirst step.In order topredict optimalextractionconditions and to determine the best combinations of three independent parametersforCSE,namely:solventconcentration,extractiontime andsolid/liquidratio,a33factorialexperimentaldesignthrough
Box–BehnkenwithRSMwasusedontherecoveryoftotalphenolic compounds.Thedifferentlevelsforeachindependentparameter werechosen froma series of preliminaryexperimentswithout usingmathematicalmodels.Thelevelsofindependentvariables werereportedinTable1.
50mgofseedsand100mgofskinpowderswereextractedwith differentvolumesofappropriatesolvent,differentextractiontimes andsolid/liquidratioasshowedinTable2.Afterextraction,each samplewascentrifugedat10,000rpm,thenfilteredthrough What-manNo1paperbyBüchnerfunnel.Theextractsobtainedunder theoptimumconditionsbyRSM,wereconcentratedundervacuum usingarotaryevaporatorandrecuperatedin55%ethanolacidified with0.005%oftrifluoroaceticacid(TFA)andstoredat0◦C. 2.4.2. MAEprocess
Using the best solvent, solvent concentration and sam-ple/solventratiofixedatoptimumconditionsofCSEprocess,the sampleswereextractedwithMAE,theindependentparametersof extractiontimeandmicrowavepowerwereanalyzedusinga cen-tralcompositedesigntoassesstheireffectsandinteractionsonthe extractionofphenolicscompounds.ARSMwasusedtooptimize theextractionprocess.Thedifferentlevelsforeachindependent parameterwerechosenfromaseriesofpreliminaryexperiments withoutusing mathematicalmodels. Thelevels ofindependent variableswerereportedinTable1.
Themicrowaveapparatususedinthisstudyisadomesticone (NN-S674MF,Samsung,Malaysia),itwasmodifiedinorderto con-densatethevaporsgeneratedduringextractionprocessgivinga stableextractvolume.Concerningtheextraction,50mgofseeds and100mgofskinpowderswereplacedina250mlvolumetric flaskcontainingtheextractionsolvent.Thesampleswereextracted atdifferentirradiationtimesandmicrowavepowers(Table2).After extraction,eachsamplewascentrifugedat10,000rpm,then fil-teredthroughWhatmanNo1paperbyBüchnerfunnel.Theextracts obtainedundertheoptimum conditions byRSM,were concen-tratedundervacuumusingarotaryevaporatorandrecuperated in55%ethanolacidifiedwith0.005%oftrifluoroaceticacid(TFA) andstoredat0◦C.
Table1
LevelsofdifferentindependentvariablesinRSMfortheoptimizationofextractsbyCSEandMAE.
Extractionprocess Independentvariables Levels
Seeds Skin
(-1) (0) (+1) (-1) (0) (+1)
CSE X1-solventconcentration
(%v/v) X2-time(min) X3–ratio(mg/ml) 50 30 1 65 60 1.75 80 90 2.5 40 60 2.5 55 90 3.75 70 120 5 MAE X1-Power(W) X2-time(S) 200 30 400 75 600 120 200 60 400 120 600 180 Table2
PreparationconditonsofextractsaccordingtotheexperimentaldesignwithRMSbyCSEandMAE.
Essay CSEFactors Essay MAEfactors
X1-solvent
concentration (%v/v)
X2-time(min) X3–ratio
(mg/ml) X1-time(s) X2-power(W) 1 2 3 4 5 6 7 8 9 10 11 12 13 14 15 −1 +1 −1 0 0 −1 0 +1 +1 0 0 −1 +1 0 0 +1 0 0 −1 0 0 +1 −1 0 −1 +1 −1 +1 0 0 0 −1 −1 −1 0 +1 +1 0 +1 +1 −1 0 0 0 0 1 2 3 4 5 6 7 8 9 10 11 0 0 −1 91 +1 0 −1 0 0 +1 +1 0 0 0 −1 −1 +1 +1 0 −1 0 +1
To obtaintheoptimum operating conditions and to explain theperformanceofthemethod,asecond-ordermodelwasused accordingtothefollowingequation:
Y= ˇo+SˇiXi+SˇiiXi2+SˇijXiXj (1)
WhereYisthepredictedresponse(TPCmgGAE/gDW),o,ˇi,ˇii, andijareregressioncoefficientsforintercept,linear,quadratic andinteractionterms, respectivelyand XiandXjare theactual levelsoftheindependentvariables.
2.5. Analysisoftotalphenoliccompounds
Totalphenoliccontentwasmeasuredaccordingtothemethod described byVelioglu etal. (1998).200lof theextractswere mixedwith1500lofFolin–Ciocalteaureagent(dilutedtenfold). After3min,1500lof6%sodiumcarbonatewereadded.Thetest tubecontentsweremixedandpreservedfor1hatroom temper-atureinthedark.Then,theabsorbancewasmeasuredat765nm versusablankpreparedwithoutextract.Gallicacidwasusedas astandardandtheresultswereexpressedasmilligramgallicacid equivalentspergramofdryweight(GAE/gofDW).
2.6. Evaluationoftheantioxidantactivity 2.6.1. ABTS+method
TheABTS+ radicalscavengingactivityof extractswas
deter-minedaccordingtothemethodofAwikaetal.(2003).TheABTS+
radicalwaspreparedbycombiningavolumeof8mMABTS+with
thesamevolume of3mM potassium persulfateand incubating for16hinthedarkatroomtemperature.Theworkingsolution wasobtainedbydilutingwith50%methanoltoanabsorbanceof 0.70±0.02at734nm.TheresultswereexpressedasQuercetinmg
equivalentspergramofdryweight(mgQE/gDW).Thepercentage inhibitionwascalculatedaccordingtothefollowingformula: %Inhibition =[(Acontrol−Asample)/control]×100 (2) WhereAistheabsorbanceofthecontrolorofthesample. 2.6.2. Ferricreducingpower(FRP)
Thereducing poweroftheextractswasevaluatedusing the method described by Oyaizu (1986); 1ml of phosphate buffer (0.2M,pH6.6)and1mlof1%potassiumferricyanidewereaddedto 1mlofthesample.Themixturewasincubatedat50◦Cfor20min. Afterthat,1mlof10%trichloroaceticacidwasaddedtothemixture andcentrifugedfor10minat1700g.Then0.2mlof0.1%ferric chlo-ridewasaddedtothemixtureof1mlofsupernatantand1mlof distilledwater.Theabsorbancewasmeasuredat700nm.Quercetin was usedas a standard and reducing power wasexpressedas quercetinmgequivalentspergramofdryweight(mgQE/gDW). 2.7. Statisticalanalysis
Alltheessayswererepeatedtreetimesandtheresultswere expressedas means±standard deviation (SD).Statistical anal-ysiswasdonewithJMP software (Version7.0, SAS)tofindthe responsesurfacesandcontourplotsoftheresponsemodel.Data wereanalyzedbyanalysisofvariance(ANOVA)andthefittingof themathematicalmodelswasdeterminedbyevaluatingthelack offitandcoefficientofdetermination(R2).Whiletheeffectoftype
solventontheTPCinthefirststageandtheresultsof compari-sonbetweenCSEandMAE(ABTS,FRPandTPC)werestatistically assessedbyANOVAusingSTATISTICA5.5 tofindsignificant dif-ferencesamongthedifferentresults.Thestatisticalsignificanceof eachresultwasdeterminedat5%probabilitylevel(p<0.05).
3. Resultsanddiscussion
3.1. Effectsofthesolventonthetotalphenoliccontent
Preliminaryexperiments wereconductedtodetermine opti-mumextractionsolventforeachmatrix.Theefficiencyofethanol, methanol,acetoneandwaterontheextractionofthetotalphenolic contentfromgrapeseedsandskin,wascompared.Significant dif-ferences(p<0.05)solventextractionforskinsamplesasshownin Table3,thehighercontentofTPCwasdetectedinacetoneextract (27.90±0.39mgGAE/g DW)followed bytheethanol, methanol andwaterextracts.Whileforseeds,thehighercontentofTPCwas detectedinethanolextract(86.51±5.36mgGAE/gDW)followed bythemethanol,water thenacetoneextracts.Therefore,inthe followingstudy,acetonewaschosentobethebestsolvent extrac-tionforskinmatrixandethanolwaschosentobethebestsolvent extractionforseeds.Theseresultsareinagreementwiththe previ-ouspublishedresults.Indeed,aqueousethanolwasusedbyseveral authorsfortheextractionofphenoliccompoundsfromgrape,grape seeds,skinsand/orpomace(Buci ´c-Koji ´cetal.,2007;Carreraetal., 2012;Katalinicetal.,2010;Pouralietal.,2014;Spignoetal.,2007) andYilmazandToledo(2006)haveusedaqueousacetone.Kennedy etal.(2002)extractedthephenoliccompoundsfromgrapeskins with66% aqueous acetone.Cadot et al. (2011, 2006) used dif-ferent solvents for skins and seeds:acetone/methanol/H2O/TFA
(50:15:35:0.05)forskinsandacetone/H20(60:40)forseeds.
3.2. OptimizationoftheCSEconditions
Theexperimentaldesignandcorrespondingresponsesforthe obtainingofgrapecv.AhmarBou-Amarseedsandskinextractsare presentedinTable4.Modelpresentedthetotalof15experiments. Treereplicationsatthecentralpointswereincludedinorderto evaluateexperimentalerrormeasurement(GoupyandCreighton, 2006).
Followingtheresultsobtainedondifferentsolventsextraction, seedsandskinswereextractedwiththeselectedappropriate sol-vent(ethanolandacetoneforseedsandskinsrespectively).The influenceofthevariables:solventconcentrations,solid/liquidratio, and extractiontime onthe extraction of TPC was investigated througha33factorialexperimentaldesignwithresponsesurface
methodology(RSM)andBox–Behnkendesign.Theexperimental andpredictedvaluesofTPCatvariousexperimentalconditionsare giveninTable4
Asshown,TPCofseedsrangedfrom87.99to95.97mgGAE/g DW,while the bestresult wasobtained when solvent concen-tration, extracting time and solid/solventratio were 65% (v/v), 60minand1.75(m/v),respectively. Ontheotherhand,TPC for skinrangefrom33.19to39.14mgGAE/gDW,wherethecentral pointpresentsthebestextractionconditions.Theobtainedresults werehigherthanthoseobtainedbyCasazzaetal.(2010).Indeed, theseauthorshavefoundvaluesof55.98±0.58and5.60±0.20mg GAE/gin ethanolic extractsfrom grapeseeds and skin, respec-tively.Buci ´c-Koji ´cetal.(2007)foundtheconcentrationrangedfrom 14.72mgGAE/gDWto66.81mgGAE/gDWin50%ethanolicextract ofgrapeseeds.Krishnaswamyetal.(2012),haveobtainedavalue of13.5±0.48mgGAE/gDWin30%ethanolicextractfromgrape seeds.
The second order polynomial equation was generated to describetheempiricalrelationshipbetweentheTPCofseeds(Y1)
andskin(Y2)andoperationalconditions(solventconcentration,
solid/extractiontimeandsolid/liquidratio)intermsofcoded val-ues: the models were simplified by elimination of statistically insignificantterms.
Y1 = 95.65+0.46X1+0.35X2–1.78X3–0.87X2X3
–0.54X12–2.68X22–2.41X32 (3)
Y2= 38.85–0.43X1–0.55X2–1.21X3–0.87X2X3–1.07X12
–1.71X22–1.19X32 (4)
Theresultsoftheanalysisofvariance(ANOVA)fortheadequacy oftheselectedmathematicalmodelsarereportedinTable5.The significanceofeveryfactorandtheirinteractionsareverifiedby p-values,wherethevalueslessthan0.05indicatesignificanceand lessthan0.001indicatehighsignificance.
verylowp-values(p<0.0001andp=0.0022forseedsandskin, respectively)indicatedthateachgeneratedmodelwasstatistically significantandsuggeststhattheCSEofgrapeseedsandskincould bewelldescribed withthose appropriatemodels.Thevaluesof R-squaredarecloseto1foreachmodel(R2=0.9924and0.9722
forseedsandskin,respectively),whichisveryhighandindicates agood correlationbetweentheexperimentaland thepredicted values,andindicatedthateachmodelcouldexplain99.24%and 97.22%ofthevariationintheTPCingrapeseedsandskin, respec-tively.Also,thevalueofF-valueforthelackoffit,ofbothmodels, wasnotsignificant(p>0.05),thusconfirmingthevalidityofthe model.Allresultsindicatedthatbothmodelscouldworkwellfor thepredictionofTPCextractionfromgrapeseedsandskin.
Theregressionanalysisofthedatashowedthatallthethree parameters(solventconcentration(X1),solid/liquidratio(X2)and
extractiontime(X3))have asignificanteffect(p<0.05)onboth
seeds and skin extracts. Meanwhile, solid/liquid ratio has the dominanteffect onTPC,followed bysolvent concentrationand extraction time. However, interactions X1X2 and X1X3 did not
exhibitanysignificanteffectinanycases.Whereas,theeffectsof X2X3,X12,X22 andX32ontheTPCofseedsandskinextractwere
significant(p<0.05).
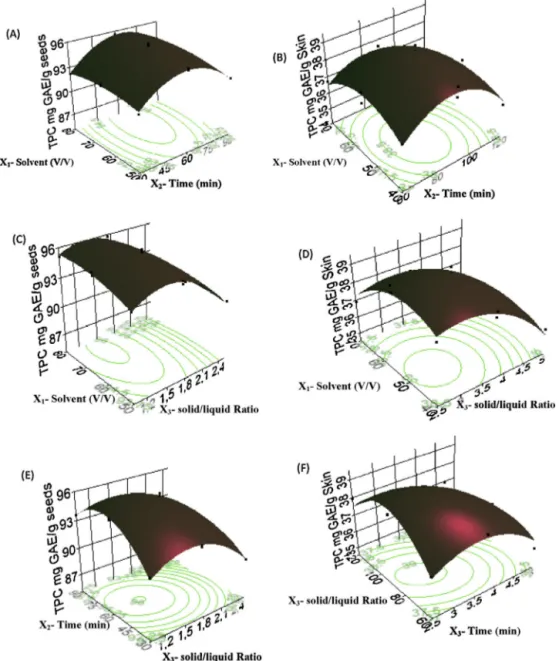
TheEq. (3)shows thatethanol concentrationand extraction time havesignificantpositive lineareffects onTPC grape seeds extract,whereas,solid/liquidratioandtheirquadraticinteraction havesignificantnegativeeffects.Concerningskin,Eq.(4),indicates thatallparametersandtheirquadraticinteractionhavesignificant negativeeffectsonTPC.Theinfluenceofthethreeparameterson TPCofgrapeseedsandskinisdepictedinFig.1.Resultsindicate that,yieldofTPCincreasedwithincreasingethanolconcentration upto74%andthenitremainedsignificantlyconstant.Whilethe TPCinthegrapeskinextractsincreasedwithdecreasingofacetone concentration,sothemaximumTPCwasobtainedwithminimal valueofacetoneconcentration.Similarresultshavebeenobtained byChewetal.,(2011);the40%ethanolextractofCentella asiat-icacontainedmorephenoliccompoundsthan60%,80%and100% ethanolextracts.Also,Al-FarsiandLee(2008)reportedthat50% acetonewasthemostefficientsolventforphenolicextractionfrom dateseeds.
FromFig.1AtoF,itcanbeconcludedthattheTPC, indepen-dentlyofsolventconcentrationand solid/liquidratio,increased rapidlyforgrapeseedsandslightlyforskinextracts,respectively, withtheincreaseoftheextractiontimefrom30to60andfrom 60to90minforgrapeseedsandskinextracts,respectively;then slightlydecreasedfrom65to90andrapidlyfrom91to120minfor grapeseedsandskinextracts,respectively.Ingeneral,the high-estvalue ofTPC was achievedat anextractiontime of 65 and 90min for seeds and skin extracts,respectively. But, after this point,theTPCwasdecreased.Similarresultswerereportedinthe literature(Spignoetal., 2007;Wissametal., 2012;Yang etal., 2013).Pilenoetal.(2005b)showedthattheTPCofgrapeextracts decreasewiththeincreaseoftheextractiontime.Thisphenomenon
Table3
EffectofsolventnatureontheextractionofTPCfromseedsandskin.
Solvents TPCofseedsextracts(mg
GAE/gDW) TPCofskinextracts(mg GAE/gDW) Water Ethanol50% Methanol50% Acetone50% 57.56±0.23b 86.51±5.36a 69.18±1.41b 38.92±0.68c 07.58±0.83d 20.61±1.64b 13.09±0.79c 27.90±0.39a
Resultsarereportedasmeans±S.D.DifferentlettersinthesamecolumnrefertomeansstatisticallydifferentaccordingtoANOVAandTukey’stest.
Table4
Box–BehnkendesignwiththeobservedresponsesandpredictedvaluesofTPCreferredtoDWofseedsandskinusingCSE.
Essay Factors Reponses
X1-solvent
concentration (%v/v)
X2-time(min) X3–ratio
(mg/ml)
Seeds
TPCmgGAE/gDW
Skin
TPCmgGAE/gDW
Experimental predicted Experimental predicted 1 2 3 4 5 6 7 8 9 10 11 12 13 14 15 −1 +1 −1 0 0 −1 0 +1 +1 0 0 −1 +1 0 0 +1 0 0 −1 0 0 +1 −1 0 −1 +1 −1 +1 0 0 0 −1 −1 −1 0 +1 +1 0 +1 +1 −1 0 0 0 0 92.06±0.84 95.13±1.63 93.61±1.36 91.38±1.29 95.74±1.09 91.01±0.90 87.99±0.54 92.16±0.78 91.01±0.38 89.33±1.10 93.54±1.48 91.71±0.48 93.76±0.82 95.97±0.67 95.24±0.78 92.00 95.31 93.64 91.13 95.65 90.83 88.24 92.22 90.98 89.30 93.57 91.93 93.54 95.65 95.65 36.06±0.70 36.89±1.05 38.11±0.37 36.95±1.70 39.14±0.36 35.98±1.17 33.19±0.37 36.68±0.55 35.32±0.31 35.70±0.69 37.94±1.38 36.88±1.13 34.63±1.02 38.83±1.84 38.58±0.66 36.26 37.21 38.37 36.83 38.85 35.66 33.31 36.48 35.07 36.16 37.48 36.74 34.77 38.85 38.85 Table5
Analysisofvariance(ANOVA)ofthequadraticmodelobtainedwithCSE.df.degreesoffreedom.
Source Seeds Skin
Df Sumofsquares F-value P-valueProb>F Df Sumofsquares F-value P-valueProb>F Model X1–Solvent X2-Time X3-Ratio X1X2 X1X3 X2X3 X12 X22 X32 Residual Lackoffit Pureerror Cortotal 9 1 1 1 1 1 1 1 1 1 5 3 2 14 76.9125 1.6718 0.9583 25.5628 0.3906 0.5779 3.0648 1.1126 26.5220 21.4407 0.5855 0.3060 0.2794 77.4980 72.9768 14.2766 8.1834 218.2930 3.3360 4.9356 26.1724 9.5012 226.4838 183.0925 0.7301 <0.0001 0.0129 0.0353 2.56815e-5 0.1273 0.0769 0.0037 0.0273 2.34629e-5 3.94951e-5 0.6221 9 1 1 1 1 1 1 1 1 1 5 3 2 14 37.0018 1.5287 2.4088 11.7540 0.3791 0.0788 3.0548 4.2876 10.7707 5.2694 1.0576 0.9022 0.1554 38.0595 19.4359 7.2272 11.3874 55.5664 1.7926 0.3727 14.4414 20.2693 50.9180 24.9108 3.8692 0.0022 0.0433 0.0197 0.0006 0.2382 0.5681 0.0126 0.0063 0.0008 0.0041 0.2122 R2=0.9924 R2=0.9722
couldbeexplained byFick’s secondlawof diffusion,whenthe solventsaturatestheextractedcompound,theconcentration gradi-entbecomesnullafteraparticulardurationandthephenomenon stops(Rodriguesetal.,2008;Yangetal.,2013).However,itwas foundthataugmentationoftheextractiontimeprolonged expo-suretooxygenandlight(Wissametal.,2012),thus,increasethe chancesforformationoffreeradicalswhichcanbescavengedby phenoliccompounds(NaczkandShahidi,2004).Alsoplantcells containenzymescapableforalteringthephenoliccompounds,in particularpolyphenoloxidaseviareactionsenzymatic browning (Tomãs-BarberãnandEspin,2001),thelongerextractiontimemay favorthosereactions(Garcia-Salasetal.,2010).Hence,anexcessive extractiontimewasnotusefultoextractmorephenolic antioxi-dants(Chaalaletal.,2012).
Withregardtosolid/liquidratio,whenthisparameterdecreases from2.5to1forseedsandfrom5to2.5forskinanincreaseonTPC wasobserved.OurresultsagreewiththosereportedbyChaalaletal. (2012),whoconfirmedanincreaseofTPCwhenthesolid/liquid ratiowasdecreasedfrom0.08(0.8g/10ml)to0.02(0.2g/10ml). Oneoftheprobableexplanationforthisphenomenonisthat regu-larlyusageoflargervolumeofsolventcouldobtainlargeramountof phenoliccompounds(Inceetal.,2014);accordingtomasstransfer principles,thedrivingforceduringmasstransferisthe concentra-tiongradientbetweenthesampleandthesolvent,whichisgreatest whenasmallsample/solventratioisused(Pineloetal.,2005b).
Theobtainedresultsshowthat theoptimumextraction con-ditionsfortherecoveryoftheTPCusingCSEfromseeds(1)are: 74.33%v/vofethanolconcentration,65.23minextractiontimeand 0.1g/70.86mlsolid/liquidratiowithapredictedyieldof96.23mg
Fig.1.Three-dimensionalpresentationofthedevelopedresponsesurfacemodelfortheTPCfromgrapeseedsandskinwithCSEwithrespecttoextractiontimeandsolvent percentage(A:seeds;B:skin);solid/liquidratioandsolventpercentage(C:seeds;D:skin);extractiontimewithsolid/liquidratio(E:seeds;F:skin).
GAE/g.Averificationexperimentattheoptimumconditionswas performedandthepracticalrecoveryof96.56±1.29mgGAE/gwas obtained.Whilethosefromtheskin(2)are:at51.46%v/vof ace-toneconcentration,89.80minextractiontimeand0.1g/32.25ml solid/liquidratiowithapredictedyieldof39.22mgGAE/g.A verifi-cationexperimentattheoptimumconditionswasperformedand thepracticalrecoveryof39.57±0.23mgGAE/gwasobtained.
3.3. OptimizationoftheMAEconditions
RSMbasedonaCentralCompositeDesign(CCD),througha23
factorialexperimentaldesign,tooptimizetheMicrowave-Assisted Extraction (MAE) of total phenol content fromseeds and skin, wasinvestigated.TheexperimentalvaluesofTPCextractsat vari-ousexperimentalconditionsarepresentedinTable6.Inthisnew design,onlytheirradiationtimeandmicrowavepowerwere stud-ied.Thesolventconcentrationandsolid/liquidratiowerefixedat optimumthatwasfoundinCSEstudy.Eachfactor,containingthree levels,waschosenfromaseriesofpreliminaryexperiments with-outusingmathematicalmodels.Themodelpresentedthetotalof11
experiments.Threereplicationsatthecentralpointswereincluded inordertoevaluateexperimentalerrormeasurement(Goupyand Creighton,2006).Theobtainedresultsshowedthatthemaximum TPCofthegrapeseedsandskinextractswere72.92and55.82mg GAE/gDW,respectively.
Eq.(5)and(6),showtherelationshipbetweenirradiationtime andmicrowavepowerfortheextractionof totalphenolic com-poundsofgrapeseeds(Y1)andskin(Y2),respectively.
Y1= 72.33–3.47X1–4.98X2–6.88X1X2–3.51X12–9.22X22 (5)
Y2= 54.31–0.82X1–0.72X2–2.30X1X2–3.08X12–3.12X22 (6)
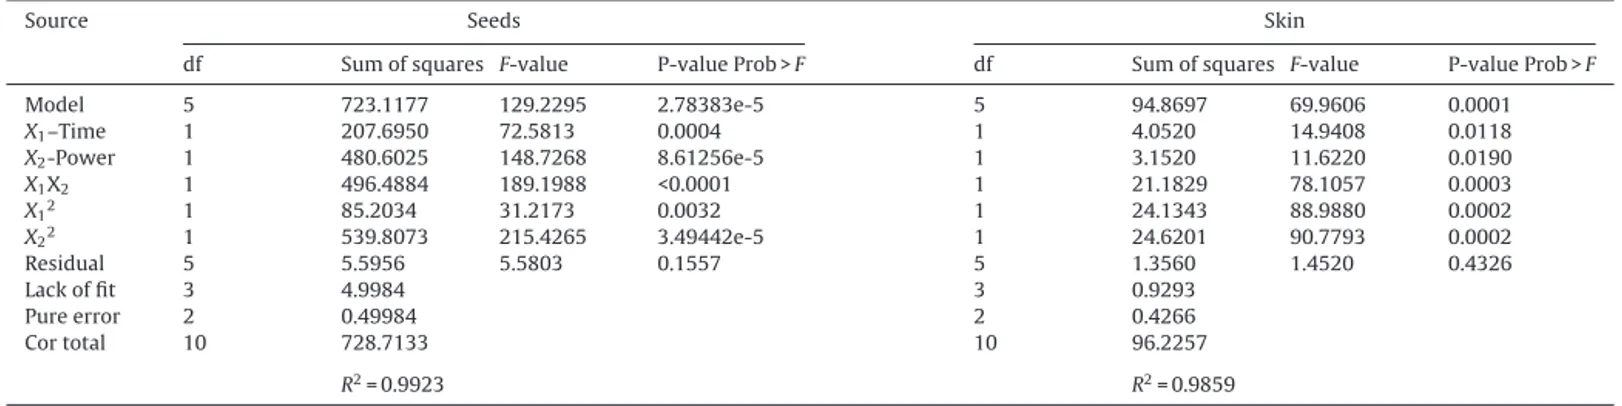
The resultsof ANOVA,goodness of fit and the adequacy of themodelsareshowedinTable7.TheANOVAresponsesurface quadraticregressionmodelshowedthatthemodelswerehighly significantforbothmatrixes(p<0.001)withhighlyF-value(129.22 and69.87forseedsand skin,respectively),atthesametime, a highproportionofvariabilitywasexplainedbytheRSMmodels forTPCasindicatedbyR2(R2=0.99and0.98forseedsandskin,
respectively)therefore,themodelswereadequateandexplained mostofthevariabilityforeachmatrix.Also,thelack-offitstatistics
Table6
CentralCompositeDesignwiththeobservedresponsesandpredictedvaluesofTPCreferredtoDWofseedsandskinusingMAE.
Essay Factors Reponses
X1–time(s) X2–power(W) Seeds Skin
TPCmgGAE/gDW TPCmgGAE/gDW
Experimental predicted Experimental predicted
1 0 0 71.83±0.79 72.32 54.92±0.84 55.06 2 0 0 72.44±0.46 72.32 55.82±0.82 55.06 3 −1 0 72.00±0.60 72.29 52.60±0.98 52.79 4 −1 −1 60.68±0.95 61.17 47.76±0.34 47.78 5 1 −1 67.30±1.08 67.97 51.28±1.02 51.21 6 0 1 56.74±1.23 58.12 50.58±0.72 51.09 7 −1 1 65.74±0.73 64.97 51.51±0.64 51.3 8 0 0 72.92±0.79 72.32 55.01±0.52 55.06 9 0 −1 69.23±1.00 68.08 52.48±0.57 52.53 10 1 0 65.39±1.19 65.33 50.90±0.69 51.27 11 1 1 44.86±1.90 44.25 45.12±0.61 44.82 Table7
Analysisofvariance(ANOVA)ofthequadraticmodelobtainedwithMAE.df.degreesoffreedom.
Source Seeds Skin
df Sumofsquares F-value P-valueProb>F df Sumofsquares F-value P-valueProb>F Model X1–Time X2-Power X1X2 X12 X22 Residual Lackoffit Pureerror Cortotal 5 1 1 1 1 1 5 3 2 10 723.1177 207.6950 480.6025 496.4884 85.2034 539.8073 5.5956 4.9984 0.49984 728.7133 129.2295 72.5813 148.7268 189.1988 31.2173 215.4265 5.5803 2.78383e-5 0.0004 8.61256e-5 <0.0001 0.0032 3.49442e-5 0.1557 5 1 1 1 1 1 5 3 2 10 94.8697 4.0520 3.1520 21.1829 24.1343 24.6201 1.3560 0.9293 0.4266 96.2257 69.9606 14.9408 11.6220 78.1057 88.9880 90.7793 1.4520 0.0001 0.0118 0.0190 0.0003 0.0002 0.0002 0.4326 R2=0.9923 R2=0.9859
(p=0.1557and0.4326forseedsandskin,respectively),whichwas usedtotesttheadequacyofthemodelwasnotsignificant.Thus, itcanbeconcludedthatthemodelswerewellfittedandcouldbe usedtopredicttheTPCfromgrapeseedsandskinextractswith MAE.
AsshowninTable7,ANOVAresultsindicatedthateffectof irra-diationtime(X1)andmicrowavepower(X2)onTPCofseedsand
skinextractsishighlysignificant(p<0.0001)suchastheir inter-actionandtheirquadraticterms.AccordingtoEq.(5)and(6)the negativecoefficientsforX1andX2indicatelineareffectsthatmay
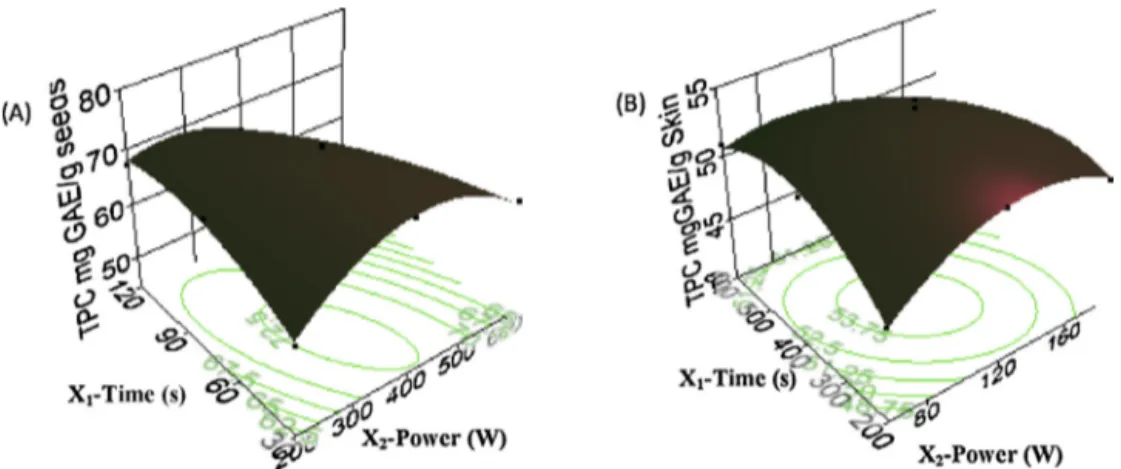
decreasetheresponses(TPC).TherelationshipbetweenTPCand dependentvariablesisgraphicallypresentedinthreedimensional responsesurfaceplots(Fig.2).Fromthosefigures,itcanbe con-cludedthattheTPCslightlyincreases,ataconstantirradiationtime, withanincreaseofmicrowavepowerfrom200to380and410W forseedsandskin,respectively,thenrapidlydecreasesfrom460 and480to600Wforseedsandskin,respectively.
Itwasalsoobservedthattheincreaseintheirradiationtimeat lowermicrowavepower,leadstotheincreaseoftheresponse.At lowermicrowavepower,theimpactofextractiontimehasa pos-itiveeffectontheTPCuptotheextractiontimeof84sand146 sforseedsandskinextractsrespectively,andthenithasa nega-tiveimpact.ItisveryinterestingtonotethattheTPC(1)decreases withtheincreasingof themicrowavepower forlonger extrac-tiontimesand(2)increasesatlowmicrowavepowerwithlong extractiontimeand highpowerwithshortexposure.Thereisa stronginteractionbetweenthesetwoparameters,whichisbased onthefunctionshape.Theseresultsconcludethatthemost effi-cientmeantoextractphenolsfromgrapeseedsandskinsbyMAE istheapplicationofamoderatemicrowavepowerforashort expo-sure.Therefore,thelongerextractiontimewithhighermicrowave powercanaffectthequalityofthephenoliccompounds.Afoakwah
etal.(2012)reportedthat,theextractionprocessofMAEiswidely influenced bytime exposuretoheat. Thus,the quantityof tar-getcompoundsextractedcanbeincreasedwithanincreaseinthe extractiontime,butthereisanassociatedriskofdeteriorationof thermolabileones.Theresultsobtainedcanbeexplainedbythe factthattheincreaseofthemicrowavepowerinshortextraction timeleadstotheincreaseofthecontentofphenoliccompounds byincreasing thesolubilityofthetarget analytes,thediffusion rate, and themass transfer (Afoakwah et al.,2012; Dahmoune etal.,2013;Garcia-Salasetal.,2010).However,itwasnotedthat increasingthepoweruptoacertainvaluesmaypromote possi-bleconcurrentdecompositionofphenoliccompounds(Afoakwah etal.,2012;Muthuselvietal.,2012).Additionally,highpowermay encourage solventlossthrough evaporation(Garcia-Salas etal., 2010;Thabitetal.,2014).
Optimal conditions forseedsextract are: irradiationtime of 58.63sandmicrowavepowerof373.15WwithapredictedTPC yieldof73.29mgGAE/gDW.Forskinextract:irradiationtimeof 113.74sandmicrowavepower384.44WwithapredictedTPCyield of 54.38mg GAE/gDW. Thevalidity ofthose predictedoptimal valuesofTPCforeachmatrixextracts,wasalsoexperimentally con-firmed:73.15±0.20and54.84±0.41mgGAE/gDWforseedsand skin,respectively,veryclosetothevaluespredictedbythemodels. 3.4. ComparisonbetweenCSEandMAE
Table8showstheconcentrationsofphenoliccompoundsand the antioxidant activity (ABTS radical scavenging activity and reducing power) of the extracts obtained under the best con-ditions.The resultsindicate that TPC of seedsextract obtained withMAE wassignificantlylower (73.15±0.20mg/g)than that obtainedwithCSE (96.56±1.29mg/g).The sameobservationis
Fig.2.ResponsesurfacemodelfortheTPCfromgrapeseedsandskinswithMAEtoirradiationtimeandmicrowavepower(A:seeds;B:skin).
Table8
Totalphenoliccontentandantioxidantactivityofdifferentextracts.
Matrixes TPCmgGAE/gDW ABTSmgQE/gDW FRPmgQE/gDW
CSE MAE CSE MAE CSE MAE
Seeds 96.56±1.29a 73.15±0.20b 182.24±5.44a 134.62±1.99b 181.90±1.09a 122.94±1.10b
Skin 39.57±0.23b 54.84±0.41a 104.94±0.54b 108.36±1.14a 90.98±0.94b 93.52±1.11a
Resultsarereportedasmeans±S.D.DifferentlettersinthesamelineandintwoconsecutivecolumnsrefertomeansstatisticallydifferentaccordingtoANOVAandTukey’s test.
notedfortheantioxidantactivity,indeedtheABTSandtheFRP values(182.24±5.44and181.90±1.09mgEQ/gDW,respectively) ofextractobtainedbyCSE weresignificantlyhigherthan those obtainedbyMAE(134.62±1.99and122.94±1.10mgEQ/gDW, respectively).
The lower TPC of seeds extracts obtained with microwave extractionascomparedtoconventionalextractioncanduetotheir heatsensibility.Theeffectoftemperaturecannotbegeneralized sinceitstronglydependsontypologyofcompounds(Spignoetal., 2007).
Theheattreatmentcausesirreversiblechangesintannins struc-ture,indeed,Padmaja(1989),hasreportedthedecreaseoftannin contentsincassavaleavesdriedat60◦C.Severalstudiesshowed that extractionoftannins and proantocyanidins,which arethe majorphenolic compoundsingrapeseeds(Bordigaetal.,2011; Cadotetal.,2006;Shietal.,2003),decreasewiththeincreaseof temperature(Makkarand Becker, 1996;Padmaja,1989; Spigno etal.,2007).Liazidetal.,(2007)alsoshowedthatthemicrowave radiationcaneasilydegradeunstablephenolicsduetotheir struc-tural properties. Phenolic compounds with higher number of hydroxyl substituent in their aromatic rings are unstable and caneasilybedegradedunder hightemperature conditions.The degradationofphenoliccompoundscangenerateadeclineonthe antioxidantactivity,whichcanexplainthelowerantioxidant activ-ityofextractsobtainedbyMAEincomparisontothoseobtainedby CSEmethod.Indeed,severalauthorsfoundasignificant correla-tionbetweenTPCandantioxidantactivity(Slusarczyketal.,2009; Veliogluetal.,1998).
Intheotherhand,TPC ofskinextractsobtainedbydifferent methodsshowedsignificantdifference(Table6).TheTPCobtained byMAEmethod(54.84±0.41)wassignificantly(p<0.05)higher thanthatobtainedbyCSEmethod(39.57±0.23mg/g).Thesame observationisnotedfortheantioxidantactivity.IndeedtheABTS andtheFRPvalues(104.94±0.54and90.98±0.94mgEQ/gDW, respectively)ofextract obtainedby CSEwerelowerthan those obtainedby MAE (108.36±1.14and 93.52±1.11mg EQ/g DW, respectively).
For extracting phenolic compounds, Hithamani and Ramalakshmi,(2013)andRafieeetal.(2011)haveshownthatMAE wasmoreeffectivethantheconventionalextractionmethodswith reducinginextractiontime.Thereductionoftheextractiontime wasduetotheheatingmechanismofthemicrowaves(Rafieeetal., 2011;Yangetal.,2013).Anenhanceintemperatureaddstothe efficacyoftheprocess,indeedheat(1)decreasestheviscosityof thesolvent,whichmakeseasyitspassagethroughthesolidmatrix sotheefficiencyoftheextraction.Intheotherhand,it(2)increases thepermeabilityofcellwallswhichpromotesthesolubilityand thediffusioncoefficientsofthebiologicalactivecompoundstobe extracted(Afoakwahetal.,2012;Muthuselvietal.,2012;Wissam etal.,2012);Asaresult,microwaveincomparisontoconventional extractioncanextractpolyphenolsinshortertimes(Bayramoglu etal.,2008).
Theshorterextractiontimeinmicrowaveprocessingcanreduce thedegradationofbiologicalactivecompounds(Inceetal.,2014; Ravaljietal.,2012),whichexplainstheresultoftheantioxidant activityofgrapeskinextracts.In fact,theloweractivityofCSE extractcouldbearesultoftheextensionintheextractiontime; thelongexposureoftheextractstounfavorableconditionssuch aslight,togetherwithoxygenandtemperature,isthemost impor-tantfactorthatfacilitatesdegradationreactions(Garcia-Salasetal., 2010).
4. Conclusion
Theaimofthisstudywas,ontheonehand,toobtaina bet-tersurveyintooptimizationofextractionconditionsofphenolic compoundsfrom Algerian grapecv. AhmarBou-Amar withtwo extractionmethods(CSEandMAE)usingRSM,andontheother handtocomparethoseextractionmethodsbasedonthemaximum TPCandantioxidantactivitymeasuredwithABTSandFRP.
Theresultsindicatedthatthemathematicalmodelsusedinthe presentinvestigationworkwellforthepredictionofTPCextraction fromgrapecv.AhmarBou-Amarseedsandskin.Thus,thetwo stud-iedextractionmethodsweresuccessfullyoptimizedbyBBDand CCDofRSM.Ontheotherhand,theTPCofseedsextractobtained
withMAEwas24%lowerthanthatoftheCSEextract;also,the antioxidantactivityofCSEextract wasbetterthan thatofMAE extract.While,theTPCofskinextractobtainedwithMAEwas28% higherthanthatoftheCSEextractandtheantioxidantcapacitywas significantlyhigherthanthatoftheCSEextract.Therefore,(1)itcan beconcludedthat,MAEisagoodalternativefortheextractionof phenoliccompoundsfromgrapeskinofthestudiedvariety,sinceit providesahighquantityandahighantioxidantqualitycompared toCSEbydrasticallyreducingthetimeoftheprocess(98%).(2)In ordertomaximizerecoveryofTPCfromgrapeseedsofthestudied variety,itisbettertorealizetheextractionwithCSEmethodwith longerextractiontimecomparedtoMAE,butitisnoteworthyto pointthat,MAEpermitstoextractinonly58.63sabout76%ofTPC whichwereextractedbyCSEduring65.23min.
Thus,fromthepointofviewofindustrialapplication,MAEcan berecommendedforextractingantioxidantcompoundsfromgrape cv.AhmarBou-Amarbyproductswithareductioninextractiontime ofabout98%comparedtoCSE.Additionally,fortheirhigh con-tentsofphenoliccompoundsincomparisontoothersvarieties,the extractsofgrapecv.AhmarBou-Amarseedsandskincanbe consid-eredasagoodsourceofnaturalantioxidantsandmaybeexploited asnaturalantioxidantagentsforhealthfoodassubstituted antiox-idanttothesyntheticantioxidantswithgreatcommercialinterest inthefoodandphyto-pharmaceuticalmarket.
Acknowledgements
WewouldliketothankallmembersofUVVlaboratoryatthe INRAofAngers(France)fortheirprecioushelp,especiallyGérard Barbeau,Marie-HélèneBouvetandAnneMège.Aswellasaspecial thanktoMrsWahibaAzegaghforherprovidingEnglishlanguage help.
References
Afoakwah,A.N.,Owusu,J.,Adomako,C.,Teye,E.,2012.Microwaveassisted extraction(MAE)ofantioxidantconstituentsinplantmaterials.GlobalJ. Bio-sciBiotech.1(2),132–140.
Al-Farsi,M.A.,Lee,C.Y.,2008.Optimizationofphenolicsanddietaryfibre extractionfromdateseeds.FoodChem.108,977–985.
Andjelkovic,M.,Radovanovi ´c,B.,Radovanovi ´c,A.,Andjelkovic,A.M.,2013.Changes inPolyphenoliccontentandantioxidantactivityofgrapescvvranacduring ripening.Weather34(2),147–155.
Awika,J.M.,Rooney,L.W.,Wu,X.,Prior,R.L.,Cisneros-Zevallos,L.,2003.Screening methodstomeasureantioxidantactivityofsorghum(Sorghumbicolor)and sorghumproducts.J.Agric.FoodChem.51(23),6657–6662.
Bayramoglu,B.,Sahin,S.,Sumnu,G.,2008.Solvent-freemicrowaveextractionof essentialoilfromoregano.J.FoodEng.88,535–540.
Bimakr,M.,Rahman,R.A.,SaleenaTaip,F.,Adzahan,N.M.,IslamSarker,Z.,Ganjloo, A.,2013.Ultrasound-assistedextractionofvaluablecompoundsfromwinter melon(Benincasahispida)seeds.IntFoodRes.J.20(1),331–338.
Bordiga,M.,Travaglia,F.,Locatelli,M.,Coisson,J.D.,MarcoArlorio,M.,2011.
Characterizationofpolymericskinandseedproanthocyanidinsduring ripeninginsixVitisViniferaL.CV.FoodChem.127,180–187.
Buci ´c-Koji ´c,A.,Planini ´c,M.,Tomas,S.,Bili ´c,M.,Veli ´c,D.,2007.Studyof solid–liquidextractionkineticsoftotalpolyphenolsfromgrapeseeds.J.Food Eng.81,236–242.
Cadot,Y.,Chevalier,M.,Barbeau,G.,2011.Evolutionofthelocalisationand compositionofphenolicsingrapeskinbetweenveraisonandmaturityin relationtowateravailabilityandsomeclimaticconditions.J.Sci.FoodAgric. 91(11),1963–1976.
Cadot,Y.,Chevalier,M.,Minana-Castello,M.T.,Moutounet,M.,2008.Lepotentiel phénoliqueducabernetfranc.Ed.Conceptioncouverture:Terredessciences. INRAAngers,France.
Cadot,Y.,Minana-Castello,M.T.,Chevalier,M.,2006.Anatomical,histological,and histochemicalchangesingrapeseedsfromVitisviniferaL.cvcabernetfranc duringfruitdevelopment.J.Agric.FoodChem.54(24),9206–9215.
Carrera,C.,Ruiz-Rodríguez,A.,Palma,M.,Barroso,C.G.,2012.Ultrasoundassisted extractionofphenoliccompoundsfromgrapes.Anal.Chim.Acta732,100–104.
Casazza,A.A.,Aliakbarian,B.,Mantegna,S.,Cravotto,G.,Perego,P.,2010.Extraction ofphenolicsfromVitisviniferawastesusingnon-conventionaltechniques.J. FoodEng.100,50–55.
Chaalal,M.,Touati,N.,Louaileche,H.,2012.Extractionofphenoliccompoundsand invitroantioxidantcapacityofpricklypearseeds.ActaBot.Gallica159(4), 467–475.
Chew,K.K.,Ng,S.Y.,Thoo,Y.Y.,Khoo,M.Z.,Aida,W.M.,Ho,C.W.,2011.Effectof ethanolconcentration,extractiontimeandextractiontemperatureonthe recoveryofphenoliccompoundsandantioxidantcapacityofCentellaasiatica extracts.Int.FoodRes.J.18,571–578.
Cheynier,V.,Moutounet,M.,Sarni-Manchado,P.,1998.Lescomposésphénoliques. In:Œnologie-Fondementsscientifiquesettechnologiques,Flanzy(Coord)Tec &Doc,Lavoisier,Paris,pp.125–162.
Dahmoune,F.,Boulekbache,L.,Moussi,K.,Aoun,O.,Spigno,G.,Madani,K.,2013.
ValorizationofCitruslimonresiduesfortherecoveryofantioxidants: evaluationandoptimizationofmicrowaveandultrasoundapplicationto solventextraction.Ind.CropsProd.50,77–87.
Dahmoune,F.,Spigno,G.,Moussi,K.,Remini,H.,Cherbal,A.,Madani,K.,2014.
Pistacialentiscusleavesasasourceofphenoliccompounds: microwave-assistedextractionoptimizedandcomparedwith
ultrasound-assistedandconventionalsolventextraction.Ind.CropsProd.61, 31–40.
Dragovi ´c-Uzelac,V.,ElezGarofulic´ı,I.,Jukic´ı,M.,Penic´ı,M.,Dent,M.,2012.The influenceofmicrowave-assistedextractionontheisolationofsage(Salvia officinalisL.)polyphenols.FoodTechnol.Biotech.50(3),377–383.
Garcia-Salas,P.,Morales-Soto,A.,Segura-Carretero,A.,Fernández-Gutiérrez,A., 2010.Phenolic-compound-extractionsystemsforfruitandvegetablesamples. Molecules15,8813–8826.
Ghafoor,K.,Park,J.,Choi,Y.H.,2010.Optimizationofsupercriticalfluidextraction ofbioactivecompoundsfromgrape(VitislabruscaB.)peelbyusingresponse surfacemethodology.JTInnov.FoodSci.Emer.Technol.11,485–490.
Goupy,J.,Creighton,L.,2006.Ordredesessais.In:Introductionauxplans d’expériences.3edEd.Dunod,Paris.PP.147–177.
Hithamani,G.,Ramalakshmi,K.,2013.Microwaveassistedextractionofphenolics fromOriganumvulgare.Int.J.Agric.SoilSci.1(1),7–12.
Ince,A.E.,Sahin,S.,Sumnu,G.,2014.Comparisonofmicrowaveand
ultrasound-assistedextractiontechniquesforleachingofphenoliccompounds fromnettle.J.FoodSci.Technol.51(10),2776–2782.
Katalinic,V.,Mozina,S.S.,Skroza,D.,IvanaGeneralic,I.,Abramovic,H.,Milos,M., Ljubenkov,I.,Piskernik,S.,Pezo,I.,Terpinc,P.,Boban,M.,2010.Polyphenolic profile,antioxidantpropertiesandantimicrobialactivityofgrapeskinextracts of14VitisviniferavarietiesgrowninDalmatia(Croatia).FoodChem.119, 715–723.
Kennedy,J.A.,Matthews,M.A.,Waterhouse,A.L.,2002.EffectofMaturityandVine WaterStatusonGrapeSkinandWineFlavonoids.Am.J.Enol.Vitic.53(4), 268–274.
Krishnaswamy,K.,Orsat,V.,Gariépy,Y.,Thangavel,K.,2012.Optimizationof microwave-assistedextractionofphenolicantioxidantsfromgrapeseeds(Vitis vinifera).FoodBioprocessTechnol., http://dx.doi.org/10.1007/s11947-012-0800-2.
Liazid,A.,Palma,M.,Brigui,J.,Barroso,G.C.,2007.Investigationonphenolic compoundsstabilityduringmicrowave-assistedextraction.J.Chromatogr.A. 1140,29–34.
Lopez-Avlia,V.,Young,R.,1994.Microwave-assistedextractionoforganic compoundsfromstandardreferencesoilsandsediments.Anal.Chem.66(7), 1097–1106.
Makkar,H.P.S.,Becker,K.,1996.EffectofpH,temperature,andtimeoninactivation oftanninsandpossibleimplicationsindetannificationstudies.J.Agric.Food Chem.44(5),1291–1295.
Muthuselvi,S.,Sathishkumar,T.,Kumaresan,K.,MohanRajeshkumar,M.,2012.
ImprovedinulinaseactivitybyPenicilliumpurpurogenumgrowninmicrowave pretreatedcoffeespentbyorthogonaldesignofexperiment.Inn.Roman.Food Biotech.11,44–59.
Naczk,M.,Shahidi,F.,2004.Extractionandanalysisofphenolicsinfood.J. Chromatogr.A1054,95–111.
Nelson,K.E.,1979.HarvestingandHandlingCaliforniaTableGrapesforMarket.Ag. Sc.UCNARPublications.UniversityofCalifornia,Berkeley,pp.2.
Oyaizu,M.,1986.Studiesonproductsofbrowningreactionsantioxidative activitiesofproductsofbrowningreactionpreparedfromglucosamine.Jpn.J. Nutr.44,307–325.
Padmaja,G.,1989.Evaluationoftechniquestoreduceassayabletanninand cyanideincassavaleaves.J.Agric.FoodChem.37,712–716.
Pinelo,M.,DelFabbro,P.,Manzocco,L.,Nunez,M.J.,Nicoli,M.C.,2005a.
OptimizationofcontinuousphenolextractionfromVitisviniferabyproducts. FoodChem.92,109–117.
Pinelo,M.,Rubilar,M.,Jerez,M.,Sineiro,J.,Nunez,M.J.,2005b.Effectofsolvent, temperature,andsolvent-to-solidratioonthetotalphenoliccontentand antiradicalactivityofextractsfromdifferentcomponentsofgrapepomace.J. Agric.FoodChem.53,2111–2117.
Pourali,A.,Afrouziyeh,M.,Moghaddaszadeh-ahrabi,S.,2014.Extractionof phenoliccompoundsandquantificationofthetotalphenolofgrapepomace. Eur.J.Exp.Biol.4(1),174–176.
Rafiee,Z.,Jafari,S.M.,Alami,M.,Khomeiri,M.,2011.Microwave-assisted extractionofphenoliccompoundsfromoliveleaves;acomparisonwith maceration.J.Anim.PlantSci.21(4),738–745.
Ravalji,N.H.,Shah,B.N.,Modi,D.C.,Lambole,V.B.,2012.Novelapproachfor isolationofmucilagefromLuffaactangulafruitsandscreeningofitsbinding property.Int.J.Pharm.Sci.3(3),2199–2210.
Rivera-Dominguez,M.,Yahia,E.M.,Wlodarchak,N.,Kushad,M.,2010.
Identificationandquantificationofphenoliccompoundsingrapes.ActaHort. 877,1233–1240.
Rodrigues,S.,Pinto,G.A.S.,Fernandes,F.A.N.,2008.Optimizationofultrasound extractionofphenoliccompoundsfromcoconut(Cocosnucifera)shellpowder byresponsesurfacemethodology.Ultrason.Sonochem.15,95–100.
Shi,J.,Yu,J.,Pohorly,J.E.,Kakuda,Y.,2003.Polyphenolicsingrape seeds-biochemistryandfunctionality.J.MedFood.6(4),291–299.
Slusarczyk,S.,Hajnos,M.,Skalicka-Wozniak,K.,Matkowski,A.,2009.Antioxidant activityofpolyphenolsfromLycopuslucidusTurcz.FoodChem.113,134–138.
Spigno,G.,Tramelli,L.,DeFaveri,D.M.,2007.Effectsofextractiontime, temperatureandsolventonconcentrationandantioxidantactivityofgrape marcphenolics.J.FoodEng.81,200–208.
Thabit,R.A.S.,Cheng,X.R.,Tang,X.,Shi,H.W.,Shi,Y.H.,Guo-WeiLe,G.W.,2014.
OptimizationofExtractionofPhenolicContentfromConyzabonariensis.J. Chem.Soc.Pak.36(5),895–905.
Tomãs-Barberãn,F.A.,Espin,J.C.,2001.Phenoliccompoundsandrelatedenzymes asdeterminantsofqualityinfruitsandvegetables.J.Sci.FoodAgric.81, 853–876.
Velioglu,Y.S.,Mazza,G.,Gao,L.,Oomah,B.D.,1998.Antioxidantactivityandtotal phenolicsinselectedfruits,vegetables,andgrainproducts.J.Agric.Food Chem.46,4113–4117.
Wissam,Z.,Ghada,B.,Wassim,A.,Warid,K.,2012.Effectiveextractionof polyphenolsandproanthocyanidinsfrompomegranate’speel.Int.J.Pharm.4 (3),675–682.
Wong-Paz,J.E.,Contreras-Esquivel,J.C.,Mu ˜niz-Marquez,D.,Belmares,R., Rodriguez,R.,Flores,P.,Aguilar,C.N.,2014.Microwave-assistedextractionof phenolicantioxidantsfromsemiaridplants.Am.J.Agric.Biol.Sci.9(3), 299–310.
Yang,J.,Martinson,T.E.,Liu,R.H.,2009.Phytochemicalprofilesandantioxidant activitiesofwinwgrapes.FoodChem.116,332–339.
Yang,Y.C.,Yang,Z.W.,Zhang,Z.H.,Li,J.,Zu,Y.G.,Fu,Y.J.,2013.Effectofacid hydrolysisinthemicrowave-assistedextractionofphenoliccompoundsfrom GeraniumsibiricumLinnewiththeguidanceofantibacterialactivity.J.Med. PlantsRes.7(14),819–830.
Yilmaz,Y.,Toledo,R.T.,2006.Oxygenradicalabsorbancecapacitiesofgrape/wine industrybyproductsandeffectofsolventtypeonextractionofgrapeseed polyphenols.J.FoodCompos.Anal.19,41–48.
Zheng,X.,Liu,B.LiL,Zhu,X.,2011.Microwave-assistedextractionandantioxidant activityoftotalphenoliccompoundsfrompomegranatepeel.J.MedPlants Res.5(6),1004–1011.