HAL Id: hal-00833831
https://hal.univ-brest.fr/hal-00833831
Submitted on 13 Jun 2013
HAL is a multi-disciplinary open access
archive for the deposit and dissemination of
sci-entific research documents, whether they are
pub-lished or not. The documents may come from
teaching and research institutions in France or
abroad, or from public or private research centers.
L’archive ouverte pluridisciplinaire HAL, est
destinée au dépôt et à la diffusion de documents
scientifiques de niveau recherche, publiés ou non,
émanant des établissements d’enseignement et de
recherche français ou étrangers, des laboratoires
publics ou privés.
with bacterial infection in pacific oyster larvae.
Bertrand Genard, Philippe Miner, Jean-Louis Nicolas, Dario Moraga, Pierre
Boudry, Fabrice Pernet, Réjean Tremblay
To cite this version:
Bertrand Genard, Philippe Miner, Jean-Louis Nicolas, Dario Moraga, Pierre Boudry, et al.. Integrative
study of physiological changes associated with bacterial infection in pacific oyster larvae.. PLoS ONE,
Public Library of Science, 2013, 8 (5), pp.e64534. �10.1371/journal.pone.0064534�. �hal-00833831�
with Bacterial Infection in Pacific Oyster Larvae
Bertrand Genard1*, Philippe Miner2, Jean-Louis Nicolas2, Dario Moraga3, Pierre Boudry2, Fabrice Pernet2, Re´jean Tremblay1
1 Institut des sciences de la mer, Universite´ du Que´bec a` Rimouski, Rimouski, Que´bec, Canada, 2 Unite´ de recherche Physiologie Fonctionnelle des Organismes Marins, Laboratoire des Sciences de l9Environnement Marin (LEMAR), Institut Franc¸ais de Recherche pour l9Exploitation de la Mer (IFREMER), Plouzane´, France,3 Laboratoire des Sciences de l9Environnement Marin (LEMAR), Institut Universitaire Europe´en de la Mer, Universite´ de Bretagne Occidentale, Plouzane´, France
Abstract
Background:Bacterial infections are common in bivalve larvae and can lead to significant mortality, notably in hatcheries. Numerous studies have identified the pathogenic bacteria involved in such mortalities, but physiological changes associated with pathogen exposure at larval stage are still poorly understood. In the present study, we used an integrative approach including physiological, enzymatic, biochemical, and molecular analyses to investigate changes in energy metabolism, lipid remodelling, cellular stress, and immune status of Crassostrea gigas larvae subjected to experimental infection with the pathogenic bacteria Vibrio coralliilyticus.
Findings:Our results showed that V. coralliilyticus exposure induced (1) limited but significant increase of larvae mortality compared with controls, (2) declined feeding activity, which resulted in energy status changes (i.e. reserve consumption, b-oxidation, decline of metabolic rate), (3) fatty acid remodeling of polar lipids (changes in phosphatidylinositol and lysophosphatidylcholine composition```,non-methylene–interrupted fatty acids accumulation, lower content of major C20
polyunsaturated fatty acids as well as activation of desaturases, phospholipase and lipoxygenase), (4) activation of antioxidant defenses (catalase, superoxide dismutase, peroxiredoxin) and cytoprotective processes (heat shock protein 70, pernin), and (5) activation of the immune response (non-self recognition, NF-kk signaling pathway, haematopoiesis, eiconosoids and lysophosphatidyl acid synthesis, inhibitor of metalloproteinase and antimicrobial peptides).
Conclusion:Overall, our results allowed us to propose an integrative view of changes induced by a bacterial infection in Pacific oyster larvae, opening new perspectives on the response of marine bivalve larvae to infections.
Citation: Genard B, Miner P, Nicolas J-L, Moraga D, Boudry P, et al. (2013) Integrative Study of Physiological Changes Associated with Bacterial Infection in Pacific Oyster Larvae. PLoS ONE 8(5): e64534. doi:10.1371/journal.pone.0064534
Editor: Jun Sun, Rush University Medical Center, United States of America Received September 18, 2012; Accepted April 16, 2013; Published May 21, 2013
Copyright: ß 2013 Genard et al. This is an open-access article distributed under the terms of the Creative Commons Attribution License, which permits unrestricted use, distribution, and reproduction in any medium, provided the original author and source are credited.
Funding: This work was supported by the discovery grants program (individual, 299100) of the Natural Sciences and Engineering Research Council of Canada (http://www.nserc-crsng.gc.ca/professors-professeurs/grants-subs/dgigp-psigp_eng.asp). The funders had no role in study design, data collection and analysis, decision to publish, or preparation of the manuscript.
Competing Interests: The authors have declared that no competing interests exist. * E-mail: bertrand.genard@uqar.qc.ca
Introduction
Bacterial infections can have serious consequences on the survival of bivalve larvae depending on host–pathogen interac-tions. When a pathogen infects a host, multiple reactions occur, initiated both by the pathogen in an attempt to survive and multiply, and by the host in an attempt to eliminate the pathogen. For the host, changes induced by infection can be seen at several levels such as molecular, physiological and biochemical processes. First, infection induces the activation of both cellular and humoral immune responses that act together to kill and eliminate the infecting bacteria. In bivalves, immunity is constituted of innate processes including various serologically active molecules (opso-nins, lysins, aggluti(opso-nins, and antimicrobial factors) and of the phagocytosis accompanied by production of oxygen metabolites and the release of lysosomal enzymes [1,2]. During the last decade, knowledge of immune processes in adult bivalves has been significantly improved by the development of genomic tools [3,4,5].However, the immune characteristics of larvae remain
underinvestigated, notably due to the difficulty to isolate haemo-cytes from larvae. Elston and Leibovitz [6] observed phagohaemo-cytes (described as coelomocytes) containing bacterial fragments in the visceral cavity of Crassostrea virginica veliger larvae. Recently, the work of Tirape et al. [7] suggested that haemocytes appear during the gastrula–trochophore developmental stages. In the blue mussel Mytilus galloprovincialis, the antimicrobial peptides mytilin and defensin have been found during and after larval metamorphosis [8]. Furthermore, lysozyme-like and hydrolytic enzyme activities are present in C. gigas larvae and juveniles [9,10]. Genomics approaches of immune-related genes expression in oyster larvae suggested that immune processes like Rel/NF-kB pathway, metalloproteinase inhibitor, non-self recognition, apoptosis and inflammatory response regulation occur as soon as larval stage [7,11]. Bivalve haemocytes seem to respond to bacterial stimula-tion with a burst of respiratory activity similarly to the respiratory burst of mammalian phagocytes, resulting in the generation of various free radicals or reactive oxygen species (ROS) that
eliminate the phagocytized material [12,13]. ROS production are controlled by antioxidant defense systems to limit tissue peroxi-dation. Several studies have highlighted the importance of these antioxidant defenses during summer mortality in C. gigas [3,14] and during mortality events in C. virginica larvae [15].
Pathogen exposure can also induce significant changes in larval energy metabolism. In C. virginica larvae, emergence of massive mortality coincided with both a decline in feeding activity and a metabolic depression, which could reduce the available energy for the immune response [15]. The energetic status of larvae can be estimated by lipid content, mainly triacylglycerols (TAG), which constitutes the main energy source during larval development [16,17]. Previous studies showed that TAG levels were higher in P. magellanicus sea scallops larvae treated with an antibiotic than in untreated controls showing significant mortality [18]. Similar results were found recently in C. virginica larvae when massive mortality happened [15].
Beside their energetic function, lipids (especially polyunsaturat-ed fatty acids: PUFA) are known to be essential for the development of bivalve larvae, especially to sustain growth and improve survival [19,20]. Moreover, C20 PUFAs, such as
eicosapentaenoic acid (EPA, 20:5[n-3]) and arachidonic acid (AA, 20:4[n-6]), are precursors of eicosanoids, a group of highly biologically active hormones including prostaglandins, leukotri-enes, and hydroxyeicosatetraenoic acids [21]. Eicosanoid produc-tion is associated with stressful condiproduc-tions. For example, excess eicosanoid production has been recorded under pathological conditions in invertebrates, especially insects [22]. AA levels in P. magellanicus showed a marked increase during the metamorphic stage co-occurring with elevated mortality and the establishment of pathogenic and opportunistic microbes in larval cultures [23]. Bacterial pathogens could also affect directly the composition of structural lipids and induce the degradation of tissue membranes by extracellular enzymes like phospholipases [24,25].
In the present study, all these aspects were investigated using physiological, enzymatic, biochemical and molecular analysis in order to propose an integrative view of changes associated to bacterial infection in C. gigas larvae. Briefly, we used a bacterial challenge with Vibrio coralliilyticus on C. gigas larvae to evaluate the impact of pathogen exposure (1) on larval survival, growth, and feeding activity, (2) on energetic metabolism activity, (3) on the content of protein, carbohydrate, lipid classes, and fatty acids in larvae, (4) on antioxidant defense activity and lipid peroxidation, and (5) on the expression levels of candidate genes involved in energy metabolism, lipid metabolism, cellular stress and immunity.
Methods
Rearing procedures and experimental design
This project was conducted at the Ifremer facilities in Plouzane´ (Brittany, France) and took place from mid-May to June 2008. Twenty adult oysters C. gigas were conditioned at the Ifremer experimental station in Argenton (Brittany, France). The spawning was induced by thermal shock and the fertilized eggs were transferred to a 150 L cylindro-conical tank. Larvae (20 ind. mL21 initially) were reared in the same kind of tank at 20uC in UV-treated filtered seawater with gentle aeration. Larvae were fed a mixture of Isochrysis affinis galbana and Chaetoceros calcitrans and food supply was carried out at each two days when water was renewed. Twelve days after fertilization (dpf), larvae were collected on a 100mm square mesh filter, visually counted, pooled, and distributed equally into 10 L beakers (,2006103 larvae per beaker). Larvae were cultured in duplicate with or without pathogen challenge (104bacteria per mL in final concentration)
over a period of 24 h or 48 h for a total of eight beakers (two unchallenged and challenged batches larvae per sampling time). Larvae were fed at the beginning of the experiment and samples were collected for physiological, biochemical, and molecular analyses at the end of the experiment at 24 h or 48 h (pool of ,406103
larvae per sample for each kind of analysis). An additional sample of larvae (12 dpf) was also collected before pathogen inoculation to be used as reference sample. Seawater from carboys was sampled for measurements of particles to estimate feeding activity and for microbiological analysis. Samples were immediately flash frozen in liquid nitrogen and stored at – 80uC. The pathogen used for bacterial challenge was V. coralliilyticus strain LPI 06/210 (16S rRNA accession number: HF549288) isolated from diseased oyster larvae. Although this bacterium was first described as a pathogen of coral [26], recent experimental infection demonstrated that this strain was strongly virulent to oyster larvae and provoked mass mortalities in oyster hatchery [27]. Prior to use this V. coralliilyticus, the strain kept at – 80uC was streaked onto marine agar gel to ensure purity and was further cultured in marine broth (Difco, Lawrence, KS, USA) and incubated at 25uC 24 h prior to use. Bacterial culture was centrifuged (6000 g, 15 min), the supernatant was discarded and the pellet was resuspended in 10 mL of sterile seawater. Optical density of bacterial suspension was read at 600 nm and compared to a standard of sterile seawater to determine the bacterial concentration. Correspondence between optical density and bacterial counts on marine agar was previously performed in the lab.
Larval performance
Shell length (SL), survival rate (% of live larvae), and feeding activity (number of cleared algal cells per larva per day) were estimated for each sample. Alive and dead larvae were distinguished and counted visually using a binocular microscope (Leitz Biomed, Wetzlar, Germany) in samples of 100–200 individuals. SL was measured with an inverted microscope (Leitz Leica DMIL, Wetzlar, Germany) equipped with a digital camera. Images were captured using the Turbo TV software and analyzed by Image SXM. Microalgal cell concentration was measured in triplicate with a Beckman-Coulter Z2 electronic particle counter (Beckman, USA) before and after experiments. Daily feeding activity was estimated as clearance rate = ((Nt = 0-Nt = final)/number
of larvae per mL)/ number of days, where N is the concentration of microalgal cells per mL introduced (t = 0) and at the end of experiment (t = final).
Lipid class and fatty acid analyses
Methods used to determine profiles of lipid classes and fatty acids were described in Haberkorn et al. [28] and Pernet et al. [29] respectively. Briefly, after extraction in a CHCl3–CH3OH
mixture, neutral and polar lipids from samples of larvae and microalgae were extracted using silica gel micro-columns. Neutral and polar fractions were used for lipid classes and fatty acid determination. For lipid class determination, samples were spotted on activated silica plates using a CAMAG automatic sampler (CAMAG, Switzerland) and plates were eluted in specific solvent to separate neutral and polar classes. Lipid classes appeared as black spots after plates were dipped in a CuSO4–H3PO4solution
and heated. Plates were read by scanning at 370 nm, and black spots were quantified using Wincats software (CAMAG, Switzer-land). Five neutral lipid classes (free fatty acids [FFA], alcohols [AL], mono-diacylglycerols [DG-MG], triacylglycerols [TAG], sterols [ST]) and seven polar lipid classes (cardiolipin or bispho-sphatidylglycerol [Cardio], lysophosphatidylcholine [LPC],
phos-phatidylcholine [PC], phosphatidylethanolamine [PE], phosphati-dylserine [PS], phosphatidylinositol [PI], ceramide aminoethyl-phosphonate [CAEP]) were identified based upon authentic standards (Sigma–Aldrich, St Louis, MO, USA). Results were expressed as a percent proportion of the mass of total lipids. Masses of neutral and polar lipids were assessed by summation of lipid classes and expressed by number of larvae. Analyses of fatty acid profiles were also performed on neutral and polar lipids. The transesterified lipids (FAME) were analyzed by gas chromatograph (Hewlett Packard, Palo Alto, CA, USA) using a DB-Wax (30 m60.25 mm; 0.25mm film thickness) capillary column cou-pled with a flame ionization detector. Fatty acids were identified by comparing their retention times with those of standards using the Chem Station software (Hewlett Packard, Palo Alto, CA, USA). Here again, results for fatty acid profiles were expressed as a percentage of the total fatty acid mass of each lipid fraction. The peroxidation index (PInd) was calculated as PInd = 0.025 (% monoenoics)+16(% dienoics)+26(% trienoics)+46(% tetrae-noics)+66(% pentaenoics)+86(% hexaenoics).
Spectrophotometric analyses
Samples for spectrophotometric analysis were homogenized on ice in phosphate buffered saline (PBS: 80 mM; pH 7.6 at 25uC) with 0.1% (v/v) triton X-100 using a polytron homogenizer. A fraction of the homogenate was stored at –80uC for the determination of total carbohydrate and protein concentrations. The remaining sample was centrifuged (15,000 g) at 4uC for 10 min and the supernatant collected and stored at –80uC. Total carbohydrate and protein contents were measured colorimetrically as described by DuBois et al.[30] and Lowry et al.[31] respectively. The activities of seven enzymes were recorded in this study. Three were related to energy metabolism (pyruvate kinase, citrate synthase, cytochrome c oxidase) and four to antioxidant defenses (catalase, glutathione peroxidase, glutathione reductase, superox-ide dismutase). The oxidative stress level was evaluated by measuring the lipid peroxidation. Methods for assaying enzyme activities of citrate synthase (CS), cytochrome c oxidase (CCO), catalase (CAT), glutathione peroxidase (GPX), superoxide dis-mutase (SOD), and the determination of lipid peroxidation levels (TBARS) were described in Genard et al. [15]. Pyruvate kinase (PK) activity was assayed according to the protocol of Childress and Somero [32] adapted for microplate reader [33] and the glutathione reductase (GR) activity was determined according to Smith et al. [34] after modification for microplate reader.
RNA extraction and real-time PCR
Total RNA was extracted for each larva sample using TRIzolTMReagent (Invitrogen, Carlsbad, CA, USA) according to the manufacturer’s protocol. RNA was resuspended in RNase-free water and concentrations were determined using a Nanodrop spectrophotometer (Thermofisher, Wilmington, DE, USA). RNA extracted from larvae was reverse transcribed using the RevertAid H Minus First Strand cDNA synthesis kit (Fermentas, Burlington, ON, Canada). Real-time PCR was performed on cDNA (1/120 dilution) using a 7300 Real-Time PCR System (Applied Biosys-tems, Foster City, CA, USA). Reaction component concentrations and real-time PCR settings were described in Genard et al. [11]. Each run included a negative control (non-reverse transcribed total RNA) and blank controls (water) for each primer pair. The threshold value (Ct) was determined for each gene as the number of cycles at which the fluorescence curve entered exponential phase. A sequential dilution of cDNA was performed for each set of primers in order to estimate the amplification efficiency using the equation Efficiency = 10(21/slope)21. The relative
quantifica-tion (RQ) of each gene expression was calculated according to the comparative Ct method [35] using the formula RQ = (ETG)(Ct HG(cal) - Ct HG(spl))
/ (EHG)(Ct TG(cal) - Ct TG (spl)), where ETGand EHG
are the amplification efficiencies of the target and housekeeping (ribosomal 18S) genes, respectively, and Ct HG and Ct TG are the threshold values of the housekeeping and target genes in the calibrator (cal) or target sample (spl). Larvae sampled before pathogen challenge were used for calibration. Oligonucleotide primer sequences used to amplify specific gene products are given in Table 1. Selected genes were classified into four groups: energy metabolism, lipid metabolism, cellular stress and immunity.
Microbiological analyses
RT PCR-DGGE. The bacterial populations in seawater were analyzed after RNA extraction followed by reverse transcription (RT) RNA and then amplification of partial 16S rRNA gene by polymerase chain reaction (PCR). The different sequences were separated by denaturing gradient gel electrophoresis (DGGE) resulting in a fingerprint of active bacteria. Analyses targeting rRNA are usually expected to be more relevant than those targeting bacterial DNA because metabolically active cells contain a higher level of intracellular 16S rRNA than quiescent cells. The RNA from water, microalgal food, V. coralliilyticus and larvae was extracted then reverse transcribed according to protocols de-scribed above in the RNA extraction and real-time PCR section. PCR was performed on formed cDNA using 16S rDNA gene primer sets (341f-GC: 59-GC-clamp-CCTTACGGGAGG-CAGCA-39 and 518r: 59-ATTACCGCGGCTGCTGG-39). PCR products were loaded onto 8% (w/v) polyacrylamide gel with a denaturing gradient ranging from 40 to 80% for eubacterial primers. DGGE was carried out with the D-code DGGE system (Bio-Rad Laboratories, France). After electrophoresis, gels were stained with SYBR-gold and revealed at 540 nm using a fluorimager (typhoon 9400, Amersham). The number of bands was determined visually for each sample. A similarity matrix using Jaccard’s distance index (Sjaccard) was used to compare the
fingerprints. The Jaccard index was calculated as Sjaccard= NAB/
(NA+NB 2 NAB), where NAB is the number of similar bands
between samples A and B; NA or Bis the sum of all bands in sample
A or B. Specific DGGE bands chosen by comparison with bacterial controls were excised from gels in order to detect V. coralliilyticus during the experiment. The excised bands were amplified with 341f without the GC-clamp and 518r. The amplified products were then cloned into PCR II plasmids using the TA cloning kit and transformed into Escherichia coli DH5a (Fisher Scientific SA, France) according to the manufacturer’s instructions. The DNA sequencing was done using the SP6 promoter primer using capillaryABI3130 XL sequencer (Applied Biosystems, Foster City, CA, USA). Sequences were analyzed using the Bioedit software and were compared to the GenBank database using the online software and the Basic Local Alignment Search Tool algorithm (BLAST). Details of PCR-DGGE and sequencing methods were described in Azandegbe et al. [36].
Flow cytometry. To complement DGGE analyses, the total bacterial load was also measured by flow cytometry [37]. Before freezing, 1% glutaraldehyde was added on seawater samples. Frozen water samples were then quickly thawed in a 30uC water bath and were stained with SYBR Green I (Invitrogen). Bacteria were counted with an Epics Altra flow cytometer (Beckman Coulter) fitted with a 488 nm laser operated at 15 mW. The green fluorescence of nucleic-acid–bound SYBR Green I was measured at 52565 nm. The analyzed sample volume was determined from the change in mass corrected for a dead volume (the water volume taken from the sample tube but not yet counted when data
acquisition is stopped). The cytograms obtained were analyzed using Expo32 v1.2b software (Beckman Coulter).
Statistical analyses
Analyses for growth and feeding activity were carried out using the SASH Software system (8.2). The significance value for all analyses was set at p , 0.05. PROC GLM (two-way ANOVA) was used to estimate the effect of bacterial challenge, experiment time, and their interaction. Where differences were detected, LSMEANS (t-test) tests for multiple comparisons were used to determine which means were significantly different. Residuals were graphically assessed for normality using the PROC PLOT function coupled with the univariate procedure (PROC UNI-VARIATE). Homogeneity was tested using the O’Brien test. Significant differences (p , 0.05) on survival rate between challenged and unchallenged ones at each time of the experiment were evaluated using Khi square tests (chisq.test script on R-language) performed on counts of dead and alive larvae.
A canonical redundancy analysis (RDA) was performed as a form of MANOVA, as proposed by Legendre and Anderson [38]. This method allows an estimation of the fraction of variation in 117 response variables (biochemical, physiological, and molecular parameters) attributable to the explanatory variables (time, bacterial challenge, and their interaction). This method, which is valid for small samples and non-normally distributed data, can be described as a serie of multiple regressions followed by a principal component analysis where each response variable, Y, is regressed on the matrix corresponding to the explanatory variables, X [39]. More precisely, matrices for challenge and time effect were coded using orthogonal dummy variables, and the interaction matrix was obtained by computing the product of the dummy variables representing the challenge and time effects. Each explanatory variable was individually tested with the others as covariables (matrix Y) to remove the variance explained by these other factors. An overall test of significance of the canonical relationship (999 permutations) and an ordination biplot (Z-plot type) were generated from the RDA results using plotRDA function [39]. The biplot displays both differences between batches of larvae and correlations between the response and explanatory variables. The main features of a correlation biplot are the following: (1) Projecting an object at right angle on a response (X) or explanatory (Y) variable approximates the value of the object along that variable. (2) The angles between variables (from sets X and Y) in the biplot reflect their correlations.
The first RDA was performed on the whole data set (i.e. 117 variables). A second set of RDA was also performed to estimate the challenge effect at each time and the time effect in challenged and unchallenged larvae. For this second set of RDA, four explanatory variables were built: ‘‘Chal24’’ and ‘‘Chal48’’ for the challenge effect at 24 h and 48 h, respectively, and ‘‘Time Chal’’ and ‘‘Time Unchal’’ for the time effect in challenged and unchallenged larvae. RDA results related to this second set were regrouped in two biplots, one illustrating the challenge effect and a second showing temporal change. Multiple comparisons (t-tests) were used to test the significance of differences observed in RDA. Due to the high number of variables, only those showing a significant difference for challenge and/or time effect in tests for multiple comparisons were included in the corresponding biplots. Concerning lipid profiles, although all fatty acids were analyzed, only essential fatty acid and sum of fatty acid classes were presented and discussed because of their importance in larval development and immunity (for overall fatty acid profiles see Tables S2.2 and S2.3 in File S2).
The R-language package rdaTest, available on the Web page http://www.bio.umontreal.ca/legendre/indexEn.html, was used
to compute the canonical analyses (RDA) and produce biplot graphs. A posteriori comparison tests (LSMEANS, 8.2 SASH software) were used to estimate the significance of differences observed in RDA. If normality precepts were not observed, data were LOG transformed.
Results
Larval performance
Bacterial challenge affected directly larval survival with 13% and 17% of mortality rate in challenged larvae compared to 5% and 7% in control larvae after 24 h and 48 h, respectively (Figure 1). Significant interactions between time and bacterial challenge were observed for feeding activity. Feeding activity decreased significantly after 48 h of pathogen exposure, down to 67% less than in unchallenged larvae (Figure 1). Concerning growth, no significant effects of the challenge were noted in shell length after bacterial challenge (p-value: challenge = 0.407, time = 0.066, interaction = 0.731) with an average growth rate of 4.960.8mm day21 (over 48 h in comparison with the size of reference larvae) for both larvae batches.
Bacterial community analyses
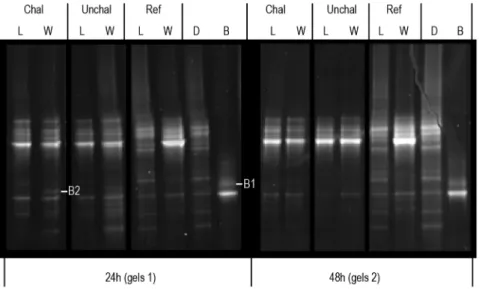
Two bands were excised from DGGE gels used for V. coralliilyticus detection (Figure 2). After DNA sequencing, the BLAST treatment confirmed that the sequences obtained were highly similar to V. coralliilyticus 16S rRNA gene (see Tables S1.1 and S1.2 in File S1 for BLAST results and Figure S1.1 in File S1 for sequence alignment). In seawater, V. coralliilyticus was detected only 24 h after the beginning of the challenge. The Jaccard index matrix showed similarities between duplicates greater than 90%. Furthermore, in addition to the presence/absence of bands associated with V. coralliilyticus, high similarity (above 75%) was found between the DGGE profiles of challenged and unchallenged larvae at 24 h and 48 h. These results showed that pathogen inoculation induced limited changes in the active bacteria environment throughout the experiment. Flow cytometry analyses revealed a significant decline in the bacterial load (BL) after 48 h, independently of bacterial challenge (Time: p-value = 0.046; BL24 h: 1.3610560.1 bacteria mL21; BL48 h: 0.9610560.1
bacteria mL21).
Redundancy analysis
The first set of RDA performed on the whole data set (i.e. 117 variables) shown that the overall variance was explained signifi-cantly by time, bacterial challenge and their interaction (challenge: R2: 0.26, F: 3.79, p: 0.03; time: R2: 0.26, F: 4.22, p: 0.026; interaction: R2: 0.19, F: 2.80, p: 0.031). The significant interaction effect led us to test the effect of each factor separately in each class of the other factor. For this, the second set of RDA analyses was performed to estimate the challenge effect at each time and the time effect in challenged and unchallenged larvae. Multiple comparisons used to test the significance of differences observed in these RDA showed that 52 parameters varied significantly with bacterial challenge and 57 with time. The mean, standard deviation, and variance explained by the RDA modelas well as results of multiple comparisons for each response variable are summarized in Tables S2.1 to S2.5 of File S2. Because we investigated changes associated to pathogen exposure, only results about challenge effect were presented in this section but the biplot illustrating time effect was included in Figure S3.1 of File S3.
RDA analyses performed on the 52 response variables showing a significant effect of challenge at 24 and/or 48 h (R2adj.: 0.48, F: 4.22, p: 0.01) indicated that pathogen exposure explained 63% of
the overall variance of these selected variables. The resulting biplot presented in figure 3 showed that physiological changes associated to pathogen exposure were principally observed after 48 h. Means, standard deviation and results of multiple comparisons for selected response variables associated to energetic metabolism, lipids, immunity and oxidative stress were regrouped in tables 2, 3 and 4 respectively. Response variables could be classified into groups of highly correlated variables in function of their response to pathogen exposure. In regard of the functional group studied, we found that the impact of V. coralliilyticus exposure on energy metabolism in larvae could be seen after 48 h by the lower relative expression of three genes related to energy production (CCOi,
AS6, NADHOX) and by the lower activities of cytochrome c oxidase (CCO-A, 0.4760.03 vs 0.6260.02 pmol larva21min21) and pyruvate kinase (PK-A, 6.0560.41 vs 8.6960.32 pmol larva21min21) comparatively to uninfected animals.
Apart from effects related to energy metabolism, bacterial challenge induced changes in lipid composition and protein content. After 48 h, challenged larvae had lower protein (38.0160.21 vs 43.4362.49 ng larva21) and neutral lipid contents (2.160.1 vs 4.760.2 ng larva21), and exhibited higher free fatty acids (FFA, 6.560.1 vs 2.260.1% of neutral lipids), lower proportions of triglycerides (TAG, 7161 vs 80 63% of neutral lipids) and lysophosphatidylecoline (LPC, 5.361.4 vs 10.361.1% of polar lipids); phosphatidylinositol (PI) was the only lipid class that was always higher in challenged larvae (17.660.8 vs 14.561.9% of polar lipids). Interestingly, the lower neutral lipid content in infected larvae coincided with the down-expression of Lipstor, a gene involved in lipid storage. Neutral lipids from challenged larvae after 48 h were characterized by a higher peroxidation index (N-PInd, 23064 vs 21762) and higher proportions of polyunsaturated fatty acids (N-SPUFA, 50.560.4 vs 48.160.2% of neutral lipids), free fatty acids (FFA, 6.560.1 vs 2.260.1% of neutral lipids), and 20:5(n-3) (N-EPA, 5.960.1 vs 4.860.3% of neutral lipids) compared to unexposed oysters. After 48 h of pathogen challenge, the polar fraction showed a lower peroxidation index (P-Pind, 29361 vs 333612); lower proportions of polyunsaturated fatty acids (P-SPUFA, 58.260.1 vs 63.861.5% of polar lipids), 20:4(n-6) (P-AA, 2.160.1 vs 3.960.1% of polar lipids), 22:6(n-3) (P-DHA, 20.060.1 vs 23.061.2% of polar lipids), and 22:5(n-6) (P-DPA, 2.260.1 vs 3.560.1% of polar lipids); and higher amounts of monounsaturated fatty acids (P-SMUFA, 24.360.2 vs 19.861.5% of polar lipids). Challenged larvae also showed a higher proportion of non-methylene–interrupted fatty acids in the polar lipids (P-SNMI, 11.660.2 vs 7.560.3% of polar lipids) than unchallenged oysters. These changes in fatty acid composition were reflected at the molecular level by the over-expression of genes associated with lipid metabolism in challenged larvae after 24 h for ACS and ECH, and after 48 h for PLA2, PLD1, AA15LX, ACDH, Delta5, and Delta6.
Pathogen challenge induced the activation of antioxidant defenses, as revealed by the higher transcript abundance of antioxidant enzymes measured after 24 h of exposure for GPX5 and after 48 h for GR-G, SOD-G, CAT-G, PRDX4, and PRDX5. This over-expression of catalase (CAT-G) and superox-ide dismutase (SOD-G) in challenged larvae was reflected at the physiological level by the higher activities of the corresponding enzymes (CAT-A, 12361 vs 9463 pmol larva21min21;SOD-A, 22126133 vs 11466378 pU larva21min21). We recorded higher gene expression of proteins associated with cellular stress (HSP70, PRN) simultaneous to the activation of antioxidant defenses. Finally, immune response activation was observed 24 h after bacterial stimulation by the over-expression of four genes related to the immune reaction (MYD88, cLEC, DRAC3, LBP/BPI) followed at 48 h by the activation of six others (Defh2, TIMP, TAL, TRAF, REL, AGL).
Discussion
Relevance of our bacterial challenge
To study the host response to a pathogenic bacterial challenge, a good balance must be reached between the absence of significant effects or, alternatively, massive mortality leading to rapid degradation of the studied host and bacterial proliferation on dead tissues. The timing of sampling and inoculation dose are key parameters allowing to document such responses. In our study, we
Figure 1. Mortality and clearance rate for Pacific oyster
Crassostrea gigaslarvae as a function of experiment duration and bacterial challenge. Larvae were challenged with Vibrio coralliilyticus for a period of 24 h or 48 h. Data from different treatments were pooled when this effect was not significant. Chal: challenged larvae; Unchal: unchallenged larvae. Data are means6SD of duplicate tanks. Different letters indicate significant differences.
recorded a limited but significant increase of mortality in larvae exposed to V. coralliilyticus. It indicated that the inoculation with 104bacteria per mL induced a significant impact on C. gigas larvae after 24 to 48 h, but did not lead to a septicaemia response or a massive mortality. The sequencing of RT PCR-DGGE bands revealed the presence of 16S cDNA from V. coralliilyticus in the larval culture water after 24 h of challenge, confirming that V. coralliilyticus was metabolically active at this time. After 48 h of challenge, its disappearance could be due to the detection limit of the PCR-DGGE technique. Flow cytometry analyses showed that the bacterial load slightly declined during the experiment, suggesting that no bacterial proliferation occurred after 48 h, and therefore that the concentration of active V. coralliilyticus dropped below the detection limit after 48 h. The reason for this declined bacterial load could be explained by an increase of bacterial mortality or a decrease of bacterial activity for V. Coralliilyticus, which could be associated with the agglutinating and clearance activity of larvae against pathogen as suggested by the activation of immune parameters described below. Finally, our analysis of the similarity index based on DGGE profiles demonstrated that regardless of the presence or absence of V. coralliilyticus, the composition of the remaining active bacteria surrounding the larvae and those associated with them was similar independently of pathogen stimulation.
Physiological response to bacterial infection
Immune response. Bivalve larvae lack specific immune responses and immunological memory. Therefore they rely totally on their innate immune system to overcome diseases [40]. The innate immune system of bivalves employs cellular and humoral components that operate in a coordinated way to provide protection from pathogens [1,2]. The first action of the oyster’s immune system when challenged by micro-organisms is the recognition of these foreign organisms. This is achieved by oyster immune receptors interacting with a highly conserved set of molecular structural motifs present on the surface of micro-organisms that are absent from host cells, allowing the discrim-ination between self and non-self. In our study, four genes were selected in relation with non-self-recognition (GAL8, cLEC, AGL,
LBP/BPI). While GAL8 remained unchanged during our bacterial challenge, cLEC and LBP/BPI were activated after 24 h and AGL after 48 h. The increased cLEC and AGL expressions observed in this study are related to genes coding for a c-type lectin 1 and for an a-agglutinin attachment subunit respectively. Agglutinins and lectins are glycoproteins specialized in the recognition of specific pathogen-associated carbohydrate structures and cause the agglutination of cells, opsonisation, the promotion of cellular adhesion, and the mediation of the innate immune response [41,42]. Lectin expression in adult oyster has been shown to increase after bacterial exposure [5,43]. Interest-ingly, Tirape et al. [7] observed that the expression of galectin 8 (GAL8), another lectin family, was not activated after bacterial challenge in juvenile C. gigas, in accordance with our results. Firstly indentified as a LPS binding proteins (LBP) coding gene [44], LPB/BPI has recently been associated to a bactericidal-perme-ability-increasing protein (BPI) [45]. BPI is specifically active against gram-negative bacteria (such as V. coralliilyticus); it increases the permeability of the bacterial membranes allowing the opsonisation of bacteria [45]. The activation of LBP/BPI by bacterial challenge at larval stage resembles what was already observed in adults [45,46]. Thus this protein may participate to the first line of defense early during the development as suggested by Tirape et al. [7].
Upon successful recognition of pathogenic micro-organisms, signaling cascades are triggered for the initiation of immune responses and for the transcription of inducible immune-related proteins. Over the past decade, the Rel and nuclear factor-kB (Rel/NF-kB) signal transduction pathway appeared to be a key component of the bivalve immune response inducing the transcription of numerous genes involved in immune function and inflammation in adult [3,5,47]. In our study, we observed a higher expression of three genes related to this signalling pathway (REL, MYD88 TRAF) in challenged larvae, reinforcing the hypothesis of the occurrence of this immune component at larval stage in C. gigas as suggested by Tirape et al. [7]. The over-expression of TIMP (Tissue Inhibitors of Metalloproteinase) in challenged larvae after 48 h could be related to activation of the Rel/NF-kB pathway. Indeed, as described in Montagnani et al.
Figure 2. DGGE gels performed with 16 s cDNA extracted from larvae (L) and surrounding water (W). Profiles were compared with (Chal) or without (Unchal) bacterial challenge and after 24 h and 48 h of experiment. The cDNA from reference sample (Ref), diet (D) and bacterial control (B) was used as ladder. Due to their high similarity, cDNA from duplicate samples were pooled. B1 and 2 correspond to the retrieved bands used to Vibrio coralliilyticus detection by sequencing analysis.
[48], the presence of three kB-motifs in the TIMP promoter suggests that TIMP gene expression might be controlled by the oyster’s Rel/NF-kB pathway. Its function in the immune response might be linked to its ability to inhibit protease and metallopro-teinase, two key components of bacterial infectivity [49]. It has been demonstrated that TIMP mRNA accumulation in haemo-cytes was induced following the injection of proteases produced by pathogenic Gram-negative bacteria [48] or after Vibrio splendidus infection [5]. These observations were in accordance with our results, where the stimulation by the Gram-negative V. coralliilyticus induced the over-expression of TIMP after 48 h of bacterial challenge. Although it has not yet been demonstrated in bivalves, the Rel/NF-kB pathway is also known to activate antimicrobial peptides synthesis in invertebrates, especially insects [50,51]. Antimicrobial peptides are amongst the most important effectors
of innate immunity and display a variety of action mechanisms, killing microbes by membrane disruption or by altering metabolic processes related to the synthesis of cell walls [52]. In our study, after 48 h of pathogen challenge, we observed an increase of Defh2 transcript level, a gene coding for an antimicrobial peptide family, the defensins. Defensins have been widely studied in bivalves, including adult Pacific oysters [53,54,55] and their activation after bacterial challenge has been well demonstrated [46,55]. The activation of defensin synthesis after a bacterial challenge in veliger larvae suggests that antimicrobial peptide defences prevail earlier in oyster development.
Accurate immune response involves haemocytes differentiation (hematopoiesis) allowing haemocytes proliferation around the infection site. In this study, the activation of haemocytes differentiation was revealed by increases in TAL and DRAC3
Figure 3. RDA ordination biplot representing the significant (p,0.05) challenge effect after 24 (Chal24) and 48 h (Chal48) as explanatory variables (arrows) on selected response variables (lines) related to energy metabolism (red), lipids (blue), cellular stress (green), and immunity (pink). Response variables related to larval performance and biochemical analysis were formatted in normal text, to enzymatic analysis in bold and to molecular analysis in italic. Black symbols: challenged larvae, white symbols: unchallenged larvae, squares: 24 h of exposure, circles: 48 h of exposure. Response variables abbreviations: -A, enzymatic activity; -G, gene expression; N-, neutral lipids; P-, polar lipids; S, sum of; cLEC, c-type lectin-1; AGL, a-agglutinin attachment subunit; LBP/BPI, LPS binding/bactericidal-permeability-increasing protein; MYD88, Myeloid differentiation primary response (88); TRAF, TNF receptor associated factor; REL, REL protein; DRAC3, drosophila rho GTPase 3; TAL, hematopoietic transcription factors; TIMP, tissue inhibitor metalloproteinase; Defh2, defensine 2; GR, glutathione reductase; SOD, superoxide dismutase; CAT, catalase; GPX5, glutathione peroxidase 5; PRDX4-5, peroxiredoxine 4 and 5; PRN, Pernin; HSP70, Heat shock protein 70; NADHOX, Mitochondrial nadh:ubiquinone oxidoreductase; CCOi, Cytochrome c oxidase subunit i; AS6, ATP synthase f0 subunit 6; PK, pyruvate kinase; CCO, cytochrome c oxidase; ADH, Acyl-CoA dehydrogenase; ECH, Enoyl-hydratase isomerase family protein; ACS, Acyl-CoA synthetase; Lipstor, Adipophilin; Delta5, Stearoyl-desaturase 5; Delta6, Fatty acid desaturase 2; PLA2, Phospholipase a2 receptor 1; PLD1, Phospholipase delta 1; AA15LX, Arachidonate 15-lipoxygenase; TOT, total lipids; PI, phosphatidylinositol; LPC, lysophosphatidylcholine; TAG, triacylglycerols; FFA, free fatty acids; AA, arachidonic acid; EPA, eicosapentaenoic acid; DPA, Docosapentaenoic acid; DHA, Docosahexaenoic acid; MUFA, monounsaturated fatty acids; PUFA, polyunsaturated fatty acids; NMI, non-methylene–interrupted fatty acids; Pind, peroxidation index; Protein, total proteins content; Feeding, feeding activity; Mortality, mortality rate.
Table 1. Details of genes and primers used in the quantitative real-time PCR relative expression analysis. Genes Label GENBANK Function Forward p rimer (5 9-3 9) Reverse primer (5 9-3 9) a-agglutinin attachment subunit AGL CU984122 Non-self recognition (lectin family) GCCTCCTTCTACAC CACAGCAT TGGTTTGCTTGGA TTTACAGACTTC Annexin 6 ANX6 CU989663 Apoptose, inflammation response GTGACGATGATGCGG ATGAG GATTTTTCGCCA GACGATTACAC c-type lectin-1 cLEC CU992287 Non-self recognition (lectin family) ACCTGGTCCGACGCAA GA GGGTGCTCAGA AACTTGTTGATG Cg-defensin 2 D efh2 A J565499 Antimicrobial peptide GTATTCGTACTTCT TACATTAGC GCTCTACAACCGAT GGACCT Cg-DRAC3 DRAC3 BQ427023 H aemocytes proliferation GATAATAGTGCGAC GGAGTG CATCAGCATAC AGGTCTTCC ECSIT E CSIT BQ427193 Immune response signalling (NF-KB) CCTCATCGGGAATCAC ACCATTA CGTGCGAGGGCA TATAGAG1TTG Galectin 8 G al8 BQ427054 Non-self recognition (lectin family) TGGAAGTTGAATC TGGTCTGG TGCTGTTAAGA ACCATCTCACG Cg-LBI/BPI (LPS b inding/bactericidal-per meability-increasing protein) LBP/BPI AY165040 Non-self recognition (LPS b inding protein) TGTCCTTGGCGACG GTCAGTTGTG GTCCTCAAATTAC CTATATCAGTAAC Mitogen activated protein kinase kinase 1 MAPK CU996721 Immune response signaling AAACTGGCAAACCC CTGAAA CCAGGCGGAC CAGGAAA Cg-MyD88 (Myeloid differentiation p rimary response (88)) MYD88 DQ530619 Immune response signaling (NF-KB) AGGTACCGGCTGTGAT ACGA TTCAAACGCCA CC AAGACTG Cg-REL R EL AY039648 Immune response signaling (NF-KB) GCTACGAGTGTGAGG GGAGATCA GGGAAACTGAT GACGTTGGTGTC Cg-TAL (hematopoietic transcription factors) TAL A Y039650 Haemocyte proliferation CGTGTTGTGTCCGAGTGT ATGTAA GCTGTCGTCGCA TTCTTTCA Cg-TIMP (tissue inhibitor m etalloprotein ase) TIMP A F321279 M etalloproteinas e inhibitor CAGGGTCTTACAACA CGAACGA GCTGGTTTGG TTCACGGTAGA cg-TRAF (TNF receptor associated factor) TRAF BQ426746 Immune response signaling (NF-KB) CAGCCAGCCATTT T ACACCAGTC CCGTTTAAAACTGCT GCTTGTGG Arachidonate 15-lipoxygenase AA15LX CU998478 Eicosanoide synthesis CTCACTGCCCGCTTTCC A GAGCGAGGAAG CGGAAGAG Acyl-CoA synthetase ACS CU992135 Fatty acid oxidation TACTGTCTTCTGCTAAA CGCCAC GATCATGTTTGTT CGGTCATC Acyl-CoA dehydrogenase ADH FP001142 Fatty acid oxidation CCGCTCACAATTCCACAC AA GCACCCCAGGCTTT ACACTTT Stearoyl-desaturas e 5 Delta 5 CU997931 Fatty acid desaturation GGAGGACTCTGAG CCCGAAT GGCGAGGTGAAGG GAAGAC Fatty acid desaturase 2 D elta 6 CU994528 Fatty acid desaturation GAACTTTCGCCATTT TCAGCAT GGCTATATCGAC ATCAGGGTCTTT Delta 9 d esaturase Delta 9 CX069227 Fatty acid desaturation TACTGTCTTCTGCTAAA CGCCAC GTCGTGATATTGA GGTGCCAGCC Enoyl-hydratase isomerase family protein E CH CU989620 Fatty acid oxidation GCAAATTTTACAGCA ATGGCATAG GCCTCCAGAAC AACTCAACCA Enolase Enolase CU986328 E nergy m etabolism (glycolysis) CCAGCCCTTCAGTC AGATGTG GCCCCATCTCCT CCTAACG Adipolipin Lipstor CU996665 Fatty acid strorage AGAAGACCAAGGAAA GCAACCA TGATGCTGGATTCGG CTAGA Phosphatidylcholi n e transferase Pctrans CU997534 Lipids class remodelling CCTCACCACAGACGGCA AA ACACCAGTCTTAG CACCCCAGTT Phospholipase a2 receptor 1 PLA2 CU994900 Eicosanoides synthesis CAATAACTTCAATTCT CCGACCAA TTCGCAGTGTT TGATTTTCCATA Phospholipase delta 1 P LD1 CU993057 Lipids class remodelling GCCATCATCCGAT TCGTTGT CCCTCTTGGATTGAA TGGAATG Phosphatidylserine d ecarboxylase Psdec CU990331 Lipids class remodelling GGACTCTACGTCTGGAT GTTCGA ATACCGTCTGTCA CTTCACCAAAAT ATP synthase f0 subunit 6 AS6 EE677700 E nergy m etabolism (electron chain transport) ATGCCAAGCATGTTC TACAGAGT GCAAAGGAT CGCTCCTACCAAAGC Cytochrome c oxidase subunit i CCOi FP001743 E nergy m etabolism (electron chain transport) TTCCAGTCTCAACGG TCCTTTC GCGTAAGCCA GGTTGGTTTCTAT Citrate synthase CS-G CG1753 Energy m etabolism (acid citric cycle) CCGCGCCGGGACCTCCG TCGGTGTTGTAG TTCGTCGGACACA GAGTCTCCCAATTCTC Glutamine Synthetase GS CG1753 Amino acid synthesis ACGGAGGTTGACG GGACTT GCTGGCACCAC GATTGG Mitochondrial nadh:ubiquinone oxidoreductase NADHox CU999020 E nergy m etabolism (electron chain transport) GATGGCAGAAAAGGAT AGAATGGT TCATCAG GTCCTC CTCCAACTC Catalase CAT-G CU996492 Antioxidant d efenses GGAGGTGCCCCGAA CTATTT T CTTCATCCGC CGAGTTGTAG Superoxide d ismutase extracellular ecSOD CU999489 Antioxidant d efenses AGAGAATCCTGAGCTAC AGC TGAGCAAAAC TCTCTACAAGC Glutathione peroxidase 3 GPX3 CU994955 Antioxidant d efenses CCGTTGCTCCCTCGCT TT AAGATGGCGGCTG ATTGC
transcript levels after bacterial challenge. Tirape et al.[7] used these two genes to demonstrate that hematopoiesis is present earlier during larval development in C. gigas. In the same study, an increase of Cg-tal and DRAC3 after bacterial challenge was already observed corroborating our results.
Oxidative stress. The final elimination of infecting bacteria is presumed to be carried out in phagolysosome involving various cytotoxic reactions, such as the release of lysosomal enzymes and the production of reactive oxygen species (ROS). The generation of these various free radicals during intracellular destruction of phagocytized bacterial material induces the activation of antiox-idant defenses to avoid the peroxidation of host tissues. In our results, challenged larvae showed higher activities of catalase (CAT-A) and superoxide dismutase (SOD-A), two key enzymes implicated in antioxidant defenses, indicating their activation after pathogen stimulation. This activation was also reflected at the molecular level by the over-expression in infected larvae of the antioxidant related genes GPX5, GR-G, CAT-G, SOD-G, PRDX-4, and PRDX-5 related to glutathione peroxidase (family 5), glutathione reductase, catalase, superoxide dismutase, and peroxiredoxin (family 4 and 5), respectively. These results coincided with previous work in American oyster larvae [11] and adult pacific oysters [56] in which higher expression levels of antioxidant enzymes were observed during pathogenic conditions. Interestingly, in our study, no increase in lipid peroxidation was observed in infected larvae suggesting that they developed accurate antioxidant defences activation to avoid tissue peroxida-tion.
Besides antioxidant defences, larvae possess various cytoprotec-tive processes to avoid cell degradation by ROS. The expression of two genes related to these processes (HSP70 and PRN) were up-regulated after 48 h of bacterial challenge. Heat shock proteins (HSP) are stress-response proteins implicated in cytoprotection that act as molecular chaperones, binding to damaged or misfolded polypeptides, either facilitating their repair or targeting irreparably damaged proteins for degradation [57]. Increases of HSP expression have been observed after vibrio infection in adult pacific oysters [3,5]. In C. virginica, the expression of HSP70 has been shown to increase in haemocytes with increasing intensities of Perkinsus infection [58] and after massive mortality events of larval stages [11]. Pernin (PRN) also called cavortin, is a glycosylated protein known to participate in the binding of divalent metal cations, suggesting that PRN functions as a metal chelator or a chaperone. In addition, PRN acts as a serine protease inhibitor and has a sequence clearly homologous to the active-site domain of Cu–Zn SODs (superoxide dismutases) [59]. Tanguy et al. [60] identified a gene coding for a PRN among C. virginica haemocytes and observed an increase of mRNA expression after 45 days of P. marinus exposure. Moreover, Huvet et al.[61] suggested that PRN protects cell hosts against the reactive oxygen intermediate (ROI) in C. gigas inoculated with Vibrio splendidus. The over-expression of HSP70 and PRN in challenged larvae indicates that these proteins could play similar functions in cytoprotection and immunity, as it has been suggested in C. virginica larvae [11].
Energetic metabolism.. To sustain immune, antioxidant and cytoprotection processes, larvae needed to allocate a part of their energy retrieved from feeding and/or energetic reserves. That is why we investigated the impact of bacterial infection on the components of energetic metabolism. The first evidence of this impact is the decline of feeding activity in challenged larvae after 48 h of exposure, as already observed during disease events in American oyster larvae [15]. This decline in food intake seemed to affect the ATP production, as illustrated by the lower activity of pyruvate kinase (PK-A) and cytochrome c oxidase (CCO-A), two
Table 1. Cont. Genes Label GENBANK Function Forward p rimer (5 9-3 9) Reverse primer (5 9-3 9) Glutathione peroxidase 5 GPX5 CU988021 Antioxidant d efenses CGTTCGGCCCGGTAGTG GCCGTTGACATCGCCTATTC Glutathione reductase GR-G FP000015 Antioxidant d efenses GCCACCAAGGCCCAGTT AGATTTTCGGCGGAGTG TCA Heat Shock p rotein 70 HSP70 CX069205 C ytoprotection (chaperon p rotein) ATGAGTAAACACCAACAGGC CATCGG AAGATAGTGTTCGTAGG GTTCATGGC Metallothionein MT CU998632 Cytoprotection GAGGAGAAACATCAAGACT AAGAAAACA ACACGAATCAGAGCAGAC ACATG Peroxiredoxin 4 PRDX4 FP005664 Antioxidant d efenses CAGGGCTGCTGATGATGACA GGTGCAGGCTTGGAAATGA Peroxiredoxin 5 PRDX5 CU986700 Antioxidant d efenses GCTGTGGATTTGTTTGAGAAG GAT TGAGCAACCAGGAGTG AAAGC Peroxiredoxin 6 PRDX6 CU984218 Antioxidant d efenses ACTCCCATACCCCATCATTTCC GGATCAACCATGCCCAGT TT Pernin PRN CD526735 Cytoprotection (metals chelator) CTCCTGATCATGCTGAACCT GCTGGCACCACGATTGG GATCATGTTTGTTCGGT CATC Superoxide d ismutase SOD-G F P005332 Antioxidant d efenses GAAGACGGTGTCGCCAAAA GGCCGGCCAAGTCGAT doi:10.1371/journal.pone.0064 534.t001
enzymes involved in glycolysis and the respiratory chain complex respectively. In addition to these enzymes, this metabolic depression was also reflected at the molecular level as demon-strated by the lower gene expressions of cytochrome c subunit i (CCOi, respiratory chain complex IV), NADH ubiquinone:ox-idoreductase (NADHox, respiratory chain complex I), and ATP synthase subunit 6 (AS6, respiratory chain complex V) in infected larvae. The metabolic depression associated to feeding declines was demonstrated in Manila clams juveniles (Ruditapes philippi-narum) infected by brown ring disease [62] and in C. virginica larvae submitted to a massive mortality event [15]. The decline of food intake coincided with lower triglyceride (TAG) and protein content, the two main energetic reserves in bivalve larvae. The higher concentrations of free fatty acids (FFA) in challenged larvae after 48 h may be related to TAG catabolism. Indeed, FFA usually results from TAG degradation by lipase [63,64]._ENREF_81 TAG catabolism in challenged larvae could also be induced by the over-expression of acyl-CoA synthetase (ACS), acyl-CoA dehydroge-nase (ACDH), and enoyl-CoA hydratase (ECH), three key enzymes of b-oxidation. The fatty acids stored in TAG are broken down sequentially through b-oxidation to yield acetyl-CoA, which can then be introduced into the Krebs cycle to produce energy [65,66]. The b-oxidation has been little studied in marine invertebrates [67] and to our knowledge our study is the first to hypothesize the activation of this metabolic pathway in challenged bivalve larvae. Beside the b-oxidation activation, the lower ability for challenged larvae to accumulate lipids was observed with the down-expression of adipophilin (Lipstor), a protein involved in lipid droplet formation and triglyceride accumulation [68]. The decline of food intake and the utilization of energetic substrates could provoke a weakening of larvae if the infection last longer. It could in turn limit the energy availability for larval development and/or the activation of accurate immune, antioxidant and cytoprotection processes as suggested in American oyster larvae incurring massive mortality [11,15]. In this context, converting energetic substrates after 48 h of experiment to energy equivalents with values of 24.0, 39.5 and 17.5 kJ g21 for protein, lipid and carbohydrate respectively [69] yields a total energy content of 1442614mJ larva21 for challenged larvae and 1679688mJ larva21for unchallenged ones. These results confirm that energy availability for metabolic requirements and development was lower in challenged larvae.
Structural lipids remodeling. The bacterial infection seemed to affect also structural lipid composition that contained
higher PI and lower LPC in challenged larvae than control larvae. These changes could be linked to the utilization of derivates in immune response signalling. Indeed, it has been shown that phosphatidylinositol 3,4,5-triphosphate (PI3) generated by phos-phatidylinositol-3 kinase (PI3K) is a crucial signal transducing element that regulates communication across the plasma mem-brane, especially during the immune response [70,71]. Although this pathway was suggested to hold an important role in the immune response of molluscs [72], the effect on PI content has never been demonstrated and would necessitate further investiga-tion.
Many studies in vertebrates have revealed that LPC could play an important part in immune response transduction. Indeed, LPC activates several second messengers in vertebrates, including extracellular signal-regulated kinases, mitogen-activated protein kinase (MAPK), phosphoinositide-3-kinase, Ca2+, adenylate cy-clase (AC), Rho protein, and platelet-activating factor (PAF), all of which are known to regulate the inflammatory response [73,74,75]. However, the occurrence of these immune signalling processes remains largely unknown in marine invertebrates and needs further investigation.
Concerning fatty acids, changes in polar lipid composition were observed in challenged larvae. Unlike unchallenged larvae, challenged larvae did not accumulate major C20 PUFA (DHA,
DPA, AA) after 48 h, as it is usually observed during development of bivalve larvae [23,76]. Moreover, the level of the naturally biosynthesized NMI fatty acid (essentially 22:2 NMI) was always higher in challenged larvae. All of these elements seem to indicate that challenged larvae, probably because their lower feeding activity, were unable to extract sufficient essential fatty acids from their diet and compensated for this lack in major PUFA by accumulating NMI fatty acids. Indeed, an increase in 22:2 NMI may compensate for the decrease in other long-chain PUFA such as DHA [77]. Moreover, a higher NMI content in cell membranes could balance the decrease in the peroxidation index attributed to oxidative stress that may occur during infection as suggested under pathological condition in adult C. gigas by Pernet et al. [29]. This hypothesis is supported by the fact that NMI fatty acids are more resistant to oxidation than other PUFA [78]. It was also suggested that since NMI fatty acids are usually present in the outer membrane of mollusks, they may increase resistance to attack by microbial lipases [79].
Fatty acid remodeling after pathogen stimulation was also suggested by the activation of two genes coding for fatty acid 5 and Table 2. Summary of means (6 STD) and statistics for parameters related to energetic metabolism.
Mean±STD Multiple comparisons Analyses RV Unity 24 h Chal 24 h Unchal 48 h Chal 48 h Unchal
24 h Chal 24 h Unchal 48 h Chal 48 h Unchal Gene expression AS6 Relative expression 0.8660.09 0.6760.32 1.2660.73 9.6062.92 b b b a
CCOi Relative expression 0.8360.1 0.6160.12 0.7660.21 2.7260.09 b b b a NADHox Relative expression 1.1060.19 0.6360.3 0.8960.03 2.2760.67 b b b a Enzymatic activity CCO-A pmol larve2min21 0.4560.05 0.4960.04 0.4760.03 0.6260.02 b b b a
PK-A pmol larve21
min21
5.1360.62 3.2260.06 6.0560.41 8.6960.32 b c b a Biochemical content Protein ng protein larva21
40.961.57 37.8660.33 38.0160.21 43.4362.49 ab b b a Multiple comparisons show the significant differences (letters) between each combination of treatments. Abbreviations: RV, response variable name in RDA biplot, 24 and 48 h chal, larvae challenged during 24 or 48 h; 24 and 48 h unchal, unchallenged larvae after 24 and 48 h. Response variables abbreviations: NADHOX, Mitochondrial nadh:ubiquinone oxidoreductase; CCOi, Cytochrome c oxidase subunit i; AS6, ATP synthase f0 subunit 6; PK-A, pyruvate kinase activity; CCO-A, cytochrome c oxidase activity; Protein, total proteins content.
6 desaturases. The physiological role of delta 5 desaturase in marine invertebrates has not been extensively studied so far. Nevertheless, previous studies demonstrated that delta 5 desatur-ase plays an important role in the biosynthesis of NMI fatty acids [77,80]. Moreover, the delta 5 and delta 6 desaturases govern the rate-limiting steps in the biosynthesis of long-chain PUFAs. Although it is well demonstrated in fish species [81,82], the ability to synthesize long chain PUFAs de novo has not been clearly demonstrated in bivalves [77] and needs further investigation.
The activation of desaturases coincided with the over-expression of three other genes involved in lipid metabolism, AA15LX, PLA2, and PLD1. Phospholipase A2 (PLA2) is implicated in diverse cellular processes, but perhaps the most notable function of PLA2 is its ability to initiate the inflammatory response through
eicosanoids synthesis. Following its production by PLA2, AA (or EPA) is metabolized through the cyclooxygenase (COX) and lipoxygenase (LX) pathways to yield prostaglandins and leukotri-enes respectively [83]. AA15 lypoxygenase (AA15LX) was directly involved in the leukotrien transformation of AA to 15(S)-hydroxyeicosatetraenoic acid (15-HETE) [84,85]. Interestingly, the activation of PLA2 and AA15LX could explain the AA decline in polar lipids of infected larvae after 48 h. The activation of the eicosanoids pathway through phospholipase and lipoxigenase activation during immune response was well demonstrated in insects [22,86], and few references concerning eicosanoids production in C. gigas exist [87,88]. Although it has not been formally demonstrated in bivalves, the Rel/NF-kB pathway is known to activate phospholipase A2 in invertebrates, especially Table 3. Summary of means (6 STD) and statistics for parameters related to lipids.
Mean±STD Multiple comparisons
Analyses RV Unity 24 h Chal 24 h Unchal 48 h Chal 48 h Unchal 24 h Chal 24 h Unchal 48 h Chal 48 h Unchal Biochemical
content N-Tot ng lipids larva
21 4.7161.1 4.3560.89 2.0960.13 4.7060.23 a a b a FFA mass % 2.5360.02 3.0760.15 6.5160.08 2.1660.03 c b a d TAG mass % 79.5961.69 78.4762.49 71.2860.94 80.3963.12 a a b a N-EPA mass % 4.7260.31 4.9060.01 5.8960.05 4.8360.25 b b a b N-SPUFA mass % 49.7761.12 50.7260.39 50.5060.39 48.1360.17 ab a a b N-Pind - 21966 22563 23064 21762 ab a a b LPC mass % 4.0460.98 6.760.23 5.3161.44 10.2661.12 b b b a PI mass % 18.1460.84 15.0662.02 17.0360.87 13.8461.98 a ab a b P-AA mass % 2.4360.09 2.3360.01 2.1260.09 3.8660.12 b b b a P-DPA mass % 2.5460.17 2.8660.06 2.1860.07 3.5360.05 c b d a P-DHA mass % 19.6460.69 19.6560.01 19.9560.01 22.9761.15 b b b a P-SNMI mass % 10.9160.09 8.1460.51 11.6260.22 7.5360.25 a b a b P-SMUFA mass % 21.7560.30 24.4161.03 24.2860.24 19.7961.53 b a ab b P-SPUFA mass % 58.8160.67 58.4060.84 58.2260.07 63.8461.45 b b b a P-Pind - 29267 30166 29361 333612 b b b a Gene expression AA15LX Relative expression 2.1960.57 1.3760.35 8.7663.08 1.6960.47 b b a b ADH Relative expression 2.9460.20 1.9960.97 5.9061.93 1.9660.28 b b a b Delta5 Relative expression 0.5860.14 0.4060.36 1.6460.2 0.4760.19 b b a b Delta6 Relative expression 0.5460.01 0.1560.06 2.6760.85 0.2760.01 b b a b ECH Relative expression 2.8961.38 0.5560.22 4.0960.38 0.6760.39 a b a b Lipstor Relative expression 0.4760.43 0.2360.12 1.5860.10 1.4360.06 b b a a PLA2 Relative expression 0.5160.46 0.1660.09 2.1760.59 0.0960.04 b b a b PLD1 Relative expression 1.5660.92 1.560.24 5.460.5 1.9660.67 b b a b Multiple comparisons show the significant differences (letters) between each combination of treatments. Abbreviations: RV, response variable coding in RDA biplot, 24 and 48 h chal, larvae challenged during 24 or 48 h; 24 and 48 h unchal, unchallenged larvae after 24 and 48 h. Response variables abbreviations: N-, neutral lipids; P-, polar lipids; S, sum of; TOT, total lipids; PI, phosphatidylinositol; LPC, lysophosphatidylcholine; TAG, triacylglycerols; FFA, free fatty acids; AA, arachidonic acid; EPA, eicosapentaenoic acid; DPA, Docosapentaenoic acid; DHA, Docosahexaenoic acid; MUFA, monounsaturated fatty acids; PUFA, polyunsaturated fatty acids; NMI, non-methylene–interrupted fatty acids; Pind, peroxidation index; ADH, Acyl-CoA dehydrogenase; ECH, Enoyl-hydratase isomerase family protein; ACS, Acyl-CoA synthetase; Lipstor, Adipophilin; Delta5, Stearoyl-desaturase 5; Delta6, Fatty acid desaturase 2; PLA2, Phospholipase a2 receptor 1; PLD1, Phospholipase delta 1; AA15LX, Arachidonate 15-lipoxygenase.
insects [89,90] as well as the AA15 lipoxigenase in vertebrate [91]. Our results for genes associated with PLA2, AA15LX, and Rel/ NF-kB suggest that this situation could prevail in C. gigas larvae after pathogen exposure. This hypothesis, however, needs further support. Phospholipase D1 (PLD1) is implicated in several important cellular functions and is believed to have a signalling role in lysophosphatidic acid (LPA) immune pathway [92,93]. Indeed, LPA may be synthesized from LPC produced by the PLA2 transformation of phosphatidylcholine (PC), or by the PLA2-catalyzed deacylation of phosphatidic acid (PA) generated by PLD1 [75]. Considering the lower LPC content and the activation of PLA2 and PLD1 in challenged larvae, we can hypothesize an activation of LPA pathway components after pathogen stimulation but here again the hypothesis requires additional experiments for validation.
Time-response of oyster larvae to bacterial infection. Finally, one of the most interesting aspects of this study is the possibility to compare physiological response at two times on a short term period (24 and 48 h). Although six genes related to immunity (LPB/BPI, DRAC3, MYD88 and cLEC), antioxidant defense (GPX5) and cytoprotection (PRN) were up-regulated after 24 h, a large part of the significant differences related to these processes was measured after 48 h of challenge. These results contrast with those found in adult oysters by De Decker and Saulnier [94] i.e. an up-expression of immune genes 2 h after vibrio injection. We think that this difference in
time-response could be due to the bacterial challenge protocol (balneation vs intramuscular injection) and the pathogen concen-tration (104 vs 108 cells mL21). However, the lack of sampling before 24 h of challenge implies that we didn’t exclude the activation of immune parameters early during infection.
The activation of b-oxidation preceded the feeding decline, the consumption of energetic substrates and the metabolic depression It suggests that there is an increase of energy demand before 48 h probably to sustain the immune response initiation. However, no delay was observable between changes in metabolic enzymes activities and the regulation of related genes. Similar observations were made between the activity of antioxidant enzymes and the expression of associated genes. Concerning structural lipids, the activation of desaturases, phospholipases and lipoxigenase coin-cided with fatty acid remodelling in polar lipids. These elements illustrated that larvae responded quickly by deep changes at biochemical and physiological levels.
Conclusion
The main interest and novelty of our study is that we characterized the response of oyster larvae to pathogen infection using a multidisciplinary approach. For the first time, the impact of a bacterial challenge on larval physiology was characterized in a bivalve mollusk at the physiological, enzymatic, biochemical and transcriptional levels. This study has shown the activation of Table 4. Summary of means (6 STD) and statistics for parameters related to immunity and oxidative stress.
Mean±STD Multiple comparisons Analyses RV Unity 24 h Chal 24 h Unchal 48 h Chal 48 h Unchal
24 h Chal 24 h Unchal 48 h Chal 48 h Unchal Gene expression AGL Relative expression 0.7760.19 0.3360.35 4.2560.69 0.2960.27 b b a b
CAT-G Relative expression 3.0460.40 0.6560.07 7.4560.70 1.7261.06 b b a b cLEC Relative expression 3.4460.52 0,0160,01 0.0960.03 0.0160,01 a b b b Defh2 Relative expression 0.6060.26 0.1460.04 1.8160.49 0.3060.03 b b a b DRAC3 Relative expression 1.1760.42 2.7360.47 1.1060.03 0.5960.2 b a b b GPX5 Relative expression 1.5960.08 0.8360.53 2.760.21 1.7460.07 b b a b GR-G Relative expression 0.5760.24 0.1360.02 2.1960.66 0.1560.17 b b a b HSP70 Relative expression 1.2460.95 1.0260.46 5.7961.50 0.8360.06 b b a b LBP/BPI Relative expression 8.2862.34 1.5060.34 8.8664.31 2.1460.9 a b a ab MYD88 Relative expression 11.3361.09 1.5861.39 2.0160.17 0.4660.39 a b b b PRDX4 Relative expression 0.4560.3 0.3660.26 2.7960.14 1.5960.25 c c a b PRDX5 Relative expression 0.7960.06 0.8660.89 2.6160.19 0.8260.10 b b a b PRN Relative expression 0.6560.1 0.0960.04 1.6460.30 0.6760.21 b c a b REL Relative expression 0.9660.59 0.6360.21 3.6160.61 1.8160.31 b b a b SOD-G Relative expression 0.6460.52 0.1960.13 4.1860.86 0.4760.38 b b a b TAL Relative expression 0.3760.28 0.1860.05 1.8160.73 0.3760.06 b b a b TIMP Relative expression 1.5560.39 0.3560.11 6.0361.58 1.6860.71 b b a b TRAF Relative expression 0.4560.05 0.5260.09 3.5260.59 0.9560.85 b b a b Enzymatic activity CAT-A pmol larve21
min21
102.5165.19 86.8665.89 123.2860.55 93.7263.15 b b a b SOD-A pU larve21
min21
19476328 1549621 22126133 11466378 a ab a b Multiple comparisons show the significant differences (letters) between each combination of treatments. Abbreviations: RV, response variable coding in RDA biplot, 24 and 48 h chal, larvae challenged during 24 or 48 h; 24 and 48 h unchal, unchallenged larvae after 24 and 48 h. Response variables abbreviations: A, enzymatic activity; -G, gene expression cLEC, c-type lectin-1; AGL, a-agglutinin attachment subunit; LBP/BPI, LPS binding/bactericidal-permeability-increasing protein; MYD88, Myeloid differentiation primary response (88); TRAF, TNF receptor associated factor; REL, REL protein; DRAC3, drosophila rho GTPase 3; TAL, hematopoietic transcription factors; TIMP, tissue inhibitor metalloproteinase; Defh2, defensine 2; GR, glutathione reductase; SOD, superoxide dismutase; CAT, catalase; GPX5, glutathione peroxidase 5; PRDX4-5, peroxiredoxine 4 and 5; PRN, Pernin; HSP70, Heat shock protein 70.
several physiological processes which co-occurred after bacterial infection in oyster larvae. Indeed, we have observed that V. coralliilyticus exposure coincided with changes in energy status of larvae, fatty acid remodeling and the activation of antioxidant defenses and immune response. Taken together, all of these results can be gathered in a schematic diagram (Figure 4) which illustrates putative relationships between these physiological processes. This overall view open the way to further studies that will improve our knowledge about the impact of bacterial infection on larval physiology for marine invertebrates and could be extended to other species with other pathogens and at different larval stages. However, although this study allowed to have an overall view of physiological changes associated to bacterial infection, several results requires additional experiments for validation. Specifically,
the activation of immune response could be completed by proteomic or other physiological approaches in order to affine knowledge about regulation pathways, especially to highlight the target (including eicosanoids) of the Rel/NF-kB pathway. In the same idea, it could be interesting to develop Dynamic energy budget (DEB) model to investigate precisely the impact of infection on energy metabolism of larvae. Finally, the relatively low mortality rate observed in our experimental challenge was associated with the activation of immune response, antioxidant defenses and cytoprotection processes, suggesting that larvae developed an effective defense strategy to struggle the bacterial infection. Our results contrast with those reported on C. virginica larvae during massive mortality event by Genard et al. [11,15], suggesting that physiological changes depend on the infection
Figure 4. Schematic diagrams of physiological changes induced during bacterial infection inC. gigaslarvae. Infection impact on larval physiology was investigated through immunity (1), cellular stress (2), energetic metabolism (3) and lipid metabolism (4) using physiological, enzymatic, biochemical and molecular analysis. Results suggest that bacterial infection induce the activation of the immune response (non-self recognition (1a), NF-kB signaling pathway (1b), haematopoiesis (1d), synthesis of inhibitor of metalloproteinase, antimicrobial peptide (1c) and phagocytosis (1e) allowing the destruction of pathogenic bacteria. The production of reactive oxygen species (ROS) during the phagocytosis process was managed by antioxidant defenses (2a) and cytoprotective proteins (2b). Infection affects the feeding activity (3a) which change the energy status of larvae (decline of metabolic rate (3b), energy reserve consumption (3c), b-oxidation activation (3d) and lower lipids storage (3e)). Besides metabolic changes, fatty acid remodeling in polar lipids (4a) is associated to pathogen exposure, as suggested by changes in phosphatidylinositol and lysophosphatidylcholine composition, non-methylene–interrupted fatty acids accumulation, lower content of major C20polyunsaturated fatty acids
and activation of desaturases. Finally, infection induces the activation of phospholipase and lipoxygenase (4b) probably through NF-kB regulation (4c) to initiate eicosanoı¨des and lysophosphatidic acid (LPA) pathways. See discussion for details.