Active hypothermic growth: a novel means for increasing
total recombinant protein production by CHO cells
by
Stephen Richard Fox
M.S.C.E.P., Massachusetts Institute of Technology, Cambridge, MA, 2003 B.S. Chemical Engineering, Carnegie Mellon University, Pittsburgh, PA, 1998
SUBMITTED TO THE DEPARTMENT OF CHEMICAL ENGINEERING IN PARTIAL FULFILLMENT OF THE REQUIREMENTS FOR THE DEGREE OF
DOCTOR OF PHILOSOPHY IN CHEMICAL ENGINEERING PRACTICE at the
MASSACHUSETTS INSTITUTE OF TECHNOLOGY APRIL 2005
C 2005 Massachusetts Institute of Technology. All Rights Reserved.
MASSACHUSETTS INSTlJlTE OF TECHNOLOGY JUN 01 2005
LIBRARIES
Author:
-Department of Chemical Engineering April 2005 Certified by: Daniel I. C. Wang Institute Professor Thesis Supervisor Accepted by: ( Daniel Blankschtein Professor ot Chemical Engineering hairman, Committee for Graduate Students ARCHIVES
Active hypothermic growth: a novel means for increasing total recombinant
protein production by CHO cells
by
Stephen Richard Fox
Submitted to the Department of Chemical Engineering on August 4, 2003 In partial Fulfillment of the Requirements for the Degree of
Doctor of Philosophy in Chemical Engineering Practice
ABSTRACT
Recombinant human glycoproteins produced by Chinese Hamster Ovary (CHO) cells are an important class of therapeutic molecules and investigating means of improving the production rate and product quality of these glycoproteins is therefore of great interest. Culturing CHO cells under mild hypothermia (30-33 °C) leads to growth arrest in the Go/GI phase of the cell cycle and, in some cases, causes an increase in specific productivity of recombinant protein, as was shown here for the model CHO cell line producing human interferon-gamma (IFN-y).
Controlled proliferation, achieved by inducing growth arrest in the Go/GI phase by chemical, environmental or genetic means, is commonly used to increase CHO specific productivity and thus there is speculation that enhanced hypothermic productivity is due to growth arrest. However, it was proven here that the positive effect of hypothermia on recombinant protein production is due to elevated IFN-y mRNA levels instead. At both 32 °C and 37 °C, specific productivity is growth-associated, increasing as the percentage of cells in the S phase increased, demonstrating that a cell line can be both a growth-associated producer and have enhanced productivity under hypothermic conditions.
It was hypothesized that the best production platform would be cells actively growing at low temperature and this was proven to be the case using two different methods, namely growth factor supplementation and selection of cells capable of hypothermic growth. Both methods gave multi-fold increases in total IFN-y production compared to the 32 °C and 37 °C controls, thereby validating the novel culture strategy of active hypothermic growth. Cells capable of achieving significant hypothermic growth were also isolated for the non-recombinant CHO-KI cell line and are now available for the future production of any recombinant protein.
Glycoprotein quality is partially assessed by the level of glycosylation and IFN-y contains two potential N-linked glycosylation sites. This thesis gives the first report of a detrimental effect of hypothermic culture on glycosylation, showing a 4-5% decrease in the end-of-batch percentage of 2-sites occupied glycoforms relative to the 37 °C control. However, this negative effect is completely eliminated by culturing under perfusion conditions.
Thesis Supervisor: Daniel I. C. Wang Title: Institute Professor
ACKNOWLEDGEMENTS
This thesis would not have been possible without significant help from many people all over the globe. Short of deleting Chapter 7, there is no way I could personally list everyone who has helped me along the way but I would like to take this moment to thank you all and also acknowledge some people who made a particularly special impact on me during my thesis. I have had the opportunity to be part of the pioneering group of PhDCEPs and three years on, I am still happy I signed on for it, although perhaps a little more tired than when I started. So, I would like to begin by thanking Dr Robert Cohen for the effort he has put forth in getting the program going and keeping it running smoothly. Your enthusiasm for the program is apparent and appreciated. Also, to the other first-year CEP students, Catherina, Manish, Prem, Reuben and Vipin, I think in many ways we will be judged as a group so thanks for all your effort in making the program a success. Prem, I am particularly glad we did not let you perish on Mount Fuji.
Deep thanks also go to the members of my thesis committee, Dr Charlie Cooney, Dr Doug Lauffenburger and Dr Dane Wittrup. Your advice was greatly appreciated, as was the added time commitment on your parts to attend the extra committee meetings that are a pillar of the PhDCEP program.
I have had a very rewarding experience working with my advisor, Dr Daniel Wang. I really appreciated the intellectual freedom you gave and encouraged of me and the tough questions you asked that made me a better student. Your words of support and advice during some difficult periods were also greatly appreciated. Finally, the opportunity to study overseas has been an excellent experience and I thank you for giving me the chance.
I acknowledge significant financial support from two outside sources, the National Science Foundation in the form of a Graduate Fellowship and the Singapore-MIT Alliance (SMA) program's generous research grant to Dr Wang that made my research possible.
All of my research was conducted at the Bioprocessing Technology Centre (BTC) in Singapore. I would like to express sincere appreciation to Professor Miranda Yap, Director of BTC, for her intellectual, physical facilities and materials support that made this thesis possible and also for her kindness and generosity towards me. You made me feel a very welcome member of BTC and I am deeply appreciative of all you have done for me.
The staff at BTC has been a pleasure to work with too and I would like to thank you all. You made my stay in Singapore a very pleasant one indeed. The only grudge I hold is towards Chunshui for letting me eat pigs' ears when I thought they were red peppers, particularly since that day I wanted something vegetarian. However, you made amends by sharing Tiger beer with me. While on the subject of cuisine, thanks to Yang for introducing me to roti prata on my very first day in Singapore, which would go on to replace Wheaties as my breakfast staple. I did a quick "back-of-the-envelope" calculation and estimate I have consumed about 2,000 prata, all thanks to you.
Special thanks to Dr Kathy Wong and the rest of the cell culture group for teaching me the basics of animal cell culture, giving me free run of the -80 °C freezer and bioreactors, and being far more patient and kind to me than I deserved. To Dr Victor Wong, thanks for letting me use your cell culture lab. Without that act of kindness, there would have been no 32 °C incubator for me and hence I would not have started a hypothermia project. To Dr Lin-Tang Goh and the rest of the glycosylation crew, my deepest appreciation for all of the analysis you did for me over the last two years. Perhaps with time, the initials "SF" will no longer give you nightmares.
Thanks also to Dr Heng-Phon Too, Hong Kiat, Mei Chee and Niki for all the help with the real time PCR assay. Bonus thanks go to Professor Too for providing me with a vast quantity of his real time buffer mix, which, I am here to certify, far outperforms the commercial mixes.
I had the chance to work with several helpful undergraduates at the National University of Singapore. Thanks to Sok Sing Goh, Upasana Patel and Mei Xia Yap for all your hard work on my projects. As you read this thesis, you will see that your data has become an integral part of my story.
During this project, I subjected billions and billions of cells to hypothermic conditions, so it seemed only proper to chill out myself from time to time. At those times, my friends on both ends of the globe were a great source of companionship and I thank you all. In Singapore, thanks to Simon for getting me going on the nightlife and then Kim, Leonard, Rowena and Tracy for keeping it going and giving me a good place to chill far away (by Singapore standards) from school. Also, thanks to my housemates, Peng Bo, Yuli and the Wangs, for your friendship, kindness and the delicious Chinese food. Special thanks to Colin and Simon for making the long flight out east for a visit. Moving west, the MIT crew made my trips home very memorable and gave me a good reason to break out my finest shoes. So, thanks go out to Brian, Greg, Jeremy, Joe, Kyle, Mike (both Polymer and Regular) and Prem and especially to Kathryn, who single-handedly reduces the group's male to female ratio from infinity to a respectable, single digit. Also, thanks go to the Dirussos, for making Boston an even better place for me. Lastly, to my friends and teachers at the Shim Gum Do Academy, our training and your lessons on strength and peace have been great assets to me during my studies, and I thank you deeply.
I would like to thank my family, Alex, Chloe, Geva, Julie, Nancy, Sue and my dad for their love and support. In particular, Alex and Geva, whose kindness and proximity makes me feel like a guy with two apartments, one of which is always better stocked in food and drink. Much love and thanks go to my mom, who unfortunately was not able to see me reach this point, but played the most vital role in getting me started on the right track in education at an early age.
Lastly, the perfect sequence of events needed for two very distant strangers to meet each other is mind-boggling, although the advent of commercial airliners certainly helps. With that in mind, I am eternally grateful to the Wright Brothers and also to everyone and everything else that guided me to make the right steps at the various bends in my life to meet Melissa, my best friend. Her contribution to this work and to my life is beyond measure and I dedicate this thesis to her.
TABLE OF CONTENTS
ABSTRACT ... 3 ACKNOWLEDGEMENTS ... 5 TABLE OF CONTENTS ... 7 LIST OF FIGURES ... 9 LIST OF TABLES ... 17 1. INTRODUCTION ... 19 1.1 BACKGROUND ... 19 1.2 MOTIVATION ... 20 1.3 THESIS OBJECTIVES ... 21 1.4 THESIS ORGANIZATION ... 21 2. LITERATURE REVIEW ... 232.1 THE CELL CYCLE: AN OVERVIEW ... 24
2.2 CELLULAR RESPONSE TO HYPOTHERMIA ... 30
2.3 CONTROLLED PROLIFERATION IN BIOTECHNOLOGY . ... 42
2.4 HYPOTHERMIC ANIMAL CELL CULTURE IN BIOTECHNOLOGY ... 51
3. MATERIALS AND METHODS ... ... 67
3.1 GENERAL NOTES ... 67
3.2 CELL CULTURE ... 67
3.3 IFN-y GLYCOSYLATION ANALYSIS ... ... 78
3.4 OTHER ANALYTICAL METHODS ... ... 81
4. HYPOTHERMIA INCREASES IFN-y PRODUCTION IN BATCH AND FED-BATCH CULTURES... 91
4.1 BATCH SHAKER FLASK CULTURE ... 91
4.2 BATCH BIOREACTOR CULTURE ... 96
4.3 FED-BATCH BIOREACTOR CULTURE ... 98
4.4 CONCLUSION S ... 100
5. TEMPERATURE SHIFT OPTIMIZATION MODEL FOR MAXIMIZING IFN-y VOLUMETRIC PRODUCTIVITY ...103
5.1 MODELING METHODOLOGY ... 104
5.2 MODEL DEVELOPMENT ... 107
5.3 MODEL VALIDATION ... 114
6. ENHANCED HYPOTHERMIC PRODUCTIVITY IS NOT DUE TO GROWTH
ARREST . ... 123
6.1 PSEUDO PERFUSION CELL GROWTH ... 124
6.2 IFN-y PRODUCTIVITY IS HIGHEST DURING ACTIVE GROWTH ... 128
6.3 IFN-y PRODUCTIVITY IS PROPORTIONAL TO IFN-y MRNA LEVELS ... 130
6.4 mRNA STABILITY INCREASES DURING HYPOTHERMIA ... 135
6.5 DISCUSSION AND CONCLUSIONS ... 137
7. ACTIVE HYPOTHERMIC GROWTH MAXIMIZES TOTAL IFN-y
PRODUCTION
...
147
7.1 IS ACTIVE GROWTH AT LOW TEMPERATURE FEASIBLE? ... 147
7.2 GROWTH FACTORS IMPROVE CELL DENSITY AT LOW TEMPERATURE .... 151
7.3 bFGF DECREASES THE LEVEL OF Go/GI CELLS DURING HYPOTHERMIA... 153
7.4 HYPOTHERMIC ACTIVE GROWTH INCREASES IFN-y PRODUCTION ... 157
7.5 HYPOTHERMIC ACTIVE GROWTH IN SUSPENSION CULTURE ... 160
7.6 HYPOTHERMIC ACTIVE GROWTH GREATLY ENHANCES TOTAL IFN-y PRODUCTION IN SUSPENSION CULTURE ... 162
7.7 DISCUSSION AND CONCLUSIONS ... 165
8. ISOLATING CHO CELLS CAPABLE OF HYPOTHERMIC GROWTH ... 171
8.1 OBTAINING CELLS WITH IMPROVED GROWTH UNDER HYPOTHERMIC
CONDITIONS
...
171
8.2 GROWTH CHARACTERISTICS OF AN IRRADIATED POPULATION ... 173
8.3 GROWTH CHARACTERISTICS OF SINGLE CELL CLONES ... 177
8.4 HYPOTHERMIC GROWTH MUTANTS OBTAIN THE HIGHEST TOTAL
PRODUCTION
...
184
8.5 CHO-K1 HYPOTHERMIC GROWTH CELL LINES ... 189
8.6 DISCUSSION AND CONCLUSIONS ... 192
9. THE EFFECT OF HYPOTHERMIA ON IFN-y GLYCOSYLATION ... 195
9.1 IFN-y GLYCOSYLATION DURING BATCH BIOREACTOR CULTURE ... 196
9.2 IFN-y GLYCOSYLATION DURING BATCH ADHERENT CULTURE ... 200
9.3 IFN-y GLYCOSYLATION DURING PSEUDO PERFUSION CULTURE ... 202
9.4 DISCUSSION AND CONCLUSIONS ... 205
10. CONCLUSIONS AND RECOMMENDATIONS ... 209
10.1 THESIS CONCLUSIONS ... 209
10.2 RECOMMENDATIONS FOR FUTURE RESEARCH ... 212
NOM ENCLATURE ... 219
REFERENCES
...
225
PHDCEP CAPSTONE PROJECT - BIOLOGICS OPERATIONS STRATEGY ... 241
LIST OF FIGURES
Figure 2-1. Cell cycle control and checkpoints. Progression through the cell cycle is mediated by cyclin/CDK complexes, which exert their positive effects at various checkpoints. Arrows represent activation and bars represent inhibition. R indicates a restriction point. Refer to the text for further details (adapted from Graia and Reddy, 1995) ... 26 Figure 2-2. Control of the cell cycle engine at the G1to S phase transition. Positive and negative
signals are propagated to the cyclin/CDK complexes, which then lead to phosphorylation of specific substrates and ultimately to the specific downstream events of the cycle. Signals listed are meant to serve as examples and are not a comprehensive set. Arrows represent activation and bars represent inhibition. Dashed lines represent hypothesized action. Refer to text for details (adapted from Graia and Reddy, 1995) ... 27 Figure 2-3. Model of the E. Coli Cold Shock Response. Under normal conditions, csp mRNA are rapidly degraded and no CSP are produced. Cold shock is sensed by the inactivation of ribosome function and consequent inhibition of protein synthesis and growth arrest. Simultaneously, csp mRNA stability is greatly enhanced. Only csp mRNA can still be translated by the inactivated ribosomes and CSP are synthesized. The CSP then stabilize the ribosome and normal protein synthesis and growth resumes. See text for details ... 32 Figure 2-4. Model for cold-induced growth arrest in mammalian cells. The growth-arresting p53 gene is stabilized under cold shock, resulting in induction of p21 and subsequent inhibition of CDK/cyc activity, arresting growth in Go/GI. In another path, cold shock disruption of protein synthesis causes the induction of CIRP, which causes growth arrest via an unknown mechanism. Arrows represent activation and bars represent inhibition ... 38 Figure 2-5: IFN-y Glycosylation Heterogeneity. IFN-y is produced with 0, 1 or 2 oligosaccharide branches. Each of these branches can be one of three types, complex, hybrid or high-mannose. All three types are derived from a common pentasaccharide core, which is shown in the large, dashed boxes. Each type can have up to four terminal branches, although only 2-3 branches are shown here ... 63 Figure 3-1. Gel electrophoresis of IFN-y and [3-actin PCR products at different PCR annealing temperatures. PCR products, from otherwise identical runs but using different annealing temperatures, were run on a 1% agarose gel (90V, 45 minutes) alongside Promega 100-bp DNA "step ladder" (Promega Corp, Madison, WI). Products from PCR using IFN-y primers are shown in the top frame and product from PCR using -actin primers are shown in the bottom frame. The products are verified to be single amplicons within the correct size range, namely 121-bp for IFN-y and 163-bp for P-actin. The annealing temperature for each lane is as follows: (1) 50 °C; (2) 50.4 C; (3) 51.2 C; (4) 52.5 C; (5) 54.2 C; (6) 56.4 C; (7) 58.9 C; (8) 61.7 C; (9) 62.7 °C; (10) 63.9 C; (11) 64.7 C; (12) 65 C. The optimal band for each gene was identified by visual inspection and was judged to be lane (8) for IFN-y and lane (7) for P-actin ... 87
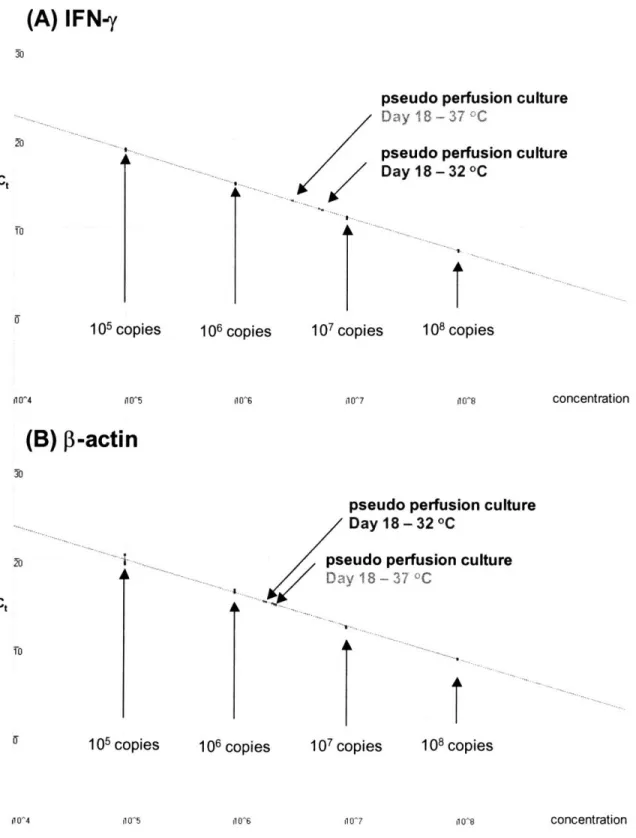
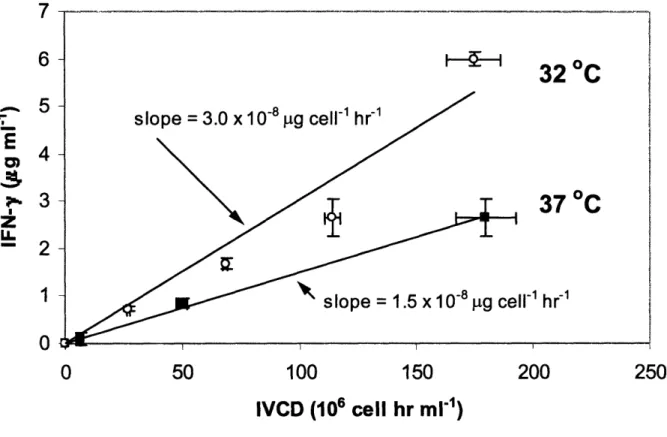
Figure 3-2. Real time PCR fluorescence versus PCR cycle number. An example of normalized fluorescence versus PCR cycle number for triplicates of (A) IFN-y serial standards (105 - 108 copies per sample) and (B) P3-actin serial standards (105 - 108 copies per sample) are shown. Threshold fluorescence was calculated by the RotorGene 2000 Version 4.6 software and is shown as a horizontal line on the figures. Two experimental samples from day 18 of the pseudo perfusion culture are also shown (refer to Chapter 6) ... 88 Figure 3-3. Threshold cycle (Ct) as a function of DNA copy concentration. The data from Figure 3-2 is plotted here. The concentration of the standards is known and from these values, the standard curves for (A) IFN-y and (B) 13-actin are constructed and the concentration of each gene in each sample can be interpolated from the standard curve ... 89 Figure 4-1. Shaker flask growth curves at different culture temperatures. Cells were grown at 32 °C (e), 37 C () or 40 C (A). The cultures were terminated once the percent cell viability dropped below 90%. For all figures in this thesis, the error bars are + one standard deviation.. 92 Figure 4-2. Shaker flask viability curves at different culture temperatures. Cells were grown at 32 °C (e), 37 °C () or 40 °C (A). Each culture was ended once the percent cell viability dropped below 90% ... 92 Figure 4-3. Cell cycle distribution one day post-seeding. Cells from the same cell seed stock were grown for 24 hours at either 32 C or 37 C and their cell cycle distribution was then measured. Hypothermia increases the percentage of Go/G cells significantly ... 93 Figure 4-4. IFN-y concentration versus IVCD for shaker flask cultures. The slope of the curve is the average specific productivity at 32 C () and 37 C (). The lines shown are linear least-squares fits of each data set ... 95 Figure 4-5. Batch bioreactor growth curve. Cells were grown at either 32 °C () or 37 °C (). The cultures were terminated once the percent cell viability dropped below 80% ... 97 Figure 4-6. IFN-y concentration versus IVCD for batch bioreactor cultures. The slope of the line gives the average specific productivity of IFN-y at 32 °C () and 37 °C (). The lines shown are linear least-squares fits of each data set ... 97 Figure 4-7. Fed-batch bioreactor growth curves. Cells were grown at 32 °C () or 37 °C () and fed a 10X concentrated feed medium twice daily. The cultures were terminated once the percent cell viability dropped below 80% ... 99 Figure 4-8. IFN-y concentration versus IVCD for fed-batch bioreactor cultures. The slope of the curve gives the average specific IFN-y productivity at 32 °C () and 37 °C () ... 99 Figure 4-9. Fed-batch bioreactor osmolality curves. Cells were grown at 32 °C () or 37 °C () and fed a 10X concentrated feed medium twice daily, causing osmolality to increase with time.
... 101
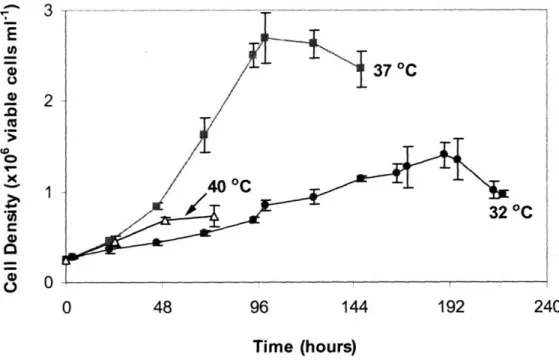
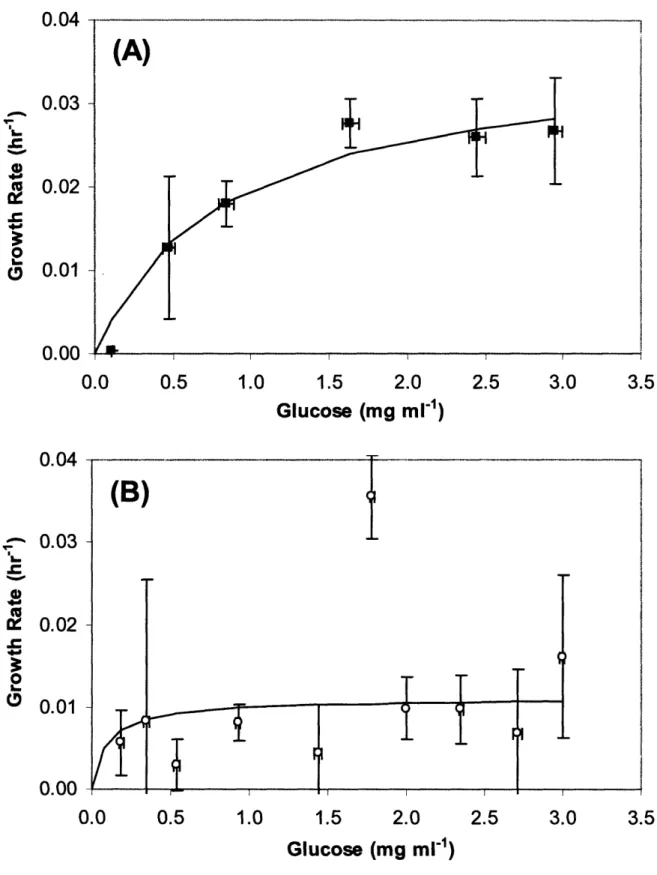
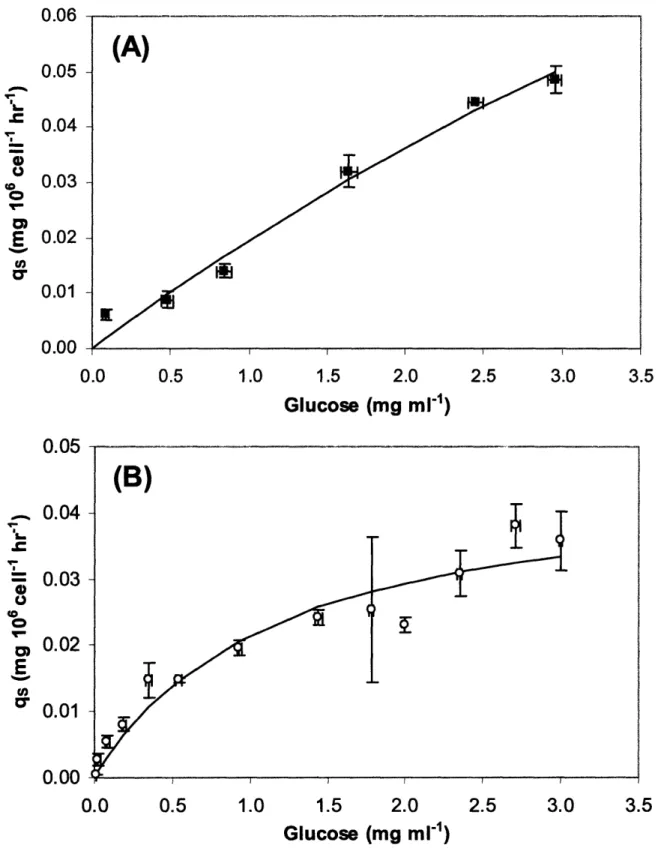
Figure 5-1. Low temperature reduces cell growth. Cell concentration profile at 32 °C (o) and 37 °C ().The cultures were terminated once the percent cell viability dropped below 90% ... 108 Figure 5-2. Growth rate as a function of glucose concentration. Monod model prediction (-) compared to experimental data for (A) 37 °C culture () and (B) 32 °C culture (o). ... 109 Figure 5-3. Glucose consumption rate as a function of glucose concentration. Monod model prediction (-) compared to experimental data for (A) 37 °C culture () and (B) 32 °C culture (o). ... .110
Figure 5-4. IFN-y concentration as a function of IVCD. Average specific productivity, qIFN, is the slope of the least-squared linear fit for 32 °C (o) and 37 °C (-) ... 111 Figure 5-5. Correlation between glucose depletion and the onset of massive cell death. The drop in percent viability to below 90% at 32 °C (o) and 37 °C (o) coincides with the depletion of glucose at 32 °C (e) and 37 °C (), respectively. The last day at which viability is above 90% occurs on the same day that glucose is depleted (<0.03 mg ml-l; see text for details) ... 113 Figure 5-6. Peak cell density as a function of temperature shift day. Model prediction () compared to experimental data (n) ... 115 Figure 5-7. Glucose concentration profile for a shift from 37 °C to 32 °C on the third day of culture. Model prediction (-) compared to actual data (-) ... 115 Figure 5-8. Correlation between glucose depletion and the onset of massive cell death in temperature shift cultures. The drop in percent viability to below 90% for 1-day (E), 2-day (o), 3-day (0), and 4-day (A) temperature shifts coincides with the depletion of glucose (solid symbols of the same shape as the corresponding viability symbol). The last day at which viability is above 90% and the time that glucose is depleted (<0.03 mg ml-'; see text for details) occur on the same day and are marked with dashed arrows on the figure and labeled with the respective temperature shift day (1-4) ... 117 Figure 5-9. Total IFN-y produced at the end of batch culture as a function of the temperature shift day. Samples were taken on the day glucose became depleted, which coincides with the last day of high cell viability. Model prediction (-) compared to actual data (a). A shift day of "0" means that the culture was conducted at 32 °C exclusively and a shift day of "o" means that the culture was conducted at 37 °C exclusively ... 118 Figure 5-10. y volumetric productivity as a function of the temperature shift day. Total IFN-y produced for a given batch was normalized bIFN-y the number of daIFN-ys required to complete the batch. Model prediction (-) compared to actual data (-o-). A shift day of "0" means that the culture was conducted at 32 °C exclusively and a shift day of "o" means that the culture was conducted at 37 °C exclusively ... 118
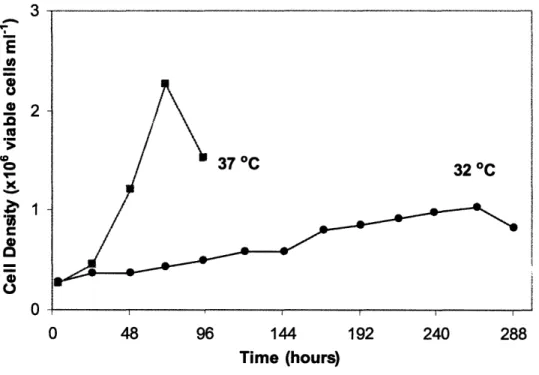
Figure 6-1. Cell growth during pseudo-perfusion culture. Cells were grown at 32 °C (), 37 °C (m), or at 37 °C for 10 days followed by a shift to 32 °C (TS) (). Cell density is shown as cells per well in (A) or as natural logarithm of cell density (N) divided by initial cell density (No) in (B) ... 126 Figure 6-2. Cell cycle distribution during pseudo-perfusion culture. Cells were grown at 32 °C (e), 37 °C (), or at 37 °C for 10 days followed by a shift to 32 °C (TS) (o). The percentages of Go/GI phase (A) and S phase (B) cells are shown ... ... 127 Figure 6-3. Specific productivity correlates with the percentage of cells in the S phase. The specific productivity was measured throughout the perfusion culture and the weighted average percentage of S phase cells during the same period was calculated. At both 32 °C () and 37 °C
(m), productivity increases as the percent of S phase cells increases. The 32 °C data includes the
TS () samples. Day 2 at 32 C (o) appears to be an outlier. The two lines are linear, least-square fits of the 32 °C (including TS) and 37 °C data ... 129 Figure 6-4. Specific productivity correlates with the level of IFN-y mRNA during day 15-18 of culture. The specific productivity was measured daily during day 15-18 of the perfusion culture and the IFN-y mRNA levels during the same period were determined and normalized to P-actin mRNA. Samples were measured from all three conditions (32 C, 37 °C, TS). The ratio of productivity and IFN-y mRNA at 32 C to their counterparts at 37 °C (labeled "32 °C exclusively") and the ratio of productivity and IFN-y mRNA at TS to their counterparts at 37 °C (labeled "Temperature shift") were calculated and plotted. In both cases, the increase in specific productivity under hypothermic conditions correlates with the increase in IFN-y mRNA ... 132 Figure 6-5. Specific productivity correlates with the level of IFN-y mRNA throughout the entire culture period at all temperature conditions. The specific productivity was measured throughout the perfusion culture and the IFN-y mRNA levels during the same period was determined and normalized to 3-actin mRNA. At 32 C (), 37 °C () and TS (), productivity increases as the level of IFN-y mRNA increases. The line is a linear least-square fit for all of the data points. 134 Figure 6-6. mRNA degradation profile. Cells on day 17 of the pseudo perfusion growing at 37 °C or 32 C (TS samples) were treated with Actinomycin D to arrest transcription at 0 hours and then RNA was isolated from cells sampled at various times following Actinomycin D treatment. The [3-actin and IFN-y mRNA levels in the samples were measured using real time RT-PCR and normalized to the total RNA concentration. The levels of mRNA per total RNA were then normalized against the levels of mRNA per total RNA of the first sample (-2 hours post-Actinomycin D treatment) for each gene at each temperature to obtain the values shown in this figure. Symbol coding is as follows: 32 °C IFN-y (o); 32 C -actin (e); 37 °C IFN-y (a); 37 °C
-actin (·) ... 136
Figure 6-7: Four production scenarios when considering combined hypothermia and cell cycle effects. A cell line can be either non growth- [(I) and (II)] or growth-associated [(III) and (IV)] and also show either an increase [(II) and (IV)] or decrease [(I) and (III)] in productivity under hypothermic conditions. On the figures, "q" refers to specific productivity and "%S" refers to the percentage of cells in the S phase. Refer to text for details ... ... 143
Figure 7-1. Cells are not growth arrested at intermediate temperature. Adherent cells were grown at 31.5 °C (), 34.5 °C (o) and 37 °C (). Whereas cells exhibit strong arrest at 31.5 °C relative to the 37 °C control, they are hardly affected by growing at 34.5 °C ... 148
Figure 7-2. Arrhenius plot of CHO cell growth. Adherent cells were grown at 31.5 °C (), 34.5 °C (o) and 37 °C (). Whereas cells exhibit strong arrest at 31.5 °C relative to the 37 °C control, they are hardly affected by growing at 34.5 °C. This plot shows that growth under hypothermic
conditions is not kinetically-limited ... 148 Figure 7-3. Average specific productivity is not enhanced at intermediate temperature. Adherent cells were grown at 31.5 C (), 34.5 °C () and 37 °C (). Whereas cells exhibit enhanced productivity at 31.5 °C relative to the 37 °C control, productivity is unaffected by growing at
34.5 °C ... 150 Figure 7-4. Effect of growth factors on hypothermic growth peak cell densities. Adherent cells were grown at 32 °C in the absence ("Control") or presence of insulin (5-15 lPg ml'l), bFGF (13-42 ng ml-l), or a combination of the two growth factors (21 ng ml-' bFGF and 15 lag ml-' insulin) and their peak cell density was determined. Both factors are able to promote growth at low temperature although bFGF treated cells have higher peak cell density. The combination of the two growth factors did not have a significant additive effect ... 152 Figure 7-5. Treatment with bFGF promotes growth under hypothermic conditions. Adherent CHO-y control and bFGF-treated cells (45 ng ml-') were seeded at the same density and grown at 32 C or 37 °C. (A) Control cells on day 5 at 37 °C; (B) bFGF-treated cells on day 5 at 37 °C; (C) Control cells on day 8 at 32 °C; (D) bFGF-treated cells on day 8 at 32 °C ... 154 Figure 7-6. bFGF stimulates cell growth under hypothermic conditions. Adherent cells were grown at 32 °C and 37 °C in the presence or absence of 45 ng ml-' bFGF. The bFGF has no beneficial effect at 37 °C ( control; bFGF). In contrast, the bFGF causes the peak cell density to double at 32 °C ( control; o bFGF). The cultures were terminated once the percent cell viability was less than 80% ... 155 Figure 7-7. bFGF increases the percent of S phase cells throughout culture under hypothermic conditions. Adherent cells were grown at 32 °C and 37 °C in the presence or absence of 45 ng ml-'bFGF. The bFGF has no significant effect at 37 °C ( control; o bFGF). In contrast, the bFGF causes the cells to maintain about 10% more S phase cells at 32 °C throughout the culture (-control; o bFGF) ... 156 Figure 7-8. Active hypothermic growth caused increased total IFN-y production. Adherent cells were grown at 32 C and 37 C in the presence or absence of 45 ng ml-' bFGF and IFN-y concentration was measured at the end of the batch culture. The bFGF causes total production to decrease at 37 C ( control; bFGF). In contrast, the bFGF causes the total production to increase by about 50% under hypothermic conditions by promoting growth ( control; o bFGF). ... ... ... 158
Figure 7-9. bFGF reduces average specific IFN-y productivity at both temperatures. Adherent cells were grown at 32 °C and 37 °C in the presence or absence of 45 ng ml- bFGF and average IFN-y specific productivity for the entire culture was calculated. The bFGF causes specific productivity to decrease both at 37 °C and at 32 °C ... 159 Figure 7-10. The positive effect of hypothermia on specific productivity is maintained during active growth. Adherent cells were grown at 32 C and 37 °C in the presence or absence of 45 ng ml' bFGF and average IFN-y specific productivity for the entire culture was calculated. The
ratio of 37 C to 32 °C specific productivity remains unchanged in the presence or absence of bFGF, showing that hypothermic active growth does not diminish the positive effect of low temperature on specific productivity ... 159 Figure 7-11. Serum supplementation significantly increases cell density at low temperature. Cells were grown in suspension culture in a protein-free medium supplemented with 0 (), 10 () or 25% (A) FBS. FBS supplementation does not significantly increase cell density at 37 C (A) whereas FBS supplementation has a large effect on growth at 32 °C (B). The cultures were terminated once the percent cell viability was less than 80% ... 161 Figure 7-12. Serum supplementation significantly increases total production during hypothermic growth. Cells were grown in suspension in protein-free medium supplemented with 0, 10 or 25% FBS. Whereas FBS has an insignificant impact on production at 37 C, serum is seen to dramatically increase total production at 32 C, as a result of the combined improvement in cell growth (see Figure 7-1 1) and the high specific productivity characteristic of hypothermia ... 163 Figure 7-13. Specific productivity is higher in actively growing cells. Cells were grown in suspension in protein-free medium supplemented with 0, 10 or 25% FBS. Average specific productivities for the entire culture were found from the final IFN-y production (Figure 7-12) and the culture IVCD (Table 7-1). The effect of temperature on productivity is separate from the effect of growth state on productivity. Both hypothermia and active growth promote increased specific productivity ... 164 Figure 8-1. Hypothermic mutant population exhibits improved growth at low temperature. Adherent CHO-y control and hypothermic mutant cells were seeded at the same density and grown at 32 °C or 37 °C. (A) Control cells on day 4 at 37 °C; (B) Mutant cells on day 4 at 37 °C; (C) Control cells on day 7 at 32 C; (D) Mutant cells on day 7 at 32 °C. Note the lower surface density for "C" relative to "D" and the long, elongated morphology in "C", a characteristic of Go/Gl arrested CHO cells. See text for details ... ... 174 Figure 8-2. Hypothermic mutants are capable of improved growth at 32 C. Adherent CHO-y control and hypothermic mutant cells were grown at 32 C ( control; o mutant) and 37 C (n control; E] mutant). At 32 C, the mutants achieve more than double the cell density of the control, whereas growth at 37 C is not greatly affected.The cultures were terminated once the percent cell viability was less than 80% ... 175
14
Figure 8-3. Arrhenius plot reveals that hypothermic mutants exhibit improved growth rate under hypothermic conditions. Adherent CHO-y control and mutant cells were grown at 31.5 °C (-control; o mutant), 34.5 °C (A(-control; A mutant) and 37 °C (m (-control; o mutant). Whereas both cell lines exhibit strong arrest at 31.5 °C relative to the 37 °C control, they are hardly affected by growing at 34.5 C. The mutant has significantly higher growth rate at 31.5 °C than the control ... 176 Figure 8-4. Mutant Clones are capable of significantly enhanced hypothermic growth. Adherent CHO-y control cells and mutant clones "1" and "A" were grown at (A) 37 °C and (B) 32 °C. At 37 °C, mutant A (o) grows similarly to the control () whereas mutant 1 (--A--) grows slower. In contrast, both mutants exhibit significantly improved growth at 32 °C. The cultures were terminated once the percent cell viability was less than 80% ... 178 Figure 8-5. Mutant Clones have a higher proportion of S phase cells during hypothermic growth. Adherent CHO-y control cells and mutant clones "1" and "A" were grown at (A) 37 C and (B) 32 °C and the proportion of cells in each phase of the cell cycle was measured on a daily basis. At 37 °C, mutant A (o) exhibits a higher percentage of S phase cells relative to the control (n) during the first few days, followed by a period of slightly lower percentage of S phase cells whereas mutant 1 (-- --) exhibits a sharp increase in S phase cells on day 3 followed by a rapid decline. In contrast, the trends are far more consistent under hypothermic conditions, with both mutants exhibit a higher proportion of S phase cells throughout the culture at 32 °C ... 181 Figure 8-6. Mutants produce significantly more IFN-y than control cells under hypothermic conditions. Adherent CHO-y control cells and mutant clones "1" and "A" were grown at 37 °C and 32 °C and the total IFN-y was measured on the last day cell viability was above 90% (A) and the first day cell viability was below 80% (B), which was also the point at which all cultures were terminated. At both viability points, the mutants grown under hypothermic conditions significantly outperformed any other cultures. The mutants did not show significant enhanced total production at 37 °C and thus the increase can be attributed to active hypothermic growth. ... 186 Figure 8-7. Specific Productivity of mutant and control cells at each temperature depends on cell cycle distribution. Adherent CHO-y control cells () and mutant clones "1" (A) and "A" (o) were grown at 37 C and 32 C. Specific productivity was calculated from the total IFN-y concentration measured at two points per cell line (Figure 8-6). Differences in specific productivity between the mutants and control appear to be due to the dependence of productivity on cell cycle distribution ... 188 Figure 8-8. Mutant Clones are capable of significantly enhanced hypothermic growth. Adherent CHO-K1 control () cells and clones "C33" (), shown in (A), and "M25" (--o--), shown in (B), were grown at 37 °C and 32 °C. At 37 °C, the mutants grow similarly to the control. In contrast, both mutants exhibit significantly improved growth at 32 °C, with peak densities significantly
Figure 9-1. Percentage of 2N IFN-7 glycoform produced during batch bioreactor cultures. The percentage of 2N glycoform at various points during culture is shown for 37 °C (m) and 32 °C (e) culture in (A) and for TS (A) and 32 °C () culture in (B). Figure Y-axis scale was chosen for comparison with figures throughout this chapter, which will all use the same Y-axis scales.... 197 Figure 9-2. Site sialylation in batch bioreactor cultures. The site sialylation at various points during culture is shown for 37 °C () and 32 C () culture. Y-axis scale was chosen for comparison with figures throughout this chapter, which will all use the same Y-axis scales.... 199 Figure 9-3. Percentage of 2N IFN-y glycoform produced during adherent cell batch cultures. The percentage of 2N glycoform at various points during culture is shown for 37 °C () and 32 °C (e). Figure Y-axis scale was chosen for comparison with figures throughout this chapter, which will all use the same Y-axis scales... 201 Figure 9-4. Site sialylation in adherent batch cultures. The site sialylation at various points during culture is shown for 37 C () and 32 C () culture. Y-axis scale was chosen for comparison with figures throughout this chapter, which will all use the same Y-axis scales.... 201 Figure 9-5. Percentage of 2N IFN-y glycoform produced during pseudo perfusion culture. The percentage of 2N glycoform at various points during culture is shown for 37 °C 32 "C (--*--) and TS (A). Figure Y-axis scale was chosen for comparison with figures throughout this chapter, which will all use the same Y-axis scales ... 203 Figure 9-6. Site sialylation in pseudo perfusion cultures. The site sialylation at various points during culture is shown for 37 "C (----), C (-- --) and TS (A). Y-axis scale was chosen for comparison with figures throughout this chapter, which will all use the same Y-axis scales.... 204
LIST OF TABLES
Table 2-1. Effect of hypothermia on mammalian cell metabolism (relative to 37 °C) ... 55
Table 2-2. Effect of hypothermia on heterologous protein productivity (relative to 37 °C) ... 59
Table 4-1. Effect of culture temperature on IFN-y production... ... 101
Table 5-1. Temperature shift optimization model parameters ... 108
Table 5-2. Duration of batch culture for various temperature shifts ... 117
Table 6-1. mRNA half-lives in Pseudo Perfusion Culture ... 136
Table 7-1. Culture performance parameters for various mitogen conditions ... ... 166
Table 8-1. Culture performance parameters for CHO-y Control and Mutants ... 179
Table 8-2. Duration of each phase of the cell cycle for CHO-y control and mutants ... 183
Table 8-3. Culture performance parameters for CHO-K1 Control and Mutants ... 191
1. INTRODUCTION 1.1 BACKGROUND
Researchers have long realized that cells must be able to quickly adapt to sudden decreases in temperature. For example, bacteria residing in the intestines of animals living in cold environments confront sudden and drastic temperature downshift following excretion (Thieringer et al, 1998). Some mammals have also adapted to deal with low temperatures, as evidenced by adaptive hypothermia, or hibernation. Cricetus griseus, more commonly known as the Chinese hamster, is native to the cold deserts of Northern China and Mongolia and is one such hibernating animal. Hibernation occurs when the environmental temperature falls below 5 °C (ProVet, 2003). The hamster's metabolic rate falls dramatically, resulting in as few as one heart beat every few minutes and slow breathing. During hibernation, the hamster's body temperature drops to just 1-2 C above the environmental temperature. They do not eat for weeks and unsuspecting owners may think their hamster is "dead", which unfortunately results in pet Chinese hamsters being discarded during hibernation, or worse, being buried alive! Pet hamsters undergoing hibernation can be revived by placing on a warming pad set to 30 C for 30-60 minutes, but should never be warmed in cooking ovens or microwaves (ProVet, 2003).
The production of recombinant human glycoproteins is routinely carried out using the Chinese Hamster Ovary (CHO) cell line. Although bacterial and yeast cell lines are capable of producing much larger quantities of recombinant proteins, only mammalian cells are capable of correctly carrying out complex post-translational modifications such as proper folding and glycosylation, which has been correlated with specific activity and circulatory half life of therapeutic glycoproteins (Goochee et al, 1991; Kaufman, 1989; Kaufman et al, 1988). CHO cells have emerged as the mammalian cell line of choice for industrial-scale production of many recombinant proteins owing to their ability to perform post-translational modifications, their high
stability of chromosomally integrated heterologous transgenes (Schimke, 1984), their relative ease of adaptation to protein-free suspension culture (Meents et al, 2002) and the availability of dihydrofolate reductase mutants (DHFR-) that enable amplification of recombinant product-encoding regions of chromosome (Kaufman et al, 1983; Urlaub and Chasin, 1980) and subsequent high expression levels.
Animal cell culture is typically conducted at human physiological temperature, namely 37 C, long viewed as a constant physical parameter by the bioengineering community (Fussenegger and Bailey, 1999). However, given the fact that the original animal source of the cell line is a hibernator, CHO cells should be quite capable of handling low temperatures and one may speculate there would be bioprocess benefits to growing under hypothermic conditions. This speculation has borne fruit, as within the last five years, several research groups have found that certain CHO cell lines are capable of improved productivity at low temperature, prompting interest in further understanding and optimizing hypothermic culture.
1.2 MOTIVATION
In the next few years, the number of FDA-approved protein pharmaceutical products is expected to increase substantially, with many products currently under development or in the clinical trial phase (Kretzmer, 2002). Production of these products will become a major bottleneck for bringing them to market, as current manufacturing capacity will not be sufficient. Bringing these products to the consumer will be delayed, as new and costly facilities will need to be constructed or existing production facilities will need to be revamped for higher productivity. Thus, any operational improvements to the cell culture process that cause significant increases in productivity without compromising product quality will have a positive impact on meeting the
upcoming manufacturing challenge and providing humans with sufficient amounts of medicine in the shortest time frame.
1.3 THESIS OBJECTIVES
The central goal of this thesis was to study and optimize the application of mild hypothermia for recombinant protein production. The model system used was a CHO cell line, referred to as CHO-y, producing recombinant human interferon-gamma (IFN-y). Within this central goal, the thesis has four major objectives. First, demonstrate that the CHO-y line has enhanced productivity at low temperature under a variety of culture conditions. Second, determine the basis for the hypothermic enhancement in productivity. Specifically, it is speculated in the literature that growth arrest is the cause of the enhanced productivity during hypothermia and this claim needed to be verified or refuted before determining how best to optimize hypothermic culture. Third, verify whether active hypothermic growth, a novel culture strategy, can be implemented by either growth factor supplementation or mutant cell line generation and whether it causes the hypothesized increase in total IFN-y production. Fourth, determine whether hypothermic culture has a significant impact on IFN-y glycosylation.
1.4 THESIS ORGANIZATION
This thesis is divided into ten chapters. Chapter 2 provides a review of the literature on hypothermia and other topics pertinent to the thesis. In Chapter 3, the materials and methods used are given in detail. Chapter 4 demonstrates the effect of mild hypothermia on growth and productivity in batch and fed-batch cultures of the CHO-y cell line. In Chapter 5, a model is proposed for optimizing the trade-off between high growth and low productivity at standard
culture temperature (37 °C) and low growth and high productivity at low temperature (32 °C) by using a temperature shift strategy. Chapter 6 deals with the mechanistic effect of low temperature by studying the combined effect of hypothermia and growth arrest on IFN-y mRNA levels. The results of Chapter 6 form the basis for the work of Chapter 7, which considers the effects of growth factors on hypothermic culture and demonstrates that the most suitable production platform for maximizing total IFN-y production is active growth at low temperature. These findings formed the motivation to produce a CHO-y cell capable of active hypothermic growth without the use of growth factors, and this work is discussed in Chapter 8. Also in Chapter 8, the development of a non-recombinant CHO-K1 cell capable of active hypothermic growth and envisioned as a generic production platform for enhanced productivity of any recombinant protein, is discussed. Chapter 9 covers the effect of low temperature on IFN-y glycosylation, a key indicator of recombinant protein product quality. Chapter 10 presents concluding remarks and recommendations for future research in the hypothermic cell culture field. A nomenclature section and a list of the cited references follow chapter 10.
22 ___
2. LITERATURE REVIEW
The response of cells to hyperthermia, or heat shock, is a well-studied phenomenon. From bacteria to mammals, an increase in temperature results in a heat shock response, characterized by the synthesis of a set of well-conserved heat shock proteins (HSP). These proteins have been identified as molecular chaperones, responsible for assisting protein folding and enhancing protein stability, two crucial requirements for maintaining protein function under elevated temperatures (Thieringer et al, 1998). In contrast, the response of cells to hypothermia, or cold shock, is not well characterized at the molecular level. The scant evidence available suggests that, much like the heat shock response, there is a conserved cold shock response that involves the active response of the cell by synthesizing a set of cold shock proteins (CSP). The known elements of the cold shock response will be considered in more detail later.
Although little is known about the molecular level response of cells to hypothermia, it has been known for many years that the growth rate of mammalian cells decreases as temperature is lowered from the conventional cultivation temperature of 37 C (Rao and Engelberg, 1965; Watanabe and Okada, 1967). Cell cycle distribution analysis has shown that by and large, the Go/GI phase of the cell cycle is most affected by low temperature and cells exposed to mild hypothermic conditions for a long enough period of time will tend to arrest in this phase (Fujita, 1999). This is the case for Chinese hamster cells, at least within the mild hypothermic range of 25-32 °C (Moore et al, 1997; Shapiro and Lubennikova, 1968). Within the 6-15 "C range, Chinese hamster cells arrest during mitosis instead (Shapiro and Lubennikova, 1968). However, because active metabolism such as ATP production and macromolecular synthesis is not observed at such extreme hypothermic conditions (Fujita, 1999), these very low
temperatures probably have limited application for mammalian cell culture and were not considered in this thesis.
Given that growth arrest is a hallmark of the mammalian hypothermic response, and that cells can actively induce growth arrest via various cell cycle controls, it is appropriate to review the regulation of the cell cycle and some of the key molecules involved, prior to considering the cold shock response.
2.1 THE CELL CYCLE: AN OVERVIEW
Progression through the various stages of the cell cycle is a tightly controlled, complex event meant to ensure that cells do not grow and divide when conditions are unfavorable. Given the growth-arresting effect of hypothermia, a review of the cycle and its control mechanisms is pertinent here. This review is not comprehensive, but provides an overview of cycle progression and control and also introduces some of the key molecular players involved, several of which will be discussed in the context of hypothermia as well as biotechnology applications later.
The cell cycle is divided into four phases, one associated with DNA synthesis (S Phase), one with mitosis (M Phase) and two gap phases, G1and G2, during which time cells prepare for S
and M Phase, respectively (Alberts et al, 1994). The drivers of the cell cycle are protein complexes that are activated and trigger the initiation of key events, such as DNA replication, nuclear envelope breakdown, spindle formation and chromosome segregation. These protein complexes are subjected to tight control via signaling cascade pathways, ensuring that events occur in the proper order. The transduction pathways are initiated by extracellular signals. For example, mitogenic growth factors bind their specific receptors and initiate a cascade of events. This cascade will lead to the production of holoenzymes composed of cyclin and a catalytic
subunit called cyclin dependent kinase (CDK) (Hartwell and Weinert, 1989). These kinase enzymes are responsible for phosphorylation reactions, which in turn lead to gene expression and the completion of various cell cycle tasks, such as DNA replication. Several different cyclins and CDK exist in mammalian cells and owing to their critical role in the cell cycle, they are often referred to as the "cell cycle engine" (Graiia and Reddy, 1995). Figure 2-1 gives an overview of the points of control in the cell cycle and the specific cyclins/CDK complexes involved at each checkpoint. Note that major control occurs at the two most critical points: that of DNA synthesis (S) and cell division (M). Owing to the fact that CHO cells exhibit arrest in the Go/GI phase of the cycle, the discussion here will center on the control events at this progression point. Figure 2-2 gives an overview of the signals and signaling pathways involved in the control at the G1to S
DNA-damaged checkpoint
--./,
DNA-damaged/ unreplicated DNA checkpoint \ Spindle hI• k i+Figure 2-1. Cell cycle control and checkpoints. Progression through the cell cycle is mediated by cyclin/CDK complexes, which exert their positive effects at various checkpoints. Arrows represent activation and bars represent inhibition. R indicates a restriction point. Refer to the text for further details (adapted from Grafia and Reddy, 1995).
cycD
Mitogenic and antimitogenic
IL-2 TGF-P CSF-1
I'
Butyrate p5 3 I p21 SIGNALS SIGNALING TRANSDUCTION PATHWAYS AND FEEDBACK LOOPS I I I I i I I I I I I I I I I I i I L,, I IDK2
ycE P II E2F/ DPjI
P CDK2cycA
I
P CELL CYCLE ENGINE PHASE-SPECIFIC SUBSTRATES Transcriptional activation ofS-phase genes DNA replication
SPECIFIC DOWNSTREAM EVENTS
Figure 2-2. Control of the cell cycle engine at the G1 to S phase transition. Positive and
negative signals are propagated to the cyclin/CDK complexes, which then lead to phosphorylation of specific substrates and ultimately to the specific downstream events of the cycle. Signals listed are meant to serve as examples and are not a comprehensive set. Arrows represent activation and bars represent inhibition. Dashed lines represent hypothesized action. Refer to text for details (adapted from Grafia and Reddy, 1995).
Mitogens
p1 Ep
E2F/
-SDP
The signaling cascade begins with the input of extracellular signals, including growth promoters such as interleukin-2 (IL-2), colony stimulating factor-i (CSF-1), and other mitogens, growth inhibitors such as transforming growth factor-, (TGF-p) and environmental signals such as y-irradiation, which in turn activates the p53 protein (Graiia and Reddy, 1995). Different cell types require different combinations of growth factors. For example, T Lymphocytes can be induced to proliferate by antigen stimulation and IL-2 (Graiia and Reddy, 1995). Owing to the industrial relevance of CHO, the growth factor requirements of these cells in serum-free medium have been quite well studied. Insulin (Bailey et al, 2002; Sanfeliu et al, 2000), insulin-like growth factor (IGF-I) in combination with transferrin (Sunstrom et al, 2000) and basic fibroblast growth factor (bFGF) (Bailey et al, 2002) have all been shown to stimulate CHO proliferation. Growth factors are required for progression through the G1phase to a specific point called the
restriction point (R; see Figure 2-1), after which point, growth factors are no longer necessary for cell cycle progression (Pardee, 1989).
Extracellular signals play a role in regulating the level of cyclins. For example, cyclin D is absent in quiescent cells and its expression is stimulated by growth factors. In the presence of growth factors, cyclin D levels are maintained quite constant throughout the cell cycle. In contrast, cyclin E levels oscillate periodically, with activity peaking in late G1, followed by
degradation of cyclin E once S phase begins, allowing CDK2 to associate with cyclin A (Grafia and Reddy, 1995). The levels of both of these Gi cyclins are rate-limiting for the progression of cells through the cell cycle, as shown by the fact that ectopic expression of the cyclins shortens the length of the G1phase (Sherr, 1994). Over-expression of cyclin E in CHO cells was shown
28
to give the same morphology and active growth as control cells supplemented with bFGF, suggesting that the bFGF exerts its effect by controlling the level of cyclin E (Bailey et al, 2002). In many cases, extracellular signals also exert their effect by changing the levels or activity of the cyclin-dependent kinase inhibitors (CKIs), examples of which are shown in Figure 2-2 (p15, p16, p18, p21, and p27). The first CKI identified, p21, was discovered as a protein that forms complexes with a cyclin/CDK pair (Xiong et al, 1992), preventing the CDK from carrying out downstream phosphorylation and thereby preventing DNA replication. This CKI is induced by p53 but also appears to be involved in p53-independent growth arrest (Halevy et al, 1995).
Another major CKI is p27, which has been shown to exert negative control on the activity of CDK2/CyclinE and CDK4/6/CyclinD (Grafia and Reddy, 1995). This CKI is present in quiescent cells, but addition of growth factor (e.g. IL-2 to T lymphocytes) results in a decrease in the p27 levels which eventually leads to the activation of the relevant CDK complexes (Firpo et al, 1994; Nourse et al, 1994). This CKI also plays a role in the growth-arresting effect of the potent growth inhibitor, TGF-P. In this case, TGF-[ inhibits CDK4 synthesis, leading to release of p27 from CDK4/cycD complexes and the subsequent inhibition of CDK2/cycE complexes by p27 (Ewen et al, 1993). Other CKIs have been identified, such as p15, p16, and p18, which play similar roles as p21 and p27 (Graiia and Reddy, 1995). In summary, in the presence of negative extracellular signals, the CKIs have a vital role in maintaining cells in Go/G1.
When the CDK/cyclin complexes are present in an activated form, they propagate growth signals via phosphorylation of various substrates. Multiple proteins have been proposed as putative downstream targets of different cyclin/CDK holoenzymes. One target protein in particular, the retinoblastoma protein (pRb), has been well studied and will be used here to illustrate the elegant cell cycle control and feedback system. The proposed model for the
interaction of pRb with the cell cycle machinery is shown in Figure 2-2. In this model, hypophosphorylated pRb exists in quiescent or early G1cells. In this form, the pRb binds several
other proteins, including E2F/DP, a transcription factor complex. As cells progress through G1,
CDK/cycD activity increases and acts to phosphorylate pRb. In the more phosphorylated form, pRb no longer binds E2F/DP, freeing the transcription factor to activate a variety of S Phase genes. In addition, the hypophosphorylated pRb is believed to act as a repressor of p16 and p18, resulting in CDK/cycD levels increasing (see Figure 2-2). Phosphorylation of pRb by the CDK/cycD complex eliminates pRb repression of p16 and p18, resulting in increased p16 and pl 8 levels, which in turn reduces CDK/cycD activity. Thus, the CDK/cycD activity is turned off after it has completed its function. Prior to the next pass through G1, the pRb will become
hypophosphorylated again (Grafia and Reddy, 1995).
In summary, progression through the mammalian cell cycle is a complex and tightly regulated process that takes into account both positive and negative environmental cues and translates these cues into signal transduction pathways, culminating in the expression of genes required for the specific events of each phase of the cycle. Within the framework of the events discussed here, mild hypothermia is a negative extracellular signal, causing the arrest of CHO in the Go/GI phase. The mechanism and molecular players involved in the hypothermic response, and their link to the cell cycle controls in the case of mammalian cells, are discussed next.
2.2 CELLULAR RESPONSE TO HYPOTHERMIA
It has become increasingly clear that the observed effects of hypothermia are not simply a passive result of reduced kinetic rates but rather are the result of an active response on the part of the cell to the cold shock (Fujita, 1999). Given the growth-arresting effect of low temperature on
mammalian cells, the cold shock response must interact with the cell cycle machinery in some way and evidence supporting this link is beginning to emerge, as will be discussed later. First, it is pertinent to review the key aspects of the cold shock in microorganisms, because, as is the case with heat shock, evidence exists showing that cold shock is conserved at some level from bacteria to mammals.
2.2.1 Prokaryotic Cold Shock Response
Bacteria have shown a remarkable ability to adapt to various temperatures, existing in subfreezing to 110 °C environments (Thieringer et al, 1998). The most extensive cold shock research has been conducted with Escherichia coli, which belongs to the psychrotroph species, composed of bacteria that grow optimally between 15 and 40 °C (Thieringer et al, 1998). In E.
coli, a reduction in temperature to the 8-15 °C range causes a transient inhibition of protein
synthesis and growth lag, after which growth resumes (Thieringer et al, 1998), albeit at a lower rate. It is during the lag period that the cold shock proteins are produced, after which they exert their effect on the cell and growth resumes. The currently accepted model for the events in the E. coli cold shock response (Thieringer et al, 1998) is shown in Figure 2-3 and described here.
Lower
Temperature
LEGEND:
normal mRNA cold shock protein mRNA(8
ribosome
cold shock protein cold-adapted ribosomeGrowth
Resumes
Figure 2-3. Model of the E. Coli Cold Shock Response. Under normal conditions, csp mRNA are rapidly degraded and no CSP are produced. Cold shock is sensed by the inactivation of ribosome function and consequent inhibition of protein synthesis and growth arrest. Simultaneously, csp mRNA stability is greatly enhanced. Only csp mRNA can still be translated by the inactivated ribosomes and CSP are synthesized. The CSP then stabilize the ribosome and normal protein synthesis and growth resumes. See text for details.
An abrupt decrease in temperature results in a temporary inhibition of protein synthesis (Jones and Inouye, 1996). The ribosome is composed of two subunits, termed 50S and 30S, which form the 70S ribosome. Several 70S ribosomes can bind to and translate a single mRNA
and the resulting structure of multiple ribosomes and one mRNA is called a polyribosome or simply a polysome (Alberts et al, 1994). When E. coli are shifted from 37 °C to 5-15 °C, there is a transient decrease in the number of polysomes and a transient increase in the number of 70S monomers and 50S / 30S subunits (Broeze et al, 1978; Jones and Inouye, 1996), showing that polysome structure is altered by the low temperature. This is the reason that overall translational efficiency is greatly compromised.
In this state, only mRNA encoding csp genes can be translated by the 70S ribosome (Thieringer et al, 1998). This trait is due to the presence of an extra ribosome-binding site called the downstream box (DB) in the coding region of the csp mRNA (Mitta et al, 1997). These mRNA are constitutively expressed in E. coli at normal growth temperature, but are highly unstable, meaning that they are degraded rapidly and consequently there is negligible protein production. At low temperature however, the stability is greatly improved and the mRNA are translated. The precise mechanism for the enhancement of csp mRNA stability remains unknown, but because mRNA degradation in E. coli is tightly coupled with the ribosome, it is possible that the instability of the polysomes and ribosomes at low temperature plays a role in the dramatic increase in mRNA stability (Py et al, 1996). Other hypothesized reasons for the enhanced stability include transcriptional attenuation and cold-induced changes in csp mRNA secondary structure, rendering them less susceptible to RNase (Thieringer et al, 1998).
The enhanced stability and presence of the DB sequence in the csp mRNA results in production of CSP under cold shock. At least three of these proteins then interact with the
ribosomal subunits, converting the nontranslatable ribosome into a cold-resistant translatable state (Jones and Inouye, 1996), and allowing normal protein synthesis and cell growth to ensue. In addition to ribosomal binding function, other CSPs have been implicated in various DNA and RNA binding functions and thus may function as molecular chaperones for more efficient DNA replication, RNA transcription and mRNA translation (Jiang et al, 1997; Thieringer et al, 1998).
A second facet of the prokaryotic cold shock response is a change in the composition of the cell membrane, known as homeoviscous adaptation. Membranes are normally in a liquid crystalline form but will undergo a transition to a gel phase when temperature is reduced (Thieringer et al, 1998). It is critical for the cell to maintain proper membrane form, so in order to compensate for the effect of low temperature on membrane fluidity, the microorganisms will change the degree of saturation of the hydrocarbon chains of the phospholipids that make up the membrane. Phospholipids with unsaturated fatty acids have lower melting points and a higher degree of flexibility and thus are favorable at low temperatures (Thieringer et al, 1998). Increasing unsaturation is accomplished in several different ways, such as increasing synthesis and stability of membrane-bound desaturase enzymes (Fulco and Fujii, 1980) and increasing the activity of synthase enzymes responsible for synthesizing unsaturated fatty acids (Garwin and Cronan, 1980; Garwin et al, 1980).
2.2.2 Eukaryotic Cold Shock Response - Analogy with Prokaryotes
The eukaryotic cold shock response is far less understood than that for prokaryotes. However, the two characteristics of cold shock adaptation in bacteria, namely protein synthesis adaptation and homeoviscous adaptation, are present in eukaryotes as well. The disruption of protein synthesis at reduced temperature that was discussed previously for bacteria also occurs in
eukaryotes. For example, in a variety of plants, there is evidence showing changes in ribosomal proteins (Bixby and Brown, 1975), polysome quantity, polymerization and melting points (Laroche and Hopkins, 1987) and polysome translation efficiency (Johnson-Flanagan and Singh, 1987) occur at low temperatures. Likewise, hibernating mammals demonstrate moderate ribosome disaggregation (Frerichs et al, 1998; Knight et al, 2000).
As one known case of protein synthesis adaptation to counter the ribosome disruption, levels of elongation factor 1 (EF1), a protein involved in translation, have been shown to increase significantly in the liver of cold-adapted fish (Nielson et al, 1977). EF1 is believed to help the cells overcome a reduction in protein synthesis immediately following a shift to lower temperatures. Higher EFI levels lead to higher rates of protein synthesis, suggesting that a new steady state level of enzymes may exist in response to cold shock (Nielson et al, 1977). Also, in the yeast S. cerivisae the cold-induced protein, NSR-1, has been shown to be involved in ribosome biogenesis (Kondo et al, 1992).
A recently identified mammalian cold-shock gene, RBM3, has been shown to have a cold-shock adaptation response with parallels to the prokaryotic csp genes. As discussed earlier, the prokaryotic csp genes contain DB sequences that allow for high-level translation during hypothermia. The 5' leader sequence of the RBM3 gene contains an internal ribosome entry site (IRES) that allows for cap-independent translation to occur. By unknown mechanisms, this IRES has up to 5-fold higher activity at 33 °C compared to 37 °C (Chappell et al, 2001). A striking feature of the RBM3 5' leader sequence is that it contains many complementary matches to 18S rRNA, leading to speculation that it plays a role in directly binding 40S ribosomal subunits by interacting with the 18S rRNA (Chappell et al, 2000). This suggests that internal
initiation of translation may be a key component of the cold shock response in mammals, allowing for high-level translation of certain proteins under hypothermic conditions.
The response of mammalian cells to extreme hypothermia appears to involve a near complete arrest of cellular activity, rather than adaptation for continued protein synthesis. For example, cells strongly suppress transcription (van Breukelen and Martin, 2002) but enhance mRNA stability (Knight et al, 2000), resulting in unchanged mRNA levels (Frerichs et al, 1998), and then also suppress protein synthesis (Frerichs et al, 1998; Knight et al, 2000). Even at the low temperatures of hibernation, suppressed protein synthesis is not merely a passive thermodynamic phenomenon, as seen by measuring synthesis rates in cell-free extracts from hibernating brain at 37 °C, which showed 3-fold reduction compared to extracts from non-hibernating brain (Frerichs et al, 1998). However, the fact that cell activity is negligible during extreme hypothermia means that this condition is probably not very useful for recombinant protein production, and therefore this thesis focused on mild hypothermia.
There are numerous examples to demonstrate that eukaryotic cells also undergo the second hallmark of the bacterial cold shock response, namely homeoviscous adaptation. For example, hibernating animals change their membrane composition in a variety of ways to control membrane fluidity (Aloia et al, 1974; Goldman, 1975). A striking example of the active nature of the cold response was demonstrated in carp fish, which show an eight to ten-fold increase in stearoyl coenzyme A desaturase activity after cold exposure (Tiku et al, 1996). Plants also exhibit increases in desaturase activities at lower temperatures (Nozawa and Kasai, 1978; Thompson and Nozawa, 1984). The need for homeoviscous adaptation is apparent in Arabidopsis, which require polyunsaturated lipids in the membrane to survive low temperature (Miguel et al, 1993). Homeoviscous adaptation also affects microsomal membranes, showing