HAL Id: hal-02921198
https://hal.archives-ouvertes.fr/hal-02921198
Submitted on 3 Dec 2020HAL is a multi-disciplinary open access archive for the deposit and dissemination of sci-entific research documents, whether they are pub-lished or not. The documents may come from teaching and research institutions in France or abroad, or from public or private research centers.
L’archive ouverte pluridisciplinaire HAL, est destinée au dépôt et à la diffusion de documents scientifiques de niveau recherche, publiés ou non, émanant des établissements d’enseignement et de recherche français ou étrangers, des laboratoires publics ou privés.
indicators of zooxanthellate jellyfishes: insights from an
experimental approach
Nicolas Djeghri, Herwig Stibor, Oanez Lebeau, Philippe Pondaven
To cite this version:
Nicolas Djeghri, Herwig Stibor, Oanez Lebeau, Philippe Pondaven. delta C-13, delta N-15, and C:N ratios as nutrition indicators of zooxanthellate jellyfishes: insights from an experimental ap-proach. Journal of Experimental Marine Biology and Ecology, Elsevier, 2020, 522, pp.151257. �10.1016/j.jembe.2019.151257�. �hal-02921198�
Please note that this is an author-produced PDF of an article accepted for publication following peer review. The definitive publisher-authenticated version is available on the publisher Web site.
Journal of Experimental Marine Biology and Ecology
January 2020, Volume 522 Pages 151257 (8p.)
https://doi.org/10.1016/j.jembe.2019.151257 https://archimer.ifremer.fr/doc/00591/70348/
Archimer
https://archimer.ifremer.fr
δ13C, δ15N, and C:N ratios as nutrition indicators of
zooxanthellate jellyfishes: insights from an experimental
approach
Djeghri Nicolas 1, * , Stibor Herwig 2, Lebeau Oanez 3, Pondaven Philippe 1
1 Université de Brest, UBO, Institut Universitaire Européen de la Mer, IUEM, Laboratoire des sciences
de l'Environnement Marin, UMR 6539 LEMAR, Technopôle Brest Iroise, Rue Dumont d'Urville, 29280 Plouzané, France
2 Ludwig-Maximilians-Universität München, Department Biologie II, Aquatische Ökologie, Großhaderner
Str. 2, 82152, Planegg, Martinsried, Germany
3 Université de Brest, UBO, Institut Universitaire Européen de la Mer, IUEM, UMS 3113, Technopôle
Brest Iroise, Rue Dumont d'Urville, 29280 Plouzané, France
* Corresponding author : Nicolas Djeghri, email address : nicolas.djeghri@univ-brest.fr
Abstract :
Some jellyfish host zooxanthellae in their tissues (mostly from the family Symbiodiniaceae; Dinophyceae) and supplement their heterotrophic nutrition with their symbiont's photosynthates. The mixotrophy of zooxanthellate jellyfishes (as holobionts) renders the study of their nutrition, growth, and population dynamics complicated. Here, we used an experimental approach to assess how carbon and nitrogen stable isotopes (δ13C and δ15N) as well as the elemental composition (C:N ratios) of zooxanthellate jellyfishes are affected by variations in nutrition sources: i. e. predation (heterotrophic) versus photosynthesis (autotrophic). Our laboratory experiment, conducted on the zooxanthellate jellyfish Cassiopea sp. medusae (including symbionts) in the presence or absence of light and prey during 24 days, showed conclusive results. Presence of light decreased δ15N, increased δ13C and C:N ratios, whereas presence of prey increased δ15N, and decreased δ13C and C:N ratios. The medusae incubated with both light and prey had intermediate δ15N, δ13C and C:N ratios. Variations in zooxanthellate jellyfishes' nutrition sources (autotrophy vs. heterotrophy) are thus reflected by their isotopic and elemental composition. By disentangling the effects of autotrophy and of heterotrophy on zooxanthellate jellyfish isotopic and elemental compositions, these results would help to interpret the values of δ13C, δ15N and C:N ratios that can be observed on these organisms in fieldwork studies.
Please note that this is an author-produced PDF of an article accepted for publication following peer review. The definitive publisher-authenticated version is available on the publisher Web site.
Highlights
► First experimental study on the effect of nutrition sources on δ13C, δ15N and C:N ratios in zooxanthellate
jellyfishes. ► δ13C values were higher in light. ► δ15N values were lower in light and higher with prey. ►
C:N ratios were higher in light and lower with prey. ► δ13C, δ15N and C:N ratios could be valuable
indicators of the nutrition of zooxanthellate jellyfishes in the field.
1. Introduction 31
Jellyfishes are increasingly acknowledged as an important component of marine ecosystems. Population 32
dynamics of the pelagic life stages are often characterized by important fluctuations with dramatic 33
biomass increases followed by sudden collapses (Lucas and Dawson 2014, Pitt et al. 2014). These 34
fluctuations can have important consequences for pelagic community dynamics and nutrient cycling (Pitt 35
et al. 2009a), or for human activities (Purcell et al. 2007). One of the key factors controlling jellyfish 36
population dynamics, is nutrition (e. g. Lucas and Dawson 2014, Pitt et al. 2014). One way to study 37
jellyfish nutrition is to use their stable isotopes signatures (mainly δ13C and δ15N, see Pitt et al. 2009b).
38
Many recent studies have focused on jellyfish stable isotopes and have provided precisions of their diets 39
as well as competition relationships (e. g. Fleming et al. 2015, Javidpour et al. 2016, Vansteenbrugge et 40
al. 2016, D’Ambra et al. 2018, Milisenda et al. 2018). Most of these studies have strictly focused on 41
heterotrophic jellyfishes. However, some jellyfishes are known to live in symbiosis with zooxanthellae. 42
Comparatively, the zooxanthellate jellyfishes have received less interest (see however Freeman et al. 43
2017, Zeman et al. 2018). 44
Zooxanthellate jellyfishes (mostly Rhizostomeae, Scyphozoa, see Djeghri et al. 2019) are characterized by 45
their photosymbiotic relationship with zooxanthellae (generally from the family Symbiodiniaceae, 46
Dinophyceae; LaJeunesse 2001, LaJeunesse et al. 2018). This symbiotic relationship is thought to be 47
similar to the one well known in corals with the zooxanthellae providing their host with photosynthates 48
while recycling the host’s respiration and excretion products (see Davy et al. 2012). In such symbiosis, 49
both carbon and nitrogen can be obtained via heterotrophy and autotrophy and are recycled between 50
the host and its zooxanthellae. Carbon dioxide (CO2) and nitrogen from host respiration and excretion
51
are used and metabolized by the zooxanthellae. Simultaneously, complex molecules (including 52
carbohydrates, lipids and amino acids) are transferred from one partner to the other (Davy et al. 2012). 53
Zooxanthellate jellyfishes, as holobionts (host + symbionts), are thus mixotrophs, deriving their nutrition 54
from both predation and zooxanthellae’s photosynthesis (Kremer 2005, Welsh et al. 2009). Generally, 55
the symbiosis provides most if not all of the carbon needed for respiration (Kremer et al. 1990, Kikinger 56
1992, McCloskey et al. 1994, Verde and McCloskey 1998) while predation is still needed to meet nitrogen 57
and phosphorus requirements (Kremer 2005, Welsh et al. 2009). However, the relative contribution to 58
nutrition of the predation versus the photosynthesis might be variable across species, populations, 59
environments, or during growth (see e. g. Sugiura 1969, McCloskey et al. 1994, Verde and McCloskey 60
1998, Bolton and Graham 2004, reviewed in Djeghri et al. 2019). Studies using stable isotopes, in this 61
context might be valuable tools to understand these variations. 62
Numerous studies on other photosymbiotic cnidarians (mainly corals), have shown that variations of 63
nutrition affect the isotopic and elemental composition (see e. g. Muscatine et al. 1989a, Muscatine and 64
Kaplan 1994, Alamaru et al. 2009, Reynaud et al. 2009, Pagès et al. 2011, reviewed by Ferrier-65
Pagès and Leal 2018). Similar effects can be expected in zooxanthellate jellyfishes. To date, only few 66
fieldwork studies have focused on the isotopic composition of zooxanthellate jellyfishes (see Freeman et 67
al. 2017, Zeman et al. 2018). The conclusions of these studies have, however, been limited due to the 68
lack of data on the interplay between autotrophy and heterotrophy of zooxanthellate jellyfishes as 69
reflected in their isotopic and elemental composition (Zeman et al. 2018). To better understand this, 70
controlled experiments are needed where the resources for heterotrophy (prey), and for autotrophy 71
(light) can be manipulated and their effect on stable isotopes signatures and elemental composition can 72
be assessed. In this study, we aim to provide experimental insights on how isotopic and elemental 73
composition of zooxanthellate jellyfishes are affected by different food regimes, and, more specifically, 74
by variations of the relative importance of autotrophy and heterotrophy. In order to achieve this, we 75
assessed the changes in the δ13C, δ15N, and C:N ratios in young specimens of zooxanthellate Cassiopea
76
sp. medusae (Scyphozoa: Rhizostomeae) over a period of 24 days and in the presence or absence of prey 77
and light. 78
79
2. Materials and Methods 80
2.1. Experimental set-up
81
Small specimens of Cassiopea sp. medusae (ca. 6 mm in bell diameter and 1 month old) were acquired 82
from the Trocadéro Aquarium (Paris, France). In this aquarium, the medusae were kept at 25 °C with a 83
daily light cycle, and were fed Artemia sp. nauplii twice a day. After their arrival to the laboratory the 84
medusae were acclimatized to local heated (25-26 °C) filtered (1 μm pore size) sea-water during one day. 85
In the following day, five medusae were randomly sampled to represent the initial state and then, the 86
experiment was set up. A total of 72 medusae specimens were individually placed in 75 ml glass flasks 87
filled with 50 mL of filtered sea-water. The flasks were then randomly assigned to one of the four 88
experimental treatments (18 medusae per treatment). The experimental treatments were as follows: (1) 89
fed and in light, (2) fed and in the dark, (3) starved and in light, and (4) starved and in the dark. The goal 90
of these different treatments was to target respectively: mixotrophy, heterotrophy, and autotrophy, the 91
fourth treatment being a control. The flasks containing the medusae were kept in water baths, which 92
regulated a fixed temperature (25-26 °C). Two water baths were used, one for the medusae kept in light, 93
and the other for the medusae kept in the dark. The temperature changed little during the experiment 94
and between the two water baths (25.6 ± 0.4 °C and 25.3 ± 0.4 °C respectively in the lighted and 95
darkened water baths; mean ± s.d.). The light was provided by a fluorescent lamp on a 12:12 hours 96
day:night cycle at an intensity of ca. 110 µmol photons.m-2.s-1. Food consisted of 2 h of feeding ad libitum
97
every two days on Artemia sp. young nauplii (< 24 h after hatching). The medusae full guts and numerous 98
remaining prey in the flasks confirmed a proper ad libitum feeding. Every two days, and after the 99
feeding, the incubation water of the medusae was entirely changed. During the latter process, the flasks 100
were also washed to prevent fouling. 101
Every four days, and before the feeding (ensuring empty guts), three medusae were randomly sampled 102
from each treatment. Thus the sampling occurred at the following days: 4, 8, 12, 16, 20 and 24; plus the 103
initial state being represented by the five medusae sampled before setting the treatments. 104
105
2.2. Processing of medusae
106
Immediately after sampling, presence and physiological state of the symbionts were assessed. For this 107
purpose, the medusae were put in the dark for at least 20 minutes allowing the opening of the 108
photosystem reactive centers of zooxanthellae. The photosynthetic parameters of the zooxanthellae 109
were assessed by pulse amplitude modulatory (PAM) fluorometry using the “OJIP protocol” of an 110
AquaPen-C-AP-C100 (®Photon Systems Instruments, PSI, Brno, Czech Republic), at a 450 nm excitation 111
wavelength. This protocol measures the fluorescence emitted after a flash of saturating light. This yields 112
the estimation of several variables among which the maximum photosystem II quantum yield (Fv/Fm),
113
which is a proxy of the photosystem II efficiency. With Fm the maximum fluorescence under saturating
114
light, and Fv = Fm - F0 with F0 the initial fluorescence (Strasser et al. 2000). The measures were performed
115
on whole medusae specimens. Prior to the measurement, it was ensured that the medusae were settled 116
at the cuvette bottom to insure proper exposition to the saturating flash. Additionally, along each 117
medusae measure, a blank was realized by using the “OJIP protocol” on incubation water without 118
medusae (75 blanks total). 119
Preparation for elemental and isotopic analysis started first by quickly rinsing the medusae in deionized 120
water in order to remove the sea salt. The whole medusae were then placed in pre-weighted tin capsules 121
(10.5 × 9 mm EMAL technology, United Kingdom) and oven-dried at 60 °C for ca. 48 h. After drying, the 122
tin capsules containing the medusae were locked and weighted again to obtain the medusae dry mass, 123
which varied between 0.2 and 3.2 mg (0.9 ± 0.6 mg; mean ± s.d.). In the preparation procedure, the 124
medusae were unpreserved before the isotopic analysis, following the recommendations of Fleming et 125
al. (2011). Due to the small size of the medusae specimens, it was not possible in this experiment to 126
follow the recommendations of MacKenzie et al. (2017) by dissecting, washing and rubbing the mesoglea 127
before conservation. In addition, due to their small size, it was not possible to separate the animal tissue 128
from the zooxanthellae. This would have resulted to acquiring an insufficient biomass for the isotopic 129
analysis. Thus, the results presented here are measures on the holobiont (animal host + zooxanthellae). 130
131
2.3. Processing of prey nauplii
132
In order to assess the isotopic and elemental composition of the Artemia sp. nauplii given as food for the 133
medusae, we sampled them two times during the experiment (at days 8 and 14) plus a sampling at day 134
28, slightly after the end of the experiment (protocol unchanged). At each sampling, concentrated 135
nauplii were divided in five aliquots, and oven-dried at 60 °C for ca. 48 h in clean glass flasks. The dried 136
nauplii were then scratched from the flasks and ground into a powder. Finally, between 0.5 and 1.5 mg 137
of the powder were inserted and locked in tin capsules (10.5 × 9 mm EMAL technology, United 138
Kingdom). 139
140
2.4. Elemental and stable isotopes composition
141
The analyses of medusae and nauplii samples were performed using an Elemental analyzer (Thermo 142
Scientific EA Flash 2000), coupled to a Mass Spectrometer (Thermo Scientific DELTA V Plus) at the Stable 143
Isotopes Laboratory of the “Pôle Spectrométrie Océan” (PSO-IUEM, Plouzané, France). The nitrogen and 144
carbon mass of medusae samples ranged respectively from 15 to 109 µgN (35 ± 22 µgN; mean ± s.d.) and 145
from 60 to 543 µgC (175 ± 120 µgC; mean ± s.d.). As the whole medusae were inserted in the tin 146
capsules, these values are representative of their total weights. The nitrogen and carbon mass of nauplii 147
samples ranged respectively from 40 to 105 µgN (64 ± 18 µgN; mean ± s.d.) and from 200 to 522 µgC 148
(326 ± 90 µgC; mean ± s.d.). The samples were calibrated for mass bias using casein (IVA-33802155, 149
Analysentechnik, Germany) as the elemental standard (range: 5-108 µgN; 16-377 µgC). Some material-150
rich samples were automatically diluted during the analysis process (Thermo Scientific ConFlo IV). 151
Stable isotopes values are expressed as permil (‰) using the δ notation (normalized to Vienna Pee Dee 152
Belemnite and atmospheric N2 for respectively carbon and nitrogen):
153 δX = (Xsample H X sample L ⁄ XstdH ⁄XstdL − 1) × 1000 154
With X the element measured, XH the amount of the heavy isotope and XL the amount of the light
155
isotope from the samples (Xsample) and the standard (Xstd).
156
As some of our samples had a low (< 20 µgN) nitrogen mass, we analyzed five replicates of casein 157
standards with a low nitrogen mass (13.4 ± 1.9 µgN; mean ± s.d.) to check whether this low mass have 158
led to uncertainties in our measures. We found only a low variability on the obtained δ15N measures
159
(0.04 ‰ s.d., n=5) indicating that our measures were consistent even at low biomass levels. 160
Unless indicated otherwise, all C:N ratios are expressed by mass (following Ikeda 2014 and Molina-161
Ramírez et al. 2015). As the C:N ratios of both the medusae and their prey were higher than 3.5, a 162
normalization of the δ13C for lipid content was advisable (Post et al. 2007). For the nauplii, we used the
163
general normalization for aquatic animals given by Post et al. (2007) and for the medusae, we used the 164
normalization specific to scyphozoans proposed by D’Ambra et al. (2014). For comparison, raw data is 165
still presented as supplementary material (see discussion). 166
167
2.5. Statistics
168
The data collected during the experiment (carbon masses, δ13C, δ15N, C:N ratios and F
v/Fm) were
169
analyzed using linear mixed-effects models (LME) (e. g. Crawley 2012). The presence or absence of prey 170
and light were considered as fixed effects while time was considered as random effect. Model 171
assumptions (mean of residuals = 0, linearity and normality) were checked using model-checking plots. If 172
the model assumptions were not met, the data were log transformed. If the fixed effects affected 173
significantly the results (if p-value < 0.05), subsequent Tukey post-hoc tests were performed on least-174
square means (i. e. means adjusted for the effect of time) to assess which combination of the fixed 175
effects (light and prey) led to different responses. 176
One-way ANOVAs were used to assess possible variations in prey δ13C, δ15N, and C:N ratios over time.
177
Normality and homoscedasticity assumptions were checked using the Shapiro-Wilk normality test and 178
Bartlett homogeneity of variance test (threshold: α = 0.05). If the assumptions were not met, the data 179
were Box-Cox transformed. All statistical analyses were performed in R (R Core Team 2017). 180
181
3. Results 182
3.1. Mass variation in medusae
183
The carbon mass of the medusae (Fig. 1) was significantly affected by light alone (LME, t-value = 7.5, p-184
value < 0.001) and by the interaction between light and prey (LME, t-value = 3.4, p-value < 0.01). At the 185
beginning of the experiment, the carbon mass of Cassiopea sp. medusae was of 115.1 ± 27.0 µg C (mean 186
± s.d.). Only the carbon mass of the medusae in the treatment with both light and prey did noticeably 187
increased, reaching 449.3 ± 68.2 µg C (mean ± s.d.) at the end of the experiment. The carbon mass of the 188
medusae in the treatment with only light did not increased significantly reaching a carbon mass value of 189
133.9 ± 27.9 µg C (mean ± s.d.) at the end of the experiment. The carbon mass values of the medusae in 190
the treatments with only prey or without resources tended to decrease, dropping to respectively 88.0 ± 191
26.1 µg C and 71.1 ± 15.7 µg C (mean ± s.d.) at the end of the experiment. In the treatment without 192
resources, one medusae specimen died. Thus for this treatment, there remained two replicates instead 193
of three at day 24. 194
Fig. 1. (A) Changes in the Cassiopea sp. medusae carbon mass (µg C) (means ± s.e.m.) over the course of 196
the experiment as a function of the experimental conditions. (B) Comparison of least-square means 197
obtained from each treatment (± 95 % C. I.). The letters (a, b, and c) indicate statistically different 198
treatments (Tukey post hoc test, p-value < 0.05). 199
200
3.2. δ13C and δ15N
201
The medusae δ13C values (Fig. 2 A, B) were significantly affected by light (LME, t-value = 22.5, p-value <
202
0.001) and by the interaction of light and prey (LME, t-value = -6.2, p-value < 0.001). At the beginning of 203
the experiment δ13C values of the medusae were of -18.7 ± 0.9 ‰ (mean ± s.d.). In the treatment with
204
both light and prey the δ13C values of the medusae increased quickly (in less than four days) reaching ca.
205
-15 ‰. This trend was even more pronounced in the treatment with only light were the δ13C values of
206
the medusae reached ca. -13 ‰. Conversely, in the treatments with only prey or without resources the 207
δ13C values of the medusae remained similar or decreased slightly throughout the experiment (generally
208
comprised between -19 ‰ and -21 ‰). It should be noted that the distinction between the medusae 209
from the treatments with light alone and with light and prey is not as distinct with data not normalized 210
for lipids (Fig. S1). 211
The medusae δ15N values (Fig. 2 C, D) were significantly affected by both light (LME, t-value = -8.7,
p-212
value < 0.001) and prey (LME, t-value = 2.2, p-value < 0.05), but not by their interaction. At the beginning 213
of the experiment, the δ15N values of medusae was of 8.9 ± 1.1 ‰ (mean ± s.d.). These values decreased
214
slightly in the treatment with light and prey reaching 8.0 ± 0.3 ‰ (mean ± s.d.) at the end of the 215
experiment. The decrease was more pronounced in the treatment with light only which reached 5.5 ± 216
0.4 ‰ at the end of the experiment. Finally, δ15N values did not change in the treatments with only prey
217
or without resources (values at the end of the experiment of 9.0 ± 0.3 ‰ and 8.8 ± 1.0 ‰ respectively; 218
mean ± s.d.). 219
220
The δ13C and δ15N obtained in Artemia sp. nauplii prey did not vary significantly during the experiment
221
(ANOVAs, p-values > 0.05) averaging respectively -19.4 ± 0.2 ‰ and 10.7 ± 0.5 ‰ (mean ± s.d.) (Fig. 2 A, 222
C). 223
3.3. C:N ratios
225
The C:N ratios obtained in the medusae (Fig. 3) were significantly affected by light (LME, t-value = 27.5, 226
p-value < 0.001) and by the interaction of light and prey (LME, t-value = -6.6, p-value < 0.001). At the 227
beginning of the experiment, the C:N ratios of medusae were of 4.5 ± 0.1. These values increased in the 228
treatment with both light and prey (4.8 ± 0.1 at the end of experiment; mean ± s.d.). A similar, but more 229
pronounced increased was seen in the C:N ratios of the medusae exposed to only light (5.9 ± 0.2 at the 230
end of experiment; mean ± s.d.). By opposition, C:N ratios decreased slightly in the treatments with only 231
prey or without resources (respectively reaching 4.1 ± 0.1 and 3.9 ± 0.1 at the end of the experiment; 232
mean ± s.d.). 233
Fig. 2. Changes in the Cassiopea sp. medusae δ13C (‰) (A) and δ15N (‰) (C) (means ± s.e.m.) over the
235
course of the experiment as a function of the experimental conditions. Solid and dashed blue lines 236
represent the mean ± s.d. of the isotopic signatures of Artemia sp. nauplii used as prey in fed treatments. 237
(B and D) Comparison of least-square means obtained for each treatment (± 95 % C. I.). The letters (a, b, 238
and c) indicate statistically different treatments (Tukey post hoc test, p-value < 0.05). δ13C values of have
239
been normalized for lipid content according to Post et al. (2007) for nauplii, and D’Ambra et al. (2014) for 240
Cassiopea sp. medusae.
241
242
243
Fig. 3. (A) Changes in the Cassiopea sp. medusae mass C:N ratios (means ± s.e.m.) over the course of the 244
experiment as a function of the experimental conditions. The blue error bar indicate the range of C:N 245
ratios in nauplii prey measured in the course of the experiment (see text). (B) Comparison of the least-246
square means obtained for each treatment (± 95 % C. I.). The letters (a, b, and c) indicate statistically 247
different treatments (Tukey post hoc test, p-value < 0.05). 248
249
The C:N ratios obtained in Artemia sp. nauplii did vary significantly during the experiment (ANOVA, F = 250
25.9, p-value < 0.001). However, these variations were of small amplitudes (minimum: 4.97, maximum: 251
5.20) compared to the variationsobserved in Cassiopea sp. medusae following the different experimental 252
treatments (Fig. 3 A). Therefore, these small variations of the C:N ratios of the prey are unlikely to have 253
significantly affected the outcome of the experiment. Throughout the experiment, C:N ratios in Artemia 254
sp. nauplii averaged 5.1 ± 0.1 (mean ± s.d.). 255
256
3.4. PAM parameters of zooxanthellae
257
The blanks always yielded low values of F0 (90 ± 9; mean ± s.e.m.) as compared to the F0 values of the
258
medusae (5270 ± 630; mean ± s.e.m.). This equates to a signal-to-noise ratio of ca. 60, which is sufficient 259
to have a reliable estimate of photosynthetic activity. Two outliers were removed from the medusae’s 260
PAM data (Fv/Fm below 0.4, similar to a blank, most likely due to a lack of exposition of the medusae to
261
the saturating flash). With the exception of this two outliers, the Fv/Fm of medusae remained very stable
262
in all conditions and during the whole experiment averaging an overall value of 0.70 ± 0.06 (mean ± s.d.; 263
Fig. S2). The LME models did not indicate any effect of presence or absence of prey and light on the 264
zooxanthellae Fv/Fm. Independently of this lack of effect of the experimental treatments on PAM
265
parameters (discussed in Supplementary Material 2), high F0 values as compared to the blanks
266
demonstrate the presence of zooxanthellae in the Cassiopea sp. medusae in all treatments and during 267
the whole experiment. 268 269 4. Discussion 270 271 4.1. Isotopic composition 272
In this study, the δ13C values obtained in the medusae were the highest in the treatment with light only,
273
lowest in the treatments with only prey and without resources, and intermediate in the treatment with 274
both prey and light (Fig. 2A, B). Similar effects of heterotrophic feeding on δ13C values have been
275
reported for corals (e. g. Reynaud et al. 2002, Ferrier-Pagès et al. 2011). As in this study, the δ13C of the
276
predator tended towards the δ13C of the prey when fed. However, some caution should be taken when
277
interpreting the results of this study concerning the effects of heterotrophic feeding on zooxanthellate 278
jellyfish’s δ13C. Indeed, it is unsure that the lipid normalization used here can be applied to a
279
photosymbiotic holobiont as it has been derived from the heterotrophic Aurelia sp. (D’Ambra et al. 280
2014). Without this normalization, the effect of heterotrophic feeding on δ13C is less clear (Fig. S1). Thus,
281
albeit an effect of heterotrophic feeding on zooxanthellate jellyfishes’ δ13C is likely, our results should be
taken with caution regarding this point. In contrast, light had a clear positive effect on δ13C of
283
zooxanthellate jellyfishes whether the normalization for lipid content is made or not (Fig. 2A, B; Fig. S1). 284
These conclusions are consistent with the previous findings on corals (e. g. Muscatine et al. 1989a, Swart 285
et al. 2005, Alamaru et al. 2009, Ferrier-Pagès et al. 2011). 286
In the experiment, δ15N values were the lowest in the medusae exposed to only light, compared to the
287
other treatments (Fig. 2C, D). This is different from what is known in tropical scleractinian corals in which 288
photosynthesis tend to increase, or have little effect on δ15N rather than decrease it, like seen here (see
289
Muscatine and Kaplan 1994, Alamaru et al. 2009, Reynaud et al. 2009). Our results are more comparable 290
to what is observed in more heterotrophic temperate corals (Ferrier-Pagès et al. 2011). The treatment 291
with no resources and the treatment with only prey presented the same δ15N (Fig. 2C, D). However, the
292
effect of predation is clear as the δ15N values in the treatment with prey and light were intermediate
293
between those of the treatment with only light, and the treatment with only prey (Fig. 2C, D). The 294
similitude between the treatment without resources and the treatment with only prey would thus be 295
explained by the initial condition (i. e. at day 0, medusae already had high δ15N). Thus, overall, predation
296
would have led to higher δ15N of medusae (Fig. 2C, D). Interestingly however, the δ15N values in medusae
297
were never higher than those obtained on prey (Fig. 2C), which suggests that no measurable 298
fractionation occurred between the holobiont and their prey. This is most likely due to high recycling of 299
nitrogen between the host and its symbionts (see also Reynaud et al. 2009). 300
301
These patterns seen in δ13C and δ15N can be explained through two main processes affecting stable
302
isotopes signatures in photosymbiotic organisms (reviewed in Ferrier-Pagès and Leal 2018): 303
The first process is the mixing of carbon or nitrogen coming from two contrasted sources; 304
autotrophic uptake of dissolved inorganic nutrients, on one hand, and heterotrophic predation—mainly 305
on zooplankton—on the other hand (Reynaud et al. 2002, Alamaru et al. 2009, Ferrier-Pagès et al. 2011, 306
Ferrier-Pagès and Leal 2018). The uptake of dissolved inorganic carbon by zooxanthellae generally leads 307
to higher δ13C values (typically -10 ‰ to -14 ‰) than those of typical oceanic particulate organic matter
308
and plankton (ca. -20 ‰; Muscatine et al. 1989a, Ferrier-Pagès et al. 2011, Ferrier-Pagès and Leal 2018). 309
Thus, δ13C values obtained through zooxanthellae’s autotrophy would be higher than those obtained
310
through predation on zooplankton (Fig. 4A). For nitrogen, the pattern is reversed; zooxanthellae take up 311
dissolved inorganic nitrogen with a low δ15N value (ca. 5 ‰ Ferrier-Pagès and Leal 2018) while predation
312
leads the uptake of nitrogen with higher δ15N values due to fractionation through the food web (Post
2002, Ferrier-Pagès et al. 2011, Ferrier-Pagès and Leal 2018, Fig. 4B). For both carbon and nitrogen, the 314
isotopic signature of the two sources (inorganic nutrient uptake, and predation) is then exchanged and 315
recycled between the zooxanthellae and the host (e. g. Reynaud et al. 2009). 316
The second process involves the depletion of in-hospite nutrient pools due to photosynthesis. 317
Zooxanthellae tend to take up preferentially inorganic nutrients with light isotopes resulting in 318
fractionation (Ferrier-Pagès and Leal 2018). However, at high photosynthesis rates, the host’s pool of 319
inorganic nutrients can get depleted. Thus, to meet their photosynthetic requirements, zooxanthellae 320
take up more heavy isotopes, reducing fractionation (“depletion-diffusion hypothesis”, see Muscatine et 321
al. 1989a, Fig. 4A and B). This results in a tendency for isotopic signature to correlate with 322
photosynthesis levels. The higher the photosynthesis, the higher the δ13C (Muscatine et al. 1989a, Swart
323
et al. 2005, Alamaru et al. 2009) or the δ15N values (Muscatine and Kaplan 1994, Baker et al. 2011;
324
reviewed in Ferrier-Pagès and Leal 2018). 325
It is important to notice that these two processes—mixing of the heterotrophic and autotrophic sources, 326
and reduced fractionation at high photosynthesis levels—would have similar consequences on δ13C, but
327
not on δ15N. For δ13C, a predominantly autotrophic nutrition would imply a decreased fractionation
in-328
hospite due to high photosynthesis and a predominant uptake of dissolved inorganic nutrients. Both of
329
these processes result in high δ13C (and vice-versa for a predominantly heterotrophic nutrition, Fig. 4A).
330
By opposition, for δ15N, reduced fractionation due to high photosynthesis levels would result in high
331
δ15N, but high uptake of dissolved inorganic nutrients would result in low δ15N (and vice-versa for a
332
predominantly heterotrophic nutrition, Fig. 4B). Thus, to understand how δ15N would react to change in
333
holobiont nutrition, it is important to know which of the above-mentioned processes controls its 334
dynamics. 335
336
337
In the context of this study, the increase in δ13C due to light, could be explained by both increased
338
uptake of CO2 and reduced fractionation at higher photosynthesis (and conversely in the dark, Fig. 4A).
339
The results obtain on δ15N values in this study, suggest that, in zooxanthellate jellyfishes, of the two
340
processes above-mentioned—mixing of autotrophic and heterotrophic sources, and reduced 341
fractionation at high photosynthesis—the former is the dominant one (Fig. 4B). Hence, in zooxanthellate 342
jellyfishes, a predominantly autotrophic nutrition would imply that most nitrogen comes from the 343
fixation of dissolved inorganic nitrogen (see e. g. Muscatine and Marian 1982, Wilkerson and Kremer 344
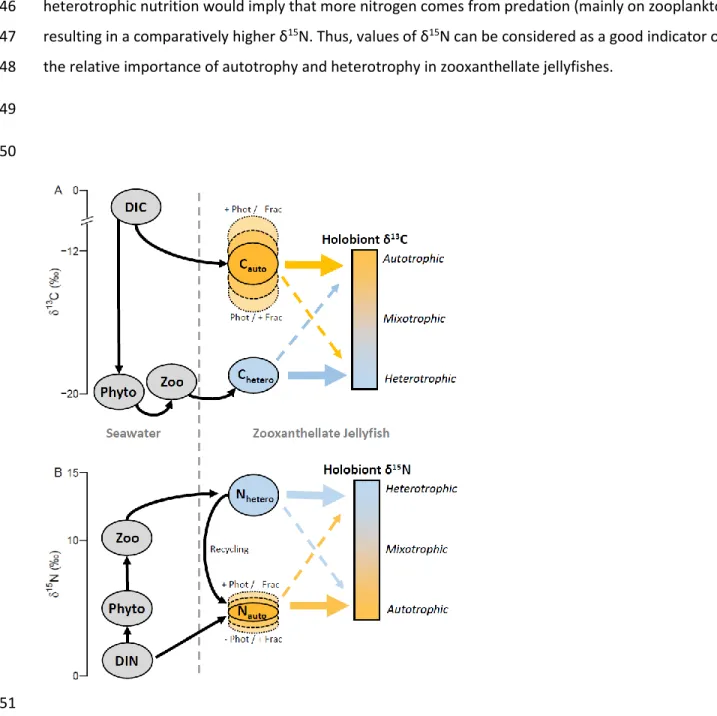
1992, Freeman et al. 2016), and would result in low δ15N. On the contrary, a predominantly
345
heterotrophic nutrition would imply that more nitrogen comes from predation (mainly on zooplankton) 346
resulting in a comparatively higher δ15N. Thus, values of δ15N can be considered as a good indicator of
347
the relative importance of autotrophy and heterotrophy in zooxanthellate jellyfishes. 348
349
350
351
Fig. 4. Conceptual diagram illustrating how δ13C (A) and δ15N (B) are affected by the relative importance
352
of heterotrophic (blue circles and arrows, Chetero and Nhetero) and autotrophic (orange circles and arrows,
353
Cauto and Nauto) nutrition pathways in zooxanthellate jellyfishes. DIC = dissolved inorganic carbon, DIN =
354
dissolved inorganic nitrogen, Phyto = phytoplankton, Zoo = zooplankton, Phot = photosynthesis, Frac = 355
fractionation (more photosynthesis tend to decrease fractionation, this effect, in zooxanthellate 356
jellyfishes, is unlikely to be significant for nitrogen, see text). Values on the axes are provided for 357
illustrative purpose only. See also Ferrier-Pagès and Leal (2018). 358
359
4.2. C:N ratios
360
In our experiment, light increased C:N ratios of the Cassiopea sp. holobionts whereas prey generally 361
decreased it, with intermediate C:N ratios in the treatment with both light and prey (Fig. 3A, B). As with 362
δ15N, C:N ratios of the treatment with no resources and with prey only were similar. This similarity may
363
be again explained by the initial condition. Another potential explanation would be that starved 364
zooxanthellate jellyfishes use first reserves accumulated by photosynthesis (generally carbon rich, e. g. 365
Muller-Parker et al. 1996). Such preferential degradation would make their C:N ratios decrease and get 366
similar to the ones typically reported for non-zooxanthellate jellyfishes (Ikeda 2014, Molina-Ramírez et 367
al. 2015). Independently of the treatment with no resources, our results suggest that predation would 368
tend to decrease C:N ratios (Fig. 3A, B). Such a decrease of C:N ratios due to predation have already 369
been reported for the zooxanthellae of a sea anemone (Cook et al. 1988). However, other studies have 370
pointed out that a similar decrease of C:N ratios can also be due to an enrichment by dissolved inorganic 371
nitrogen (e. g. Muscatine et al. 1989b, Belda et al. 1993). As zooxanthellate jellyfishes are able to take up 372
dissolved inorganic nutrients via their symbionts (see e. g. Muscatine and Marian 1982, Wilkerson and 373
Kremer 1992, Pitt et al. 2005, Welsh et al. 2009, Freeman et al. 2016, see Pitt et al. 2009a for a review), it 374
is likely that their C:N ratios would react to nutrient enrichment too. This suggests that C:N ratios of 375
zooxanthellate jellyfishes might be impacted by nitrogen availability (either as prey or as dissolved 376
inorganic nitrogen). 377
378
4.3. Remarks on tissue turnover
379
One of the advantages of the study of the elemental and isotopic composition over e.g. gut content 380
analyses, is that it provides a more time-integrated information (Pitt et al. 2009b). The time frame 381
represented by isotopic composition is, however, dependent on tissue turnover which can be variable as 382
function of, e. g. taxonomy, organ, body size, or temperature (Thomas and Crowther 2015, Vander 383
Zanden et al. 2015). In another scyphozoan jellyfish, Aurelia sp., the isotopic half-life was determined to 384
be ca. 10 days for both carbon and nitrogen (D’Ambra et al. 2014). In the present experiment, changes of 385
δ13C and C:N ratios occurred very fast (within the first four days, Figs. 2A, 3). This was apparently less
true for the δ15N values which may have experienced slower changes (Fig. 2B). These fast changes may
387
have several explanations: First, the medusae used here were of small size and, additionally, some of 388
them grew (Fig. 1, see also Supplementary Material 2) which can explain the fast changes (Fry and Arnold 389
1982, Thomas and Crowther 2015, Vander Zanden et al. 2015). In its natural environment, Cassiopea sp. 390
can grow up to ca. 20-25 cm in bell diameter (see e. g. Morandini et al. 2017). It is unlikely that such large 391
specimens would display such fast change in composition. Another aspect that could explain the fast 392
change in elemental and isotopic composition observed here, is that Cassiopea sp. is zooxanthellate. The 393
zooxanthellae are also likely to impact residence time of elements within the holobiont, possibly 394
differently for nitrogen and carbon, due to recycling (Reynaud et al. 2009). 395
396
4.4. Implications for fieldwork studies
397
One of the challenges to understand the nutrition of zooxanthellate jellyfishes in their natural 398
environments relates to their mixotrophy. As zooxanthellate jellyfishes obtain their nutrition from 399
predation and photosynthesis (Kremer 2005, Welsh et al. 2009), both processes must be investigated. 400
Ideally, predation, photosynthesis, respiration, nutrient uptake and excretion have all to be measured 401
which may represent an intensive amount of work rarely carried out in its entirety (see however, Kremer 402
et al. 1990, Kremer 2005). Studies of stable isotopes and elemental composition are comparatively easier 403
and have the advantage of providing more time-integrated information (Pitt et al. 2009b). The findings of 404
this study provide baseline information on how C:N ratios, δ13C and δ15N can be interpreted in fieldwork
405
studies focusing on the nutrition sources of zooxanthellate jellyfishes. 406
To summarize, our results suggest that both δ13C and δ15N vary with the relative balance of autotrophy
407
vs. heterotrophy (although, the effect of heterotrophy on δ13C is less well supported by our results). It
408
would be expected that, if dominantly heterotrophic, zooxanthellate jellyfishes would have δ15N values
409
close to those of their prey (see e. g. Zeman et al. 2018). By opposition, if dominantly autotrophic, 410
zooxanthellate jellyfishes would have δ15N values close (or lower) than those of primary producers (see
411
e. g. Freeman et al. 2017). The δ13C values would display opposite trends. Finally, C:N ratios may be
412
indicators of the efficiency of nitrogen supplies. Future fieldwork studies would be able to build on these 413
results to better characterize zooxanthellate jellyfishes’ nutrition. 414
415
Funding 416
This work is part of the Ph.D. research program of ND, funded by the Université de Bretagne Occidentale 417
(UBO, Brest, France). This work was also supported by the Labex Mer (ANR-10-LABX-19-01, IUEM, Brest, 418 France). 419 420 Acknowledgements 421
The authors would like to thank Eric Dabas, Leslie Gager and William Handal for providing technical 422
assistance during the experiments. We also thank Gauthier Schaal and Rudolph Corvaisier for their 423
valuable comments on the first version of this manuscript. Finally, we wish to thank two anonymous 424
reviewers for their helpful comments. 425
426
References 427
1. Alamaru, A., Loya, Y., Brokovich, E., Yam, R., Shemesh, A., 2009. Carbon and nitrogen utilization 428
in two species of Red Sea corals along a depth gradient: Insights from stable isotope analysis of 429
total organic material and lipids. Geochim. Cosmochim. Acta 73, 5333-5342. 430
2. Baker, D.M., Kim, K., Andras, J.P., Sparks, J.P., 2011. Light-mediated 15N fractionation in
431
Caribbean gorganian octocorals: implications for pollution monitoring. Coral Reefs 30, 709-717. 432
3. Belda, C.A., Lucas, J.S., Yellowlees, D., 1993. Nutrient limitation in the giant clam-zooxanthellae 433
symbiosis: effects of nutrient supplements on growth of the symbiotic partners. Mar. Biol. 117, 434
655-664. 435
4. Brodeur, R.D., Sugisaki, H., Hunt Jr., G.L., 2002. Increases in jellyfish biomass in the Bering Sea: 436
implications for the ecosystem. Mar. Ecol. Prog. Ser. 233, 89-103. 437
5. Bolton, T.F., Graham, W.M., 2004. Morphological variation among populations of an invasive 438
jellyfish. Mar. Ecol. Prog. Ser. 278, 125–139. 439
6. Cook, C.B., D’Elia, C.F., Muller-Parker, G., 1988. Host feeding and nutrient sufficiency for 440
zooxanthellae in the sea anemone Aiptasia pallida. Mar. Biol. 98, 253-262. 441
7. Crawley, M.J.,2012. The R book. John Wiley & Sons. 442
8. D’Ambra, I., Carmichael, R.H., Graham, W.M., 2014. Determination of δ13C and δ15N and trophic
443
fractionation in jellyfish: implications for food web ecology. Mar. Biol. 161(2), 473-480. 444
9. D'Ambra, I., Graham, W.M., Carmichael, R.H., Hernandez Jr., F.J., 2018. Dietary overlap between 445
jellyfish and forage fish in the northern Gulf of Mexico. Mar. Ecol. Prog. Ser. 587, 31-40. 446
10. Davy, S.K., Allemand, D., Weis, V.M., 2012. Cell biology of Cnidarian-Dinoflagellate symbiosis. 447
Microbiol. Mol. Biol. R. 76(2), 229-261. 448
11. Djeghri, N., Pondaven, P., Stibor, H., Dawson, M.N., 2019. Review of the diversity, traits, and 449
ecology of zooxanthellate jellyfishes. Mar. Biol. 166,147. 450
12. Ferrier-Pagès, C., Leal, M.C., 2018. Stable isotopes as tracers of trophic interactions in marine 451
mutualistic symbioses. Ecol. Evol. 9, 723-740. 452
13. Ferrier-Pagès, C., Peirano, A., Abbate, M., Cocito, S., Negri, A., Rottier, C., Riera, P., Rodolfo-453
Metalpa, R., Reynaud, S., 2011. Summer autotrophy and winter heterotrophy in the temperate 454
symbiotic coral Cladocora caespitosa. Limnol. Oceanogr. 56(4), 1429-1438. 455
14. Fleming, N.E.C., Houghton, J.D.R., Magill, C.L., Harrod, C., 2011. Preservation methods alter 456
stable isotope values in gelatinous zooplankton: implications for interpreting trophic ecology. 457
Mar. Biol. 158, 2141-2146. 458
15. Fleming, N.E.C., Harrod, C., Newton, J., Houghton, J.D.R., 2015. Not all jellyfish are equal: isotopic 459
evidence for inter- and intraspecific variation in jellyfish trophic ecology. PeerJ 3, e1110. 460
16. Freeman, C.J., Stoner, E.W., Easson, C.G., Matterson, K.O., Baker, D.M., 2016. Symbiont carbon 461
and nitrogen assimilation in the Cassiopea-Symbiodinium mutualism. Mar. Ecol. Prog. Ser. 544, 462
281-286. 463
17. Freeman, C.J., Stoner, E.W., Easson, C.G., Matterson, K.O., Baker, D.M., 2017. Variation in δ13C
464
and δ15N values suggests a coupling of host and symbiont metabolism in the
Symbiodinium-465
Cassiopea mutualism. Mar. Ecol. Prog. Ser. 571, 245-251.
466
18. Fry, B., Arnold, C., 1982. Rapid 13C/12C turnover during growth of brown shrimp (Penaeus
467
aztecus). Oecologia, 54(2), 200-204.
468
19. Ikeda, T.,2014. Synthesis toward a global model of metabolism and chemical composition of 469
medusae and ctenophores. J. Exp. Mar. Biol. Ecol. 456, 50-64. 470
20. Javidpour, J., Cipriano-Maack, A.N., Mittermayr, A., Dierking, J.,2016. Temporal dietary shift in 471
jellyfish revealed by stable isotope analysis. Mar. Biol. 163, 112. 472
21. Kikinger, R. 1992. Cotylorhiza tuberculata (Cnidaria: Scyphozoa) – Life history of a stationary 473
population. Mar. Ecol. 13(4), 333-362. 474
22. Kremer, P., 2005. Ingestion and elemental budgets for Linuche unguiculata, a scyphomedusa 475
with zooxanthellae. J. Mar. Biol. Assoc. UK 85, 613-625. 476
23. Kremer, P., Costello, J., Kremer, J., Canino, M. 1990. Significance of photosynthetic 477
endosymbionts to the carbon budget of the schyphomedusa Linuche unguiculata. Limnol. 478
Oceanogr. 35(3), 609-624. 479
24. LaJeunesse, T.C., 2001. Investigating the biodiversity, ecology, and phylogeny of endosymbiotic 480
dinoflagellates in the genus Symbiodinium using the ITS region: in search of a "species" level 481
marker. J. Phycol. 37, 866-880. 482
25. LaJeunesse, T.C., Parkinson, J.E., Gabrielson, P.W., Jeong, H.J., Reimer, J.D., Voolstra, C.R., Santos, 483
S.R., 2018. Systematic revision of Symbiodiniaceae highlights the antiquity and diversity of coral 484
endosymbionts. Curr. Biol. 28, 2570-2580. 485
26. Lucas, C.H., Dawson, M.N. 2014. What are jellyfish and Thaliaceans and why do they bloom?, in: 486
Pitt, K.A., Lucas, C.H. (Eds.), Jellyfish blooms. Springer, Dordrecht, pp. 9-44. 487
27. MacKenzie, K.M., Trueman, C.N., Lucas, C.H., Bortoluzzi, J., 2017. The preparation of jellyfish for 488
stable isotope analysis. Mar. Biol. 164, 219. 489
28. McCloskey, L.R., Muscatine, L., Wilkerson, F.P., 1994. Daily photosynthesis, respiration, and 490
carbon budgets in a tropical marine jellyfish (Mastigias sp.). Mar. Biol. 119, 13-22. 491
29. Milisenda, G., Rossi, S., Vizzini, S., Fuentes, V., Purcell, J.E., Tilves, U., Piraino, S., 2018. Seasonal 492
variability of diet and trophic level of the gelatinous predator Pelagia noctiluca (Scyphozoa). Sci. 493
Rep.-U.K. 8, 12140. 494
30. Molina-Ramírez, A., Cáceres, C., Romero-Romero, S., Bueno, J., González-Gordillo, J.I., Irigoien, 495
X., Sostres, J., Bode, A., Monpeán, C., Fernández Puelles, M., Echevarria, F., Duarte, C.M., Acuña, 496
J.L. 2015. Functional differences in the allometry of the water, carbon and nitrogen content of 497
gelatinous organisms. J. Plankton Res. 37(5), 989-1000. 498
31. Morandini, A.C., Stampar, S.N., Maronna, M.M., Silveira, F.L. da 2017. All non-indigenous species 499
were introduced recently? The case study of Cassiopea (Cnidaria: Scyphozoa) in Brazilian waters. 500
J. Mar. Biol. Assoc. U.K. 97, 321-328. 501
32. Muller-Parker, G., Lee, K.W., Cook, C.B., 1996. Changes in the ultrastructure of symbiotic 502
zooxanthellae (Symbiodinium sp., Dinophyceae) in fed and starved sea anemones maintained 503
under high and low light. J. Phycol. 32:987-994. 504
33. Muscatine, L., Marian R.E., 1982. Dissolved inorganic nitrogen flux in symbiotic and nonsymbiotic 505
medusae. Limnol. Oceanogr. 27(5), 910-917. 506
34. Muscatine, L., Kaplan, I.R., 1994. Resource partitioning by reef corals as determined from stable 507
isotope composition II. δ15N of zooxanthellae and animal tissue versus depth. Pac. Sci. 48(3),
304-508
312. 509
35. Muscatine, L., Porter, J.W., Kaplan, I.R., 1989a. Resource partitioning by reef corals as 510
determined from stable isotope composition I. δ13C of zooxanthellae and animal tissue versus
511
depth. Mar. Biol. 100, 185-193. 512
36. Muscatine, L., Falkowski, P.G., Dubinsky, Z., Cook, P.A., McCloskey, L.R., 1989b. The effect of 513
external nutrient resources on the population dynamics of zooxanthellae in a reef coral. Proc. R. 514
Soc. London B 236, 311-324. 515
37. Pitt, K.A., Koop, K., Rissik, D., 2005. Contrasting contributions to inorganic nutrient recycling by 516
the co-occuring jellyfishes, Catostylus mosaicus and Phyllorhiza punctata (Scyphozoa, 517
Rhizostomeae). J. Exp. Mar. Biol. Ecol. 315, 71-86. 518
38. Pitt, K.A., Welsh, D.T., Condon, R.H., 2009a. Influence of jellyfish blooms on carbon, nitrogen and 519
phosphorus cycling and plankton production. Hydrobiologia 616, 133-149. 520
39. Pitt, K.A., Connolly, R.M., Meziane, T., 2009b. Stable isotope and fatty acid tracers in energy and 521
nutrient studies of jellyfish: a review. Hydrobiologia 616, 119-132. 522
40. Pitt, K.A., Budarf, A.C., Browne, J.G., Condon, R.H., 2014. Bloom and bust: Why do blooms of 523
jellyfish collapse? In: Pitt, K.A., Lucas, C.H. (Eds.), Jellyfish blooms. Springer, Netherlands, pp. 79-524
103. 525
41. Post, D.M., 2002. Using stable isotopes to estimate trophic position: models, methods, and 526
assumptions. Ecology 83, 703-718. 527
42. Post, D.M., Layman, C.A., Arrington, D.A., Takimoto, G., Quattrochi, J., Montaña, C.G., 2007. 528
Getting to the fat of the matter: models, methods and assumptions for dealing with lipids in 529
stable isotopes analyses. Oecologia 152, 179-189. 530
43. Purcell, J.E., Uye, S.-I., Lo, W.-T., 2007. Anthropogenic causes of jellyfish blooms and direct 531
consequences for humans: a review. Mar. Ecol. Prog. Ser. 350, 153-174. 532
44. R Core Team, 2017. R: A language and environment for statistical computing. R Foundation for 533
392 Statistical Computing, Vienna, Austria. https://www.R-project.org/. 534
45. Reynaud, S., Ferrier-Pagès, C., Sambrotto, R., Juillet-Leclerc, A., Jaubert, J., Gattuso, J.-P., 2002. 535
Effect of feeding on the carbon and oxygen isotopic composition in the tissues and skeleton of 536
the zooxanthellate coral Stylophora pistillata. Mar. Ecol. Prog. Ser. 238, 81-89. 537
46. Reynaud, S., Martinez, P., Houlbrèque, F., Billy, I., Allemand, D., Ferrier-Pagès, C., 2009. Effect of 538
light and feeding on the nitrogen isotopic composition of a zooxanthellate coral: role of nitrogen 539
recycling. Mar. Ecol. Prog. Ser. 392, 103-110. 540
47. Strasser, R.J., Srivastava, A., Tsimilli-Michael, M., 2000. The fluorescence transient as a tool to 541
characterize and screen photosynthetic samples. in: Yunus, M., Pathre, U., Mohanty, P. (Eds.), 542
Probing Photosynthesis: Mechanism, Regulation and Adaptation. Taylor and Francis, U.K., pp. 543
445-483. 544
48. Sugiura, Y., 1969. On the life-history of Rhizostome medusae V. On the relation between 545
zooxanthellae and the strobilation of Cephea cephea. Bull. Mar. Biol. Stn. Asamushi 8(3), 227-546
233. 547
49. Swart, P.K., Saied, A., Lamb, K., 2005. Temporal and spatial variation in the δ15N and δ13C of coral
548
tissue and zooxanthellae in Montastraea faveolata collected from the Florida reef tract. Limnol. 549
Oceanogr. 50, 1049-1058. 550
50. Thomas, S.M., Crowther T.W., 2015. Predicting rates of isotopic turnover across the animal 551
kingdom: a synthesis of existing data. J. Anim. Ecol. 84,861-870. 552
51. Vander Zanden, M.J., Clayton, M.K., Moody, E.K., Solomon, C.T., Weidel, B.C., 2015. Stable 553
isotopes turnover and half-life in animal tissues: a literature synthesis. PLoSONE, 10(1), 554
e0116182. 555
52. Vansteenbrugge, L., Hostens, K., Vanhove, B., De Backer, A., De Clippele, L., De Troch, M., 2016. 556
Trophic ecology of Mnemiopsis leidyi in the southern North Sea: a biomarker approach. Mar. 557
Biol. 163, 25. 558
53. Verde, E.A., McCloskey, L.R., 1998. Production, respiration, and photophysiology of the 559
mangrove jellyfish Cassiopea xamachana symbiotic with zooxanthellae: effect of jellyfish size and 560
season. Mar. Ecol. Prog. Ser. 168, 147-162. 561
54. Welsh, D.T., Dunn, R.J.K., Meziane, T., 2009. Oxygen and nutrient dynamics of the upside down 562
jellyfish (Cassiopea sp.) and its influence on benthic nutrient exchanges and primary production. 563
Hydrobiologia 635, 351-362. 564
55. Wilkerson, F.P., Kremer, P., 1992. DIN, DON and PO4 flux by medusa with algal symbionts. Mar.
565
Ecol. Prog. Ser. 90, 237-250. 566
56. Zeman, S.M., Corrales-Ugalde, M., Brodeur, R.D., Sutherland, K.R., 2018. Trophic ecology of the 567
neustonic cnidarian Velella velella in the northern California Current during an extensive bloom 568
year: insight from gut contents and stable isotope analysis. Mar. Biol. 165, 120. 569
Supplementary Material 1: Raw δ13C
570
571
Fig. S1. (A) Changes in the Cassiopea sp. medusae δ13C (‰) without normalization for lipids (means ±
572
s.e.m.) over the course of the experiment as a function of the experimental conditions. Solid and dashed 573
blue lines represent the mean ± s.d. of the isotopic signatures of Artemia sp. nauplii used as prey in fed 574
treatments. (B) Comparison of least-square means obtained for each treatment (± 95 % C. I.). The letters 575
(a and b) indicate statistically different treatments (Tukey post hoc test, p-value < 0.05). 576
577
Supplementary Material 2: Notes on growth of medusae and PAM parameters 578
Medusae grew only in the treatment with both light and prey (i. e. increase in carbon mass of the 579
holobiont, Fig. 1 in main text; and increase in medusae bell diameter from ca. 6 mm to 8-10 mm, data 580
not shown). The absence of carbon mass increase (Fig. 1 in main text) in the other treatments confirmed 581
previous findings stipulating that both predation and zooxanthellae’s photosynthates are necessary for 582
some zooxanthellate jellyfishes (Kremer 2005, Welsh et al. 2009). The Fv/Fm ratio can be used as a proxy
583
of photosynthetic organism’s performance (e. g. Strasser et al. 2000, Long et al. 2018), and was 584
constantly high (0.70, higher or equal to values typically reported for coral zooxanthellae: e. g. Iglesias-585
Prieto et al. 2004, Roth et al. 2012) in our experiment, independently of treatments (Fig. S2). The 586
absence of decreasing Fv/Fm ratio in the treatments kept in the dark, suggests that zooxanthellae within
587
their Cassiopea sp. host stayed photochemically competent for several days without light. We 588
hypothesize that, in such conditions, as their nutrition can only be provided by the host (e. g. in the form 589
of fatty acids; Imbs et al. 2014), zooxanthellae were heterotrophic (see Steen 1986, Jeong et al. 2012). 590
591
592
Fig. S2. Fv/Fm ratios of the whole Cassiopea sp. medusae (including symbionts) over the course of the
593
experiment and as a function of the experimental treatments (means ± s.e.m.). The dotted line 594
represents the mean of all points. 595
596
References 597
1. Iglesias-Prieto, R., Beltrán, V.H., LaJeunesse, T.C., Reyes-Bonilla, H., Thomé, P.E., 2004. Different 598
algal symbionts explain the vertical distribution of dominant reef corals in the eastern Pacific. 599
Proc. R. Soc. Lond. B 271, 1757-1763. 600
2. Imbs, A.B., Yakovleva, I.M., Dautova, T.N., Bui, L.H., Jones, P., 2014. Diversity of fatty acid 601
composition of symbiotic dinoflagellates in corals: evidence for the transfer of host PUFAs to the 602
symbionts. Phytochemistry 101, 76-82. 603
3. Jeong, H.J., Yoo, Y.D., Kang, N.S., Lim, A.S., Seong, K.A., Lee, S.Y., Lee, M.J., Lee, K.H., Kim, H.S., 604
Shin, W., Nam, S.W., Yih, W., Lee, K., 2012. Heterotrophic feeding as a newly identified survival 605
strategy of the dinoflagellate Symbiodinium. P. Natl. Acad. Sci. USA 109(31), 12604-12609. 606
4. Kremer, P., 2005. Ingestion and elemental budgets for Linuche unguiculata, a scyphomedusa 607
with zooxanthellae. J. Mar. Biol. Assoc. UK 85, 613-625. 608
5. Long, M., Tallec, K., Soudant, P., Lambert, C., Le Grand, F., Sarthou, G., Jolley, D., Hégaret, H., 609
2018. A rapid quantitative fluorescence-based bioassay to study allelochemical interactions from 610
Alexandrium minutum. Environ. Pollut. 242, 1598-1605.
6. Roth, M.S., Goericke, R., Deheyn, D.D., 2012. Cold induces acute stress but heat is ultimately 612
more deleterious for the reef-building coral Acropora yongei. Sci. Rep. 2, 240. 613
7. Steen, R.G., 1986. Evidence for heterotrophy by zooxanthellae in symbiosis with Aiptasia 614
pulchella. Biol. Bull. 170, 267-278.
615
8. Strasser, R.J., Srivastava, A., Tsimilli-Michael, M., 2000. The fluorescence transient as a tool to 616
characterize and screen photosynthetic samples. in: Yunus, M., Pathre, U., Mohanty, P. (Eds.), 617
Probing Photosynthesis: Mechanism, Regulation and Adaptation. Taylor and Francis, U.K., pp. 618
445-483. 619
9. Welsh, D.T., Dunn, R.J.K., Meziane, T., 2009. Oxygen and nutrient dynamics of the upside down 620
jellyfish (Cassiopea sp.) and its influence on benthic nutrient exchanges and primary production. 621
Hydrobiologia 635, 351-362. 622