HAL Id: inserm-00119104
https://www.hal.inserm.fr/inserm-00119104
Submitted on 4 Sep 2009HAL is a multi-disciplinary open access
archive for the deposit and dissemination of sci-entific research documents, whether they are pub-lished or not. The documents may come from teaching and research institutions in France or abroad, or from public or private research centers.
L’archive ouverte pluridisciplinaire HAL, est destinée au dépôt et à la diffusion de documents scientifiques de niveau recherche, publiés ou non, émanant des établissements d’enseignement et de recherche français ou étrangers, des laboratoires publics ou privés.
Strategy for Detecting Susceptibility Genes with Weak
or No Marginal Effect.
Salma Kotti, Heike Bickeböller, Françoise Clerget-Darpoux
To cite this version:
Salma Kotti, Heike Bickeböller, Françoise Clerget-Darpoux. Strategy for Detecting Susceptibil-ity Genes with Weak or No Marginal Effect.. Human HeredSusceptibil-ity, Karger, 2007, 63 (2), pp.85-92. �10.1159/000099180�. �inserm-00119104�
Strategy for detecting susceptibility genes with weak or no marginal effect S. Kotti 1,2,3 , H. Bickeböller 4 and F. Clerget-Darpoux 1,2,3
1 Inserm U535, Villejuif, France 2 University of Paris 11, France 3 IFR69, Villejuif, France
4 Department of Genetic Epidemiology, Medical School, University of Göttingen, Göttingen,
Germany
Dr Françoise Clerget-Darpoux
INSERM U535 : Génétique Epidémiologique et Structure des Populations Humaines Hôpital Paul Brousse BP 1000
94817 Villejuif Cedex Tel. (+33) 1 45 59 53 63 Fax. (+33) 1 45 59 53 31 E-mail : [email protected]
Abstract
Most human diseases result from complex interactions among multiple genes that yield weak or modest effects. Despite the growing awareness of the importance of gene–gene
interactions, the paradigm of detectable effects of individual variants remains the cornerstone of genome association studies with tagSNPs. The interactive effect of two variants is only tested once the individual effect of one variant is detected. Both genes however, may have at the same time a weak (or even no) marginal effect but an important effect through their interaction. In such a situation, current approaches may fail to detect variants having a crucial role in the causal chain.
Here, we propose a new strategy: the 2-locus TDT. It allows the detection of the involvement of two genes without individual effect. Our strategy simultaneously uses information on biallelic candidate polymorphisms in two genes M and N. We first estimate the relative marginal penetrances of the genotype at each locus and of the joint (two-locus) genotype and then we test for the interactive effect of the two genes using a likelihood ratio test.
We show that our approach has good power to detect the effect of two genes in situations for which a locus-by-locus strategy would have been unsuccessful. At a time where genome-wide association studies are fashionable, we think it is important to consider the strategy of
studying good candidate pathways with our approach. Key Words
Introduction
Most human diseases result from complex interactions among multiple genes that yield weak or modest effects and various environmental factors. Despite the growing awareness of the importance of gene–gene interactions, the paradigm of detectable effects of individual variants remains the cornerstone of genome association studies with tagSNPs. Most current research focuses on the development of new statistical methods with the aim of identifying the role that interactions may play in the determinism of complex diseases.
Despite the fact that the concept of gene-gene interactions is not new, this term can be used in several different ways.
Biological interaction, also referred as biological epistasis, was first reported by Bateson [1]. It can be explained by physical interactions of proteins between each other or with their target and their impact on the phenotype. In fact, a large number of protein-protein interactions (such as protein kinases, glycosyl transferases, protein phosphatases, etc., with their protein substrates) are involved in and/or regulate a large number of cellular processes, i.e. cell growth, cell cycle, metabolic pathways and signal transduction.
These interactions can be conceptualized as a network where proteins are represented by nodes and connect with each other through edges representing their physical interactions. The architecture of such a network is quite complex because of the high degree of
interconnectedness (functional and structural relationships) that may exist amongstits nodes. This definition of biological epistasis contrasts the statistical concept used by Fisher [2]. Initially, Fisher used the term “epistacy” to refer to the component of phenotypic variance not accounted for by additive, dominance, or environmental variances. This term swiftly became epistasis. The correspondencebetween the two concepts is not obvious.
When one trait is controlled by two genes, traditional statistical methods generally proceed in a first step by testing the individual effect of each gene and then when the main effect of one gene is established, they test for the interactive effect.
Among these methods is the logistic regression framework [3-5]. This approach is based on a logit function in which the probability of disease is “a function of the genotypes at the two loci and of epistatic interactions between them” [5].
Another method used in such a context is the Conditional Transmission Disequilibrium Test (Conditional TDT) [6] which tests, conditionally on one gene, the effect of a second gene and their interaction.
By the use of these methods, interactions have been tested in autism [7], obesity in children and adolescents [8], myocardial infarction [9], type 1 diabetes [10], asthma [11], multiple sclerosis [12], and other diseases. In all these examples, the main effect of each gene was established first.
According to Templeton [13] and then to Moore [14], epistasis is an ubiquitous component of the genetic architecture of common human diseases and complex interactions may be
important while the individual gene effects are weak. Therefore, interactions have been recognized as highly important. However it has become progressively clear that existing strategies are inadequate to test for gene-gene interactions in such situations and may fail to detect variants having a crucial role in the causal chain. Thus, new statistical and
computational methods are needed.
In this paper, we propose a new method applied in the context of studying two candidate genes in the same pathway: the 2-locus TDT. Using the attractive property of the classical TDT of robustness to population stratification [15], we provide a strategy for detecting susceptibility genes with weak or no marginal effect.
The 2-locus model
We consider two candidate biallelic intragenic markers M and N of two genes belonging to the same pathway. M and N can either be unlinked or linked with a recombination fraction θ
but without linkage disequilibrium between their alleles.
First, weintroduce some notation. In the following, let the alleles of marker locus M be denoted m1 and m2 and those of N be denoted n1 and n2. Let pm1, pm2, pn1 and pn 2 be the allele
frequencies of m1, m2, n1 and n2, respectively.
There are nine possible genotypes for the two markers M and N. Thus, we have nine possible penetrances which correspond to the probability of being affected given that the person has the marker genotypes mxmy nznw where mx, myand nz, nw are the alleles inherited from the
two parents at the loci M and N, respectively. Subscripts x, y, z, w can be either 1or 2. We denote the corresponding probabilities P(affected | mxmy nznw) by f xyzw.
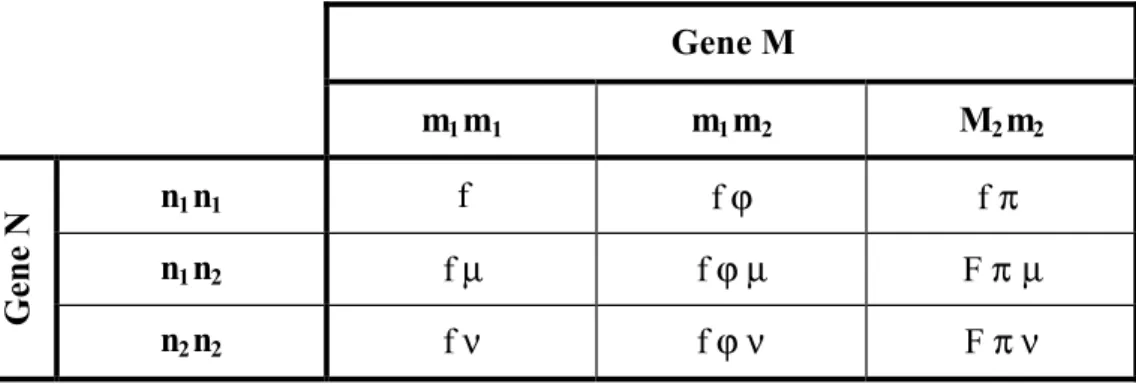
The penetrances are shown in the following 3 × 3 matrix (table 1). We assume that we do not distinguish between the alleles transmitted from the father and those from the mother.
We denote the marginal penetrances P(affected | mxmy) and P(affected | nznw) at the loci M
and N by fxy • and f•zw, respectively.
Regarding the penetrance matrices, we can distinguish between two models:
− The general model MG (called also saturated model) whose corresponding parameters may
have any possible value. This model contains 9 parameters as shown in table 1;
− A model without interaction between the two genes MR (restricted model). In this case, the
columns and the lines are proportional. This model includes only 5 parameters which are denoted by f (the penetrance for one 2-locus genotype) and the proportionality factors
The 2-locus TDT for testing gene-gene interaction
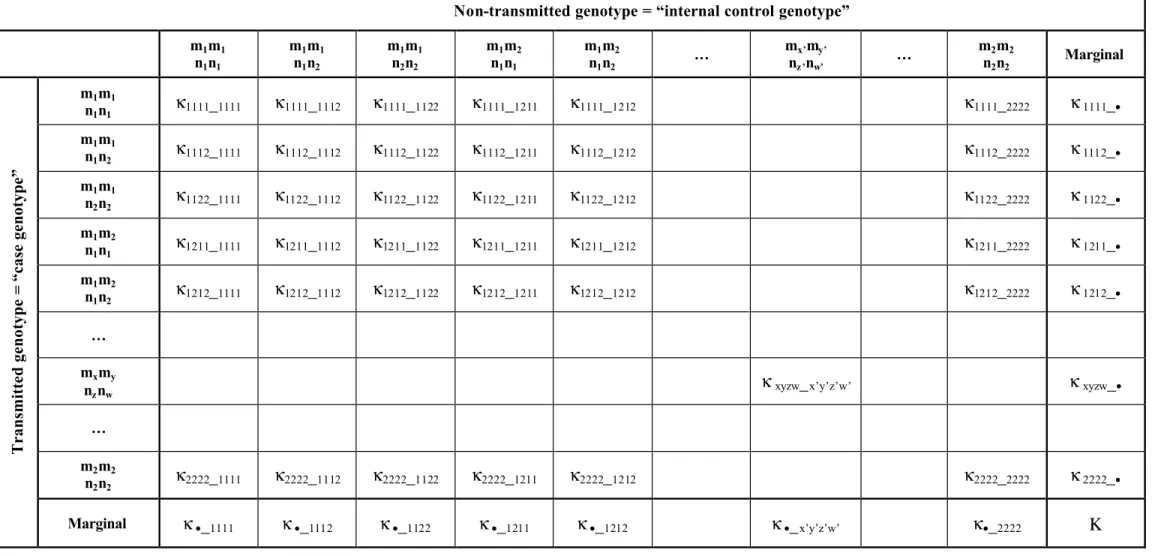
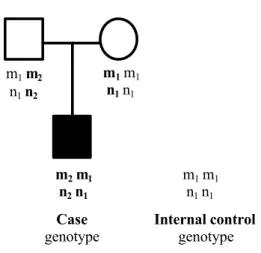
We consider a trio data set genotyped for the two candidate markers M and N in two genes. Let us assume that there are Κ independent families, each having two parents and one affected child. We denote as the “case genotype” the genotype formed by the two gametes transmitted from the parents to the affected offspring. The two non-transmitted gametes form the “internal control genotype” as shown in figure 1.
For two biallelic loci, transmitted and non-transmitted gametes may be summarized in a 9 × 9 contingency table (table 3). The κ xyzw_x’y’z’w’ are the number of cases where mx, myand nz,
nw are the alleles transmitted to the affected offspring from the two parents at the loci M and
N, respectively and mx’, my’and nz’, nw’ are the alleles non-transmitted from the two parents
at the loci M and N, respectively. Subscripts x, y, z, w, x’, y’, z’ and w’ can be either 1 or 2. The row and column totals for transmitted and non-transmitted genotypes are denoted by
κ xyzw_• and κ•_x’y’z’w’,respectively.
The diagonal elements of the contingency table correspond to homozygous parents at the two genes (double homozygote).
Testing the absence of interaction between the two genes is equivalent to showing that the data may be explained as well by a restricted model MR (5 parameters) as under a general
model MG (9 parameters). Since MR is nested in MG, the 2-locus TDT may be carried out by a
maximum likelihood ratio test:
G G R R L L LRT max max ln 2 − =
where LG =L(f xyzw | κ xyzw_• and κ•_ x’y’z’w’) and LR = L(f, µ, ν, ϕ, π | κ xyzw_• and κ•_ x’y’z’w’) are
appendix A. The parameters of the restricted and general models are estimated by their Maximum Likelihood Estimator (MLE).
Under the null hypothesis, this likelihood ratio test follows a chi-square distribution with 4 degrees of freedom (df), the difference in the number of parameters between the two models. Power of the 2-locus TDT when testing interaction under different models
We perform the power study of the 2-locus TDT by formal computation and thus will present asymptotic results. Under the alternative hypothesis of interaction, the 2-locus TDT statistic follows a non-central chi-square distribution for which we can calculate for a given specific alternative MG* the non-centrality parameter λ and the power for a given type I error and
sample size Κ. Details of the calculation are given in the appendix B.
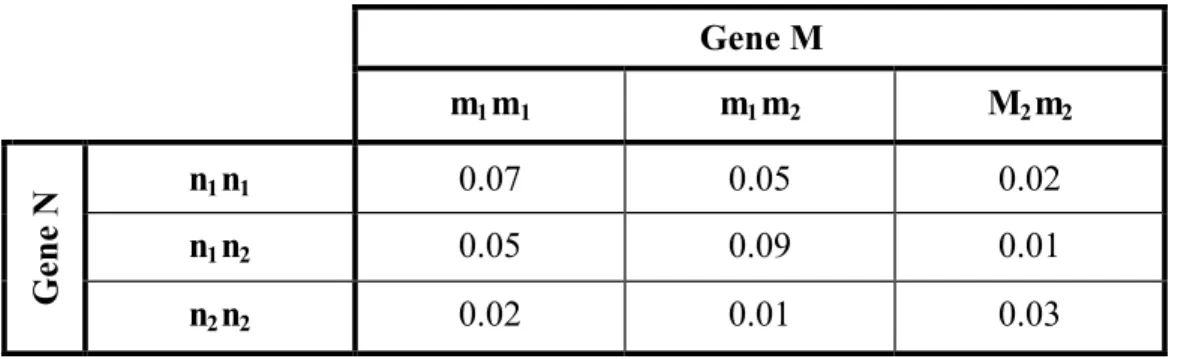
We calculate the power of the 2-locus TDT when testing the interaction of two biallelic candidate genes assuming Hardy-Weinberg equilibrium and no population stratification under different situations (models 1A, 1B, 1C and 2). The models 1A, 1B and 1C are defined by the same penetrance matrix in table 4. The difference lies in the allele frequency pm1 at the locus
M. Model 2 is defined by the penetrance matrix in table 5.
− Model 1
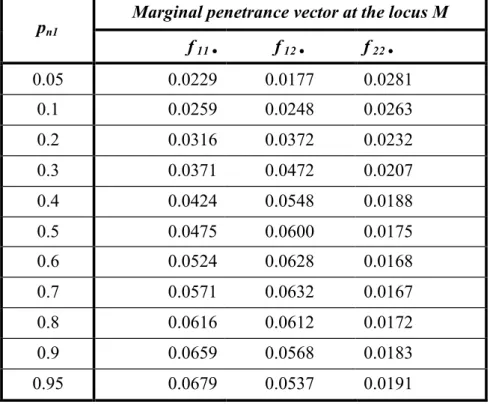
Using the penetrance matrix in table 4, we may calculate the marginal penetrances according to the formulae (1) and (2) given in the appendix B. The marginal penetrances at one locus depend on the joint genotype penetrances and the allele frequencies of the other locus.
Marginal penetrance vectors of the locus M (corresponding to the genotypes m1m1
,
m1m2 andm2m2
)
are given in table 6 for different values of pn1.Power results are given in figures 2A, 2B and 2C for pm1 equals to 0.1, 0.5 and 0.8,
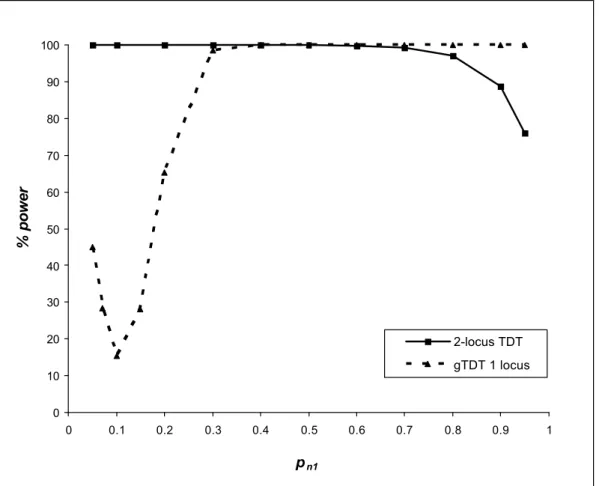
§ Model 1A: pm1 = 0.1
Under the model 1A, we obtain the following marginal penetrance vector at the locus N: [0.0259, 0.0248, 0.0263]. The effect of the gene N is very weak.
When pn1 is varying from 0.1 to 0.3, both genes M and N have weak effects. Therefore, they
are unlikely to be detectedby traditional methods. When pn 1 ≥ 0.4, the model 1A shows
however, a strong individual effect of the gene M.
Figure 2A shows the power of the 2-locus TDT to detect the interaction between the two genes M and N. With a sample size Κ = 100 and a type-1 error at 5%, we show that our test is overall powerful. The power is greater than 80% for pn1 between 0.05 and 0.9. The maximum
power is attained when pn1 = 0.2 where the non-centrality parameter λ is maximal.
The detection of the interaction applying the 2-locus TDT indirectly implies the detection of both gene effects. We compare the detection of gene M effect by the 2-locus TDT and by the genotypic Transmission Disequilibrium Test (gTDT) [16].
Figure 2A shows that in the situation of a weak marginal effect of the gene M (see marginal penetrances in table 6 when pn1 ≤ 0.3), the 2-locus TDT is more powerful than the gTDT for
detecting the effect of this gene. However, when the gene M has a strong effect (see marginal penetrances in table 6 when pn1 ≥ 0.4), the gTDT is powerful for detecting the effect of this
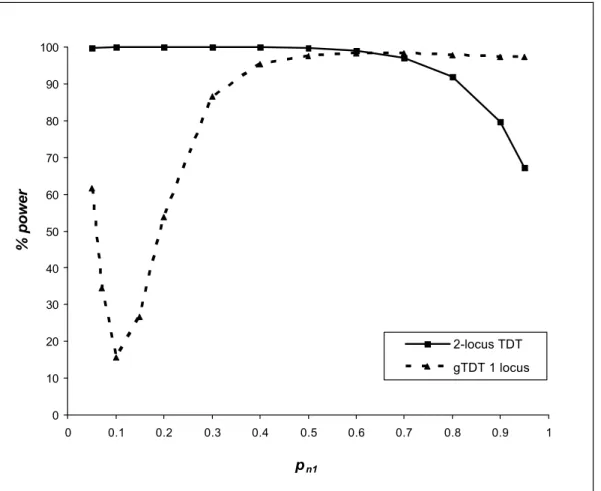
gene but does not detect the effect of the gene N nor their interaction. § Model 1B: pm1 = 0.5
Under this model, the gene N has an evident effect with a marginal penetrance vector = [0.0475, 0.0600, 0.0175].
Figure 2B shows the same general shape than figure 2A for detecting the interaction between the genes M and N by the 2-locus TDT. We also have similar conclusion when we compare the power for detecting the effect of the gene M by the 2-locus TDT or by the gTDT.
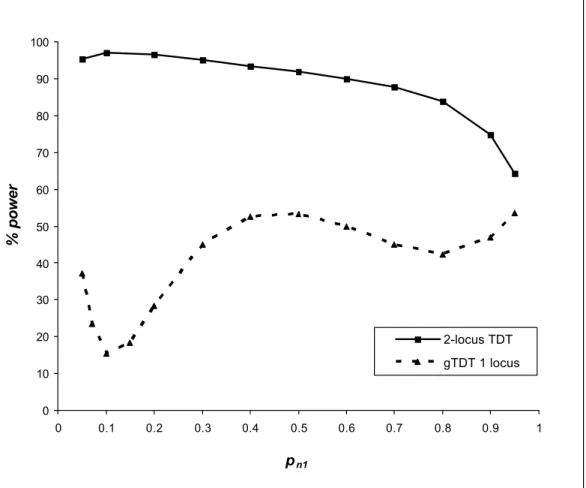
§ Model 1C - pm1 = 0.8
Under this model we obtain the following marginal penetrance vector for the gene N [0.0616, 0.0612, 0.0172]. The gene N has an evident effect.
In the figure 2C, the power for detecting the interactive effect of the two genes M and N applying the 2-locus TDT is greater than 80% for pn1 ≤ 0.8 and with a sample size Κ = 100
and a type-1 error at 5%.
Besides, the power for detecting the effect of the gene M applying the gTDT doesn’t exceed 60% whatever the value of pn 1. Under this model, the 2-locus TDT is more powerful for
detecting the effect of this gene (through the interactive effect) than the gTDT.
Thus, in the model 1, we show that our method is powerful for detecting the interaction between two genes. In addition, applying the 2-locus TDT, we may indirectly detect with a moderate sample size the effect of both genes (through their interaction) which are not individually detectable by usual approach like the gTDT.
− Model 2 - an example of no marginal effect: (table 5)
This model, initially described by Li and Reich [17], is the most frequently given to exhibit two-locus (or even multi-locus) genetic effects in the absence of any independent main effect. Therefore, when allele frequencies are equal (pm1 = pn1 = 0.5) and genotypes are consistent
with Hardy Weinberg proportions, we obtain a two-locus purely epistatic model. It is for this allele frequency that the 2-locus TDT has maximum power.
For Κ = 100, the non-centrality parameter λ is equal to 100, which corresponds to a high level of power (99 %). Applying the gTDT, the individual effect of each gene cannot be detected, whereas our method detects the effect of the two genes with a high power.
Discussion
In complex diseases, the trait may occur only if a particular pattern of genes is present at different susceptibility loci, and not as a result of a single disease gene alone. In this case, each single susceptibility gene may have only a small effect and may not be detected easily applying locus by locus methods. Usual methods commonly test first for individual gene effect. Once an individual effect has been evidenced, they then test for the interactive effect. Consequently, when a first gene is not detected, those methods will stop.
In this paper, we have described a simple two locus strategy for detecting the interaction between two susceptibility genes which may have weak or no marginal effects. The test is achieved in two steps. First, the penetrances are estimated using the transmitted and non-transmitted parent gametes. Secondly, we test the fit of these estimates to an independent effect of the two loci (multiplicative matrix). For unbiased estimation of the penetrances, homozygous parents are included contrarily to the usual TDT.
Traditional methods ignore the possibility that effects of multilocus functional genetic units play a larger role than the single-locus effect in determining trait variability. They require large sample sizes which entail a lack of power and thus limit the identification and the
characterization of interactive genes. The power study of the 2-locus TDT has been performed by formal computation since our test uses asymptotic properties. We show that the 2-locus TDT improves the ability to identify gene-gene interactions with the use of moderate sample sizes. However, when the markers have low allele frequencies, we will have small cell counts. For instance, if the locus M had an allele frequency m1 of 0.1, a sample of 100 trios would be
expected to have few observations in the contingency table cells corresponding to the genotype m1m1. In this situation, we may pool some genotypic categories, for example, the
rare homozygous with heterozygous (to pool m1m1 with m1m2 in our illustration). This will
The 2-locus TDT cannot be envisaged in the context of a genome-wide search. Currently, the approximate number of tag SNPs to cover the whole human genome is predicted to be over 500 000 [18]. This means that we have to consider more than 12.5 × 10¹⁰ combinations of two SNPs. Thus, testing for interaction between the huge number of polymorphisms covering the genome - even limited to the second order - is inappropriate. It would generate an intractable number of spurious associations or would miss most of the genetic variability that is relevant for the trait.
Therefore, at a time where genome-wide association studies are fashionable, we think it is important to consider that it will not cover all situations and also to support the additional strategy of studying good candidate pathways.
By studying candidate variants, we assume prior information that the disease under study is probably caused by particular genes. For example, these candidate genes may already be recognized as key elements of a metabolic pathway thought to be involved in the disease pathogenesis.
Each gene of a pathway can be first tested applying locus by locus methods. In the absence of noticeable main effect, our 2-locus TDT must be applied since we may be in the situation of weak or no marginal effect but strong interaction.
Finally, if there are more than two loci, our method may be in principle easily extended to test high-order interactions among several loci, depending on sufficient sample size.
Acknowledgements
This work was supported in part by the Federal Ministry of Education and Research BMBF – German National Genome Research Network NGFN (01GR0462).
References
1 Bateson W: Mendel's principles of heredity. Cambridge University Press, Cambridge, 1909.
2 Fisher RA: The correlation between relatives on the supposition of mendelian inheritance. Transactions of the Roy al Society of Edinburgh 1918;52:399-433.
3 Cordell HJ: Properties of case/pseudocontrol analysis for genetic association studies: Effects of recombination, ascertainme nt, and multiple affected offspring. Genet Epidemiol 2004;26:186-205.
4 Cordell HJ, Barratt BJ, Clayton DG: Case/pseudocontrol analysis in genetic association studies: A unified framework for detection of genotype and haplotype
associations, gene-gene and gene-environment interactions, and parent-of-origin effects. Genet Epidemiol 2004;26:167-185.
5 Cordell HJ, Clayton DG: A unified stepwise regression procedure for evaluating the relative effects of polymorphisms within a gene using case/control or family data: Application to hla in type 1 diabetes. Am J Hum Genet 2002;70:124-141.
6 Culverhouse R, Suarez BK, Lin J, Reich T: A perspective on epistasis: Limits of models displaying no main effect. Am J Hum Genet 2002;70:461-471.
7 Ma DQ, Whitehead PL, Menold MM, Martin ER, Ashley-Koch AE, Mei H, Ritchie MD, Delong GR, Abramson RK, Wright HH, Cuccaro ML, Hussman JP, Gilbert JR, Pericak-Vance MA: Identification of significant association and gene-gene interaction of gaba receptor subunit genes in autism. Am J Hum Genet 2005;77:377-388.
8 Ochoa MC, Marti A, Azcona C, Chueca M, Oyarzabal M, Pelach R, Patino A, Moreno-Aliaga MJ, Martinez-Gonzalez MA, Martinez JA: Gene-gene interaction between ppar gamma 2 and adr beta 3 increases obesity risk in children and adolescents. Int J Obes Relat Metab Disord 2004;28 Suppl 3:S37-41.
9 Coffey CS, Hebert PR, Ritchie MD, Krumholz HM, Gaziano JM, Ridker PM, Brown NJ, Vaughan DE, Moore JH: An application of conditional logistic regression and multifactor dimensionality reduction for detecting gene-gene interactions on risk of
myocardial infarction: The importance of model validation. BMC Bioinformatics 2004;5:49. 10 Maier LM, Chapman J, Howson JM, Clayton DG, Pask R, Strachan DP, McArdle WL, Twells RC, Todd JA: No evidence of association or interaction between the il4ra, il4, and il13 genes in type 1 diabetes. Am J Hum Genet 2005;76:517-521.
11 Lee SG, Kim BS, Kim JH, Lee SY, Choi SO, Shim JY, Hong TJ, Hong SJ: Gene-gene interaction between interleukin-4 and interleukin-4 receptor alpha in korean children with asthma. Clin Exp Allergy 2004;34:1202-1208.
12 Alizadeh M, Babron MC, Birebent B, Matsuda F, Quelvennec E, Liblau R, Cournu-Rebeix I, Momigliano-Richiardi P, Sequeiros J, Yaouanq J, Genin E, Vasilescu A, Bougerie H, Trojano M, Martins Silva B, Maciel P, Clerget-Darpoux F, Clanet M, Edan G, Fontaine B, Semana G: Genetic interaction of ctla-4 with hla-dr15 in multiple sclerosis patients. Ann Neurol 2003;54:119-122.
13 Templeton A: Epistasis and complex traits. In: Wade m, brodie b iii, wolf j (eds) epistasis and the evolutionary process., Oxford University Press, Oxford, 2000.
14 Moore JH: The ubiquitous nature of epistasis in determining susceptibility to common human diseases. Hum Hered 2003;56:73-82.
15 Spielman RS, McGinnis RE, Ewens WJ: Transmission test for linkage
disequilibrium: The insulin gene region and insulin-dependent diabetes mellitus (iddm). Am J Hum Genet 1993;52:506-516.
16 Bickeboller H, Clerget-Darpoux F: Statistical properties of the allelic and genotypic transmission/disequilibrium test for multiallelic markers. Genet Epidemiol 1995;12:865-870.
17 Li W, Reich J: A complete enumeration and classification of two-locus disease models. Hum Hered 2000;50:334-349.
18 Magi R, Kaplinski L, Remm M: The whole genome tagsnp selection and transferability among hapmap populations: Pac Symp Biocomput, 2006, 11, pp 535-543.
Appendix
A- The 2-locus TDT for testing gene-gene interaction
We consider two biallelic markers M and N with alleles m1 and m2 and n1 and n2,
respectively. There are nine possible 2-locus genotypes.
We denote κ xyzw_x’y’z’w’ the number of trios in which the two parents have transmitted mxmy
and nznw to the affected offspring for the loci M and N, respectively and untransmitted mx’my’
and nz’nw’ for the loci M and N, respectively.
Let pm1, pm2, pn1 and pn2 denote the allele frequencies of m1, m2, n1 and n2, respectively.
For the penetrance estimation f xyzw of the genotype mxmy nznw, we maximize the likelihood L(f xyzw | κ xyzw_ x’y’z’w’) by MLE. Let A denote “affected” and f xyzw = P(A | mxmy nznw ).
) n n m P(m P(A) | A) n n m P(m ) = n n m P(A | m w z y x w z y x w z y x
∑
• = ' x',y',z',w P(m m n n | m m m m n n n n ) P(m m m m n n n n ) ? P(A) w' w z' z y' y x' x w' w z' z y' y x' x w z y x xyzw_The probability of being affected P(A) is calculated by summing over all possible genotypes.
∑
= w z y x, ,, w z y x w z y xm n n ) P(m m n n ) m | P(A P(A) ) n n n n m m m m | n n mP(mx y z w x x' y y' z z' w w' depends on the Mendelian transmission probabilities at each locus and the recombination fraction θ (if the loci are linked).
) n n n n m m m
P(mx x' y y' z z' w w' are the frequencies of unordered parental genotypes with subscripts x, x’, z, z’, y, y’, w, w’ ∈ {1, 2}. P(mxmx' mymy' nznz'nwnw' ) is a function of pm1, pm2, pn1, pn 2.
B- Power of the 2-locus TDT
We perform the power study under any two biallelic locus model in a population with Hardy Weinberg equilibrium by formal computation. Results are consequently asymptotic. First, we derive the formula under the general model and then under the restricted model.
Under the general model, we calculate κ xyzw_• and κ•_x’y’z’w’ as a function of f xyzw the
penetrances of the chosen model and the allele frequencies pm1, pm2, pn1, pn2.
Under the restricted model, we have the following formula.
Assuming Hardy-Weinberg equilibrium, the marginal probabilities are calculated as follows: P(A | mxmy) =f xy • = (f xy11 × pn1²) + 2 (f xy12 × pn1 × pn 2) + (f xy22 × pn2²) (1)
P(A | nznw) = f • zw = (f 11zw × pm1²) + 2 (f 12 zw × pm1 × pm2) + (f 22 zw × pm2)² (2)
The corresponding probabilities are a function of the penetrances and the allele frequencies. We denote [fxy •] and [f• zw] the penetrance vector at each locus, respectively, and [f xyzw] the
penetrance matrix for the joint genotype whose correspondent elements are f xyzw. In the
absence of interaction, we have the following equalities:
) ( ] [ ) ( ] [ ) ( ] [ A P f A P f A P fxyzw xy• T •zw ×
= for each x, y, z and w
where Τ superscript represents the transpose of the vector.
Under the restricted model, P(mxmy nznw | A) is calculated in the same manner as under the
general model but using the product of the marginal penetrances given in the equality above. The non-centrality parameter λ is calculated as follows:
| A) n n m (m P | A)]² n n m (m P | A) n n m (m [P ? ? w z y x M w z y x M w z y x M R R G* x, y, z, w − =
∑
where Κ is the total number of families and
P
MRandP
MG* are calculated under the restrictedmodel MR corresponding to the null hypothesis of no interaction and under a specific
Tables
Table 1. Penetrance matrix of the general model MG for markers M and N
Gene M
m1m1 m1m2 m2m2 marginal effect Gene N
n1n1 f 1111 f 1211 f 2211 f• 11 n1n2 f 1112 f 1212 f 2212 f• 12 Gene N n2n2 f 1122 f 1222 f 2222 f• 22 Gene M marginal effect f 11 • f 12 • f 22 •
Table 2. Penetrance matrix of the restricted model MR without interaction. The lines and the
columns represent the three genotypes at locus M and N, respectively with parameter f for the genotype m1m1 n1n1 and the proportionality factors, µ, ν and ϕ, π.
Gene M m1m1 m1m2 M2m2 n1n1 f f ϕ f π n1n2 f µ f ϕµ F π µ Gene N n2n2 f ν f ϕ ν F π ν
Table 3. Transmitted and non-transmitted marker genotypes corresponding to case genotype versus internal control genotype: the first four subscripts in the cell counts κ xyzw _ x’y’z’w’ refer to the transmitted gametes and the second four subscripts refer to the non-transmitted gametes
Non-transmitted genotype = “internal control genotype”
m1m1 n1n1 m1m1 n1n2 m1m1 n2n2 m1m2 n1n1 m1m2 n1n2 … mx’my’ nz ’nw’ … m2m2 n2n2 Marginal m1m1 n1n1 κ1111_1111 κ1111_1112 κ1111_1122 κ1111_1211 κ1111_1212 κ1111_2222 κ 1111_• m1m1 n1n2 κ1112_1111 κ1112_1112 κ1112_1122 κ1112_1211 κ1112_1212 κ1112_2222 κ 1112_• m1m1 n2n2 κ1122_1111 κ1122_1112 κ1122_1122 κ1122_1211 κ1122_1212 κ1122_2222 κ 1122_• m1m2 n1n1 κ1211_1111 κ1211_1112 κ1211_1122 κ1211_1211 κ1211_1212 κ1211_2222 κ 1211_• m1m2 n1n2 κ1212_1111 κ1212_1112 κ1212_1122 κ1212_1211 κ1212_1212 κ1212_2222 κ 1212_• … mxmy
nznw κ xyzw_x’y’z’w’ κ xyzw_•
… m2m2 n2n2 κ2222_1111 κ2222_1112 κ2222_1122 κ2222_1211 κ2222_1212 κ2222_2222 κ2222_• Transmitted genotype = “case genotype” Marginal κ•_1111 κ•_1112 κ•_1122 κ•_1211 κ•_1212 κ•_x’y’z’w’ κ•_2222 Κ
Table 4. Marker penetrance table for models 1A, 1B and 1C Gene M m1m1 m1m2 M2m2 n1n1 0.07 0.05 0.02 n1n2 0.05 0.09 0.01 Gene N n 2n2 0.02 0.01 0.03
Table 5. Marker penetrance table exhibiting epistasis in the absence of independent marginal effects when pm1 = pn1 = 0.5 Gene M m1m1 m1m2 m2m2 marginal effect n1n1 0 0.1 0 0.05 n1n2 0.1 0 0.1 0.05 Gene N n2n2 0 0.1 0 0.05 marginal effect 0.05 0.05 0.05
Table 6. Marginal penetrance vector at the locus M as a function of pn 1 and the penetrance
matrix in table 4.
Marginal penetrance vector at the locus M pn1 f 11 • f 12 • f 22 • 0.05 0.0229 0.0177 0.0281 0.1 0.0259 0.0248 0.0263 0.2 0.0316 0.0372 0.0232 0.3 0.0371 0.0472 0.0207 0.4 0.0424 0.0548 0.0188 0.5 0.0475 0.0600 0.0175 0.6 0.0524 0.0628 0.0168 0.7 0.0571 0.0632 0.0167 0.8 0.0616 0.0612 0.0172 0.9 0.0659 0.0568 0.0183 0.95 0.0679 0.0537 0.0191
Figure legends
Fig. 1. At two unlinked loci, the father has genotype m1m2 n1n2, the mother
m1m1 n1n1. The offspring’s genotype is m1m2 n1n2, which constitute the case genotype. We
may thus deduce the internal control genotype corresponding to the non-transmitted gametes as m1m1 n1n1. m1 m2 n1 n2 m1 m1 n1 n1 m2 m1 n2 n1 m1 m1 n1 n1 Case
0 10 20 30 40 50 60 70 80 90 100 0 0.1 0.2 0.3 0.4 0.5 0.6 0.7 0.8 0.9 1 pn1 % power 2-locus TDT gTDT 1 locus
Fig. 2A. Power of the 2-locus TDT (for detecting the interactive effect between the locus M and N) and the genotypic TDT (gTDT for detecting locus M) as a function of pn 1 with pm1
0 10 20 30 40 50 60 70 80 90 100 0 0.1 0.2 0.3 0.4 0.5 0.6 0.7 0.8 0.9 1 pn1 % power 2-locus TDT gTDT 1 locus
Fig. 2B. Power of the 2-locus TDT (for detecting the interactive effect between the locus M and N) and the genotypic TDT (gTDT for detecting locus M) as a function of pn 1 with pm1
0 10 20 30 40 50 60 70 80 90 100 0 0.1 0.2 0.3 0.4 0.5 0.6 0.7 0.8 0.9 1 pn1 % power 2-locus TDT gTDT 1 locus
Fig. 2C. Power of the 2-locus TDT (for detecting the interactive effect between the locus M and N) and the genotypic TDT (gTDT for detecting locus M) as a function of pn 1 with pm1