HAL Id: hal-00446099
https://hal.archives-ouvertes.fr/hal-00446099
Submitted on 12 Jan 2010HAL is a multi-disciplinary open access archive for the deposit and dissemination of sci-entific research documents, whether they are pub-lished or not. The documents may come from teaching and research institutions in France or abroad, or from public or private research centers.
L’archive ouverte pluridisciplinaire HAL, est destinée au dépôt et à la diffusion de documents scientifiques de niveau recherche, publiés ou non, émanant des établissements d’enseignement et de recherche français ou étrangers, des laboratoires publics ou privés.
Self-oscillation conditions of a
resonant-nano-electromechanical mass sensor
Eric Colinet, Laurent Duraffourg, Sebastien Labarthe, Philippe Andreucci,
Sebastien Hentz, Philippe Robert
To cite this version:
Eric Colinet, Laurent Duraffourg, Sebastien Labarthe, Philippe Andreucci, Sebastien Hentz, et al.. Self-oscillation conditions of a resonant-nano-electromechanical mass sensor. Journal of Applied Physics, American Institute of Physics, 2009, 105, pp.124908. �hal-00446099�
Self-oscillation conditions of a
resonant-nano-electromechanical mass sensor
Eric Colinet+, Laurent Duraffourg+, Sébastien Labarthe+,*, Philippe Andreucci+, Sébastien
Hentz+, and Philippe Robert+
+
CEA-LETI MINATEC, 17 rue des Martyrs 38054 GRENOBLE Cedex 09 – France * Institut Néel, CNRS and Université Joseph Fourier, BP 166, F-38042 Grenoble Cedex
09, France
This article presents a comprehensive study and design methodology of co-integrated oscillators for nano mass sensing application based on resonant Nano-Electro-Mechanical-System (NEMS). In particular, it reports the capacitive with the piezoresistive transduction schemes in terms of the overall sensor performance. The developed model is clearly in accordance with the general experimental observations obtained for NEMS-based mass detection. The piezoresistive devices are much sensitive (up to 10 zg/√Hz) than capacitive ones (close to 100 zg/√Hz) since they can work at higher frequency. Moreover, the high doped silicon piezoresistive gauge, which is of a great interest for very large scale integration displays similar theoretical resolution than the metallic gauge already used experimentally.
Introduction
In the last several years, nano-electromechanical systems (NEMS) resonators have shown their strong potential as highly resolved nano-sensor for gas sensing and ultra low mass detection applications [1], [2], [3]. In these resonant applications, the adsorbed mass on top of the NEMS induces a shift of its resonant frequency that is continuously measured. To follow this frequency variation, the NEMS is embedded in a closed loop that can be either a phase-locked loop (PLL) or a self-oscillating loop [1]. In such architectures, the mechanical amplitude of the vibrating structure is usually kept constant to ensure the stability of the system. Our work is focused on the self-excited scheme because it is a compact co-integrated mass sensor system. Self-oscillating state is established if the electronic gain supplied by the loop is large enough to compensate the losses of the measurement chain. The electronics must also compensate the phase shift induced by the NEMS.
The mass-resolution of such a device is limited by different noise processes such as thermomechanical, Nyquist–Johnson, or adsorption–desorption noises. It is also limited by the electronics sensitivity. Other noise sources as thermal fluctuations and defect motion-induced noise can also be relevant when the targeted ultimate mass is close to some hundred Daltons.
The stability of the self-excited architecture must then be carefully studied to know the expected performance of the resonant mass sensor. Basically, the needed electronic gain to reach the stable state of the device depends strongly on the transduction technique. In this article, a theoretical study of a NEMS embedded in a self-excited loop with capacitive [2] [4], or piezoresistive (PZR) [5] detection principles is presented. Field
effect transduction [6] that may also be used can be treated in the same manner as the capacitive detection.
The same NEMS geometry is used to estimate the performance of the two detection principles. There are many factors that determine the mass sensitivity for a given detection. To make a comprehensive comparison, the NEMS is interfaced at its optimal operating point, e.g. maximum bias voltage taking into account to the physical limitations (pull-in for the capacitive approach, self-heating of the gauges for the piezoresistive way).
The NEMS is based on a vibrating nano cantilever moving in the wafer plane [7]. The cantilever is actuated with lateral electrodes. To perform the PZR detection, gauges are placed on each sides of the cantilever close to the anchor. The gauge are then strained or extended when the beam vibrates. For the capacitive detection is achieved with a second electrode.
The article is organized as follows: The first part the oscillator general topology is presented. The practical implementation of the mechanical structure is then detailed. This structure can be used in capacitive detection or in piezoresistive detection as well. The second part deals with the so-called “capacitive oscillator” where the detection and the actuation of the resonant NEMS are purely electrostatic. In the third part, the “piezoresistive oscillator” based on electrostatic actuation and piezoresistive detection is presented. Finally, ultimate performance (mass resolution) of each oscillator is evaluated.
General topology of an oscillator
Whatever the transduction principle, the oscillator can be described by the general topology shown in Fig 1. The mechanical resonator displacement is converted into an electrical signal by an impedance variation
Z through either capacitive or PZR detection. This signal is amplified and phase shifted to fullfil the Barkhausen condition [8] and then feedbacked to the NEMS through the electrostatic actuation.Oscillation conditions
To realize a NEMS-based oscillator, it is critical to adjust the open-loop gain and phase changes to satisfy the Barkhausen criterion on resonant 1,
0 ) ( arg 1 ) ( 1 ) ( ) ( ) ( ) ( 1 1 1 1 1 1 j H j H j G j H j Vin Vout j H OL OL OL (1)
where H OL is the overall transfer function in open loop configuration.
) ( )
(j J j
H is the transfer function of the NEMS. J , (j) and are the detection gain, the NEMS dynamic and the actuation gain respectively. G(j) is the electronic transfer function to be adjusted.
Whatever the mechanical resonator considered (beam, nanowire, disk…), its dynamical displacement can be reduced to an equivalent mass/spring/damper scheme as follows [9],
Q j M B j K M j eff eff eff eff / / 1 1 ) ( 1 2 1 2 2 0 (2)
where Meff, Keff and Beff are the effective mass, the effective stiffness and the effective
geometrical parameters and anchorage conditions, define the eigen free frequency
eff eff M
K
1 . Beff is related to the quality factor Q=Meff1/Beff. For NEMS Q is
typically close to 1000 in vacuum and 100 in air. Using (2), (1) is reduced the following expression,
90 ) ( arg ) ( 0 ) ( arg 1 ) ( 1 2 1 1 1 1 j G JQ M j G j H j H eff OL OL (3)
where the product J is considered positive.
Phase noise
The oscillator stability is characterized by its frequency noise i.e. the frequency
fluctuation around its eigen frequency 1. is related to the frequency noise spectral
density S via the Parseval-Plancherel theorem,
2 S( 1) (4)
where is the measurement bandwidth. The maximal bandwidth is set by the NEMS bandwidth
Q
1
. To increase the performance, the signal must be integrated over several
periods to have for instance 1 Hz-bandwidth resulting in a relative low response time. From Robins’s expression, the frequency noise spectral density is function of the open loop noise spectral density yn ()
openloop S [10], [11], 2 2 2 1 4 ) ( ) ( y Q S S n y openloop (5)
) (
n
y openloop
S is the sum of all noise sources (white thermomechanical noise, Johnson noise, electronic noise) referred to the resonator mechanical displacement. y is the RMS value of the beam deflection, which can be controlled through electrical non linearity (e.g. saturation of the electronic gain or by controlling the loop gain).
Considering that the noises are not correlated the overall noise density of the open loop is the sum all noise densities,
) ( ) ( ) ( ) ( 1 n 1 n 1 n 1 n y s Electronic y Johnson y anical Thermomech y openloop S S S S (6)
The mathematical expressions of each noise density have to be defined according to the transduction principle and will be described further in the next part. The equation (5) shows that the overall noise density is minimized for large displacement y. In other words, the dissipated power in the vibrating beam must be larger as possible to limit the frequency noise.
The mass resolution (minimum mass detectable) M can be deduced from the phase noise, 1 2 M Meff (7)
The effective mass must be low and the resonant frequency must be as high as possible. These characteristics are fulfilled by NEMS structures.
Practical implementation of the NEMS oscillator
Architecture
The considered structure is a cross beam as shown in Fig. 2. Table I gives the typical feature sizes of the device. This beam used as a lever arm is actuated by the electrostatic
force. The detection of its motion is performed either by two perpendicular thin piezoresistive gauges or by the capacitive variation between the beam and a second electrode. This architecture is versatile and can be used in both configurations. The geometric parameters and the material properties remain the same in both configurations. According to equation (3) and J have to be defined for each detection case. The electronics transfer function will be designed according to and J. The electronics is based on the same Pierce scheme as shown in Fig.3.
Transduction modeling
Second Newton equation is applied in the Galilean referential frame of the substrate to the cross-beam. The cross-beam is assumed to follow Euler-Bernoulli equation [12]. The equation is reduced to its normalized lumped expansion on the first mode through the Galerkin method [13]. Here, we only consider the first eigen modal vector1(x), which observes the boundary conditions1(l1)=1(l1) 0and
) ( ' '1 ll1
=1''(ll1) 0. 1(x) must also follow the mechanical continuity at the gauge position1(0)=1(0) and '(0 )
1
=1'(0). The equivalent electromechanical response of the cross-beam in the “spring/mass/damper” model is expressed as,
) ( 1 ) ( 1 2 2 1 Q j Meff (8) where 1 1 1( ) Sl l l a Meff
is the effective mass of the resonant beam for the first eigen
mode 1 k12 S EI . b S
coefficient).
1 1 ) ( 1 1 2 1 l l a l l dx x l is a constant depending on the modal base and on the
force repartition along the beam. S, , E and I are the section of the cross-beam, the density of the silicon (2330 kg/m3), the Young modulus (169 GPa) and the quadratic moment respectively. 1(ll1)is the value of the modal function at the beam end. k1 is
the wave vector that depends on the distance l1 between the anchor of the lever beam and
the gauge. This value has been set to enhance the stress inside the gauge sensors due to a mechanical lever effect and was fixed at l1=0.15l. In that case k1=2.12/l.
The actuation is made through an electrostatic force, which is uniform along the electrode. Within the limit of small deflection compared to the gap g and for AC-voltages
Vac smaller than the DC-voltage Vdc, the force per unit length at =1 is,
) cos( ) ( 2 1 0 t g V eaV t f dc ac (9)
where 0 is the vacuum permittivity (8.85x10⁻¹² F.m-1).
From (9), the actuation gain can be written as follows,
2 0
g eaV
J dc (10)
Criterion (3) can now be studied for each detection principle.
Capacitive oscillator
Detection gain
The displacement y()=()F() implies a capacitance variation between the lever arm and the electrode. y() is the displacement of the cross-beam end in the Fourier space. The detection gain corresponding to the conversion of the displacement y to the capacitance variation C is then calculated as,
) ( ) ( ) ( 1 2 1 2 0 l l g el y C (11) Circuit modeling
The figure 4 shows the equivalent small signal circuit of the ensemble variable capacitance and its electronics (see Fig 3.b). The electronics is reduced to an equivalent MOSFET transistor. The input capacitance is the gate/source capacitance in parallel with a certain coupling capacitance. The feedback capacitance is the gate/drain capacitance in parallel with the capacitance due to the actuation capacitance. C (Z in Fig.1) is the capacitance variation around its nominal value C0= g
el
0
( 2
g
el ). The fringe effect
can be included using the results presented in Ref [14] and will increase the absolute value of some units. The electronic gain using Millman’s theorem are defined at nodes 1 and 2, ) ( 0 2 1 C C C j jC V C j V V in fb fb dc (12) L ds L fb m fb R g C C j V g jC V / 1 ) ( ) ( 1 2 (13)
At this stage some assumptions on the relative values of RL, CL, Cfb, and Cin have to be
made. In particular, the input current must flow through the capacitance Cin and the
output current must flow through the capacitance CL,
1 0 1 and ( ) ) 1 ( 1 g C C C C C g R R CL L L ds m fb L fb in L (14)
where L is the cut-off frequency of the electronics. From (13) and (14), one can deduce,
L m out C j V g V V 1 2 (15)
Using (12) and (15), G() is,
) ( ) ( ) ( ) ( 0 2 C C C jC V g C V G in fb L dc m (16)
The minimal transconductance gm is defined from the oscillation conditions (3), and the
expression (16), 1 3 2 2 0 2 1 0 4 3 1 3 1 0) ( ) ( ) ( QV e l l l C C C g C M Q J V M C C C C g dc in fb L eff dc eff in fb L m (17)
The conditions (14) can be simplified using (17) and expressing the conductance gds as a
linear function of gm. Considering a MOSFET in saturation regime it is known that,
m E m th G ds g L V g V V g 2 (18)
VG, Vth VE and L are the gate voltage, the threshold voltage, the Early voltage, and the
channel length of the equivalent MOSFET respectively. For the 0.35 µm-CMOS technology, their typical values are 3.3V, 0.485V, 21V/µm and 5 µm respectively.
Finally, the conditions (14) are,
1 0 2 1 1 , 1 ) ( 1 V J Q C C C M C R dc in fb eff L L (19) and 1 2 1 eff read fb M Q J V C (20)
Notice that the parasitic capacitances included in Cin have to be minimized to optimize
detection gain. The feedback capacitance is also a strong source of perturbation. Cfb
Overall noise
To evaluate the mass resolution, the noise sources must be considered (see equation (5)). Here, the white thermomechanical noise and the electronics noise are estimated in a very straightforward manner. Hence in (m²/Hz) 3 1 4 ) ( eff B y anical Thermomech M TQ k S n (21)
From the equations (12) and (14), the noise density of the electronic (in m²/Hz) is as follows, m B L m fb in fb dc y s Electronic g T k C g C C C C V S n 3 8 ) ( 1 ) ( 2 2 1 2 2 2 0 2 2 (22) m B g T k 3 8
is the voltage noise density at the input of the electronics.
Regardless of the NEMS geometry, the critical parameters to reach self-oscillations (16) and optimal mass resolution (5), (22) are the DC-voltage, the gap, the capacitances and the deflection amplitude. Discussion on the system performance is done in the last part of the article.
Piezoresistive oscillator
Detection gain
The well known piezoresitive equation for the axial stress L is [15],
) 2 1 (
d L R dR (23)L L L L E d
(24) L is the longitudinal piezoresistive coefficient along the gauge. Substituting (24) into
(23), we get the usual expression,
L L L L L E R dR (1 2 ) (25)
L is the gauge factor.
The first part of (25) corresponds to the gauge elongation. The second one takes into account the intrinsic piezoresistive coefficient that is predominant for semiconductor gauge. Its large value permits to attain strong sensitivity. The drawback is its large resistance due to the small section of the gauge that is more or less doped (over a range of 1015 cm-3 to 1019 cm-3). This transduction might not be suitable for very tiny mass detection because of the strong Johnson noise floor. A metallic layers can also be used as the gauge layers (for instance coated thin layer on the silicon beam). In this case the elongation effect is only used. Its advantage is clearly the low resistance with a very low Johnson noise [16]. However, the gauge factor is only a function of the Poisson ratio and its value is reduced to some units.
According to equation (24), the relative resistance variation is proportional to the axial stress σL exerted by the resonant lever beam. It is given by the difference of shear
forces V V(x 0)and V V(x 0). After few mathematical developments, σL
can be expressed as,
y s EIk ew V V j L 3 1 (26)
s is the section of the gauges. is a constant that depends on the boundary and normalization conditions.
The displacement y induces the axial stress and implies a relative resistance variation leading to the PZR detection gain,
) ( / 1 1 3 1 l l s Ik y R R L (27)
depends on the mode shape of the lever beam, the geometry, and the gauge factor.
The gauge factor L depends on the doping level and is between 10 and 100 [15].
Circuit modeling
Figure 5 shows the equivalent small signal circuit of the ensemble variable resistance and its electronics. The expression of the transfer function Vout/R is
straightforward using the Millman’s theorem at nodes 1 and 2,
) ( 2 ) ( 2 2 2 1 in fb fb b C C j R C j V R R V V (28) and, L L fb fb m out R gds C C j V C j V g V V 1 ) ( 1 1 2 (29)R (Z in Fig.1) is the resistance variation around its nominal value R. Vb is the read
voltage applied on the gauges.
At this stage some assumptions on the relative values of RL, CL, Cfb, and Cin have to be
made. In particular, the input current must flow through the resistance R. In practice, typical resistance values of gauge obtained in this work are close to 3 k. Cin is close to
10 fF in a co-integration approach to 1 pF when a stand-alone circuit is used. It means that the assumption is true up to 150 MHz for the worst case. Moreover the output current must go through the output capacitance CL. These conditions are summed up as,
)) 1
( (
1 1CL RL gdsRL and gm 1Cfb (30) From (29) and (30), one can deduce:
L m out C j V g V V 1 2 (31)
Using (31) and (28), G() is,
) 2 ( 2 ) ( ) ( m fb L b m out Rg C C j V g R R V G (32)
The minimal transconductance gm is defined from the oscillation conditions (3), and the
expression (32), 3 1 0 1 1 2 3 1 3 1 ( ) Ik ea V QV l l s g C M Q J V C M g L b dc L eff dc L eff m (33)
As in the capacitive case, the conditions (30) can be simplified using (33) and expressing the conductance gds as a linear function of gm :
1 2 1 1 , 1 1 V J Q M C R dc eff L L (34) and 1 2 3 1 R M Q J V C eff dc fb (35)
Noise modelling
The thermomechanical noise remains unchanged (see equation (18)). The noise from the gauge is the Johnson noise. Its expression in (m²/Hz) is deduced from the equations (27) and (28), 2 2 2 2 1 4 ) ( L m fb dc B y Johnson C Rg C V TR k S n (33)
where R is the sum of the gauge resistance and the lead resistance. The electronics noise in (m²/Hz) is for a MOSFET in strong inversion,
2 2 2 2 1 3 8 ) ( L m fb dc m B y s Electronic C Rg C V g T k S n (34)
where gm is the transconductance according to the equation (32).
The model does not take into account the 1/f-noise due to low charge carrier density in the semiconductor material. However, we considered high doped silicon gauges (at least 1019 cm-3) built with a typical CMOS process, which reduces the 1/f-noise.
Performance of piezoresistive and capacitive oscillators
We simulate the two kinds of oscillators according to the resonant frequency of the NEMS. The frequency is changed from 1 MHz to 50 MHz by varying the beam width w. All other geometrical parameters are kept constant (Table I). To study in a proper way the capacitive and piezoresistive oscillators, both devices are settled in their optimal working point regime i.e based on their highest detection gain for each. For both oscillators, a monolithic integration is considered so that the parasitic capacitances are minimized [17]. The simulations are performed considering 0.35 µm-CMOS technology [2]. Cin, and Cfb
are parasitic components. Cfb will reasonably not exceed 5 fF (around 0.13 fF/µm for the
0.35 µm -CMOS technology) and Cin will be close to 10 fF.
The actuation voltages Vdc is the same for the two oscillators. We assume a deflection y
=10 nm (~gap/10), well below than the non linear displacement limit and the dynamic pull-in [18]. For the piezoresistive detection, the readout voltage Vj should be chosen as
high as possible. In the same time, Vj must be low enough to avoid the gauge breaking
due to a large current flowing through [19]. For the silicon gauge of ~3 k with a gauge factor of 100 for 1019 cm-3 doping level [15], the voltage Vj is set to 600 mV to keep the
gauge temperature growth around 100 K. For the capacitive detection, the readout voltage is directly Vdc and set to the maximum acceptable value for CMOS compatibility (Vdc =
Notice that all characteristics driving the actuation gains are the same for the two oscillators. A priori, the only design parameters are RL and CL that should be adjusted for
each mechanical resonant frequency to optimize the oscillation conditions. As shown in Tab. III, RL and CL have the same impact on the gain and phase conditions for each
technique. These parameters are set at reasonable values so that 1 1
1 L LC R up to
100 MHz. Clearly, the upper working frequency limit of the two oscillators could be optimized by fine tuning of these parameters. But this study is out of the framework of this paper.
For the capacitive transduction, the oscillation conditions (see table III) are shown in Fig. 6. The phase conditions are only observed if the oscillation frequency is below ~5 MHZ. Notice that the equation (19) follows a 1/f law at low frequency and a quadratic variation at high frequency. Gains J and are independent of the frequency. The requested transconductance gm increases with the frequency. Stiffer mechanical structures
demand larger energy level to reach self-oscillation. This simple law is well expressed by the equation (17). Over the usable frequency range, gm is always smaller than 2.10-5 S.
This value is rather easily reached with a co-integrated circuit (with a single aforementioned 0.35 µm-MOSFET). Similar results are presented in Fig. 7 for the semiconductor gauges. This transduction principle is more effective to get self-oscillation compared to the capacitive one. The useful transconductance gm for a semiconductor
gauge varies over the 7- 47 MHz frequency range from some 10-4 S to 5.10-4 S. Notice that the equation (34) follows a 1/f law at low frequency and becomes constant at high frequency. Gains J and change according to a f2law.
Finally, the figure 8 gives the theoretical mass resolution for the two detection schemes. Table IV sums up all noise sources used in the model. Over 5 MHz-10 MHz frequency range, the resolutions are quite similar close to 10 zg for a 1 Hz-bandwidth. For highest frequency up to 50 MHz, the expected resolution may reach 1 zg with the piezoresistive detection. These results are rather comparable with experimental mass performance already published [20] [21]. The difference between the two detection schemes (in particular the inflection point for the capacitive detection) is mainly due to the electronic noise. In particular, this noise is inversely proportional to the detection gain
, which is constant with the capacitive detection and changes according to a f2-law with
the piezoresistive detection.
Conclusion
We have done a theoretical comparison between two in-plane oscillating architectures based on piezoresistive and capacitive detections respectively. The sensors are embedded in a closed loop system with an electronic readout circuitry to define the mass-sensor. The overall measurement chains are studied through two specific models. This work provides a comprehensive theoretical method that is valid for any capacitive or piezoresistive principles. It is a useful methodology to design compact oscillator circuit around NEMS application.
Considering that the capacitive and PZR oscillators are set in their optimal working PZR detection can work at higher frequency and offers therefore better mass resolution. This trend can be extended to any NEMS.
Moreover silicon gauge can reach similar mass resolution than metallic gauge commonly used elsewhere [21]. Although the Johnson noise is increased with the resistance value, the signal improvement is much higher than the noise worsening. This conclusion completes the analysis most widely held that considers the metallic gauge as the best candidate for ultimate mass resolution. The silicon piezoresistive detection is an alternative choice for the mass sensing application if the ambient temperature is not too low (freeze-out effect of carrier density).
To conclude, this work paves the way toward the very large scale integration of the piezoresistive NEMS with its co-integrated electronics.
Acknowledgement
Authors acknowledge financial support from the French Carnot - NEMS contract. We also thank M.L. Roukes for fruitful discussions.
Reference
[1] K. L. Ekinci, Y. T. Yang and M. L. Roukes, Journal of Applied Physics, Vol. 95, No 5, 2682-2689 (2004).
[2] J. Verd, A. Uranga, G. Abadal, J.L. Teva, F. Torres, J. Lopez, F. Perez-Murano, J. Esteve, N. Barniol, “Monolithic CMOS MEMS Oscillator circuit for sensing in the attogram range”, IEEE electron device letters, vol. 29, no. 2, pp. 146-148, February 2008
[3] K. Jensen, K. Kim and A. Zettl, Nature Nanotechnology, VOL 3, (2008)
[4] N. Yazdi, F. Ayazi and K. Najafi, Proc. IEEE, Vol. 86, 1640-1659 (1998).
[5] Mo Li, H. X. Tang, M. L. Roukes, Nature Nanotechnology 2, 114 – 120 (2007).
[6] L. Duraffourg, E. Colinet, E. Ollier, S. Hentz, P. Andreucci, B. Reig, and P. Robert, APL 92, 174106 (2008).
[7] Ph. Robert, French Patent EN07 55992, Résonateur piezorésistif réalisé en technologie de surface (2007).
[8] Hajimiri, A. & Lee, T. H. The Design of Low Noise Oscillators (Kluwer Academic Publishers, Norwell, 1999).
[9] Yu-Wei Lin, Seungbae Lee, Sheng-Shian Li, Yuan Xie, Zeying Ren, and Clark T.-C. Nguyen, IEEE Journal of Solid-State Circuits, Vol. 39, No. 12, (2004)
[10] W. P. Robins, Phase Noise in Signal Sources, Peter Peregrinus LTD (1982)
[11] B. Razavi, IEEE Journal of Solid-State Circuits, Vol. 31 (3) (1996)
[12] L.D.Landau, E.M. Lifshitz, Theory of Elasticity (Vol. 7), Ed. Pergamon (1959)
[13] A. Ern, J.L. Guermond, Theory and practice of finite elements, Springer, (2004)
[14] Nishiyama H. and Nakamura K., IEEE Transaction on Components, Hybrids, and Manufacturing Technology, Vol. 13, No. 2 (1990).
[15] Y. Kanda, IEEE Transaction on Electron. Devices, VOL. ED-29, No. 1, 64-70 (1982)
[16] J. A. Harley and T. W. Kenny, Applied Physics Letters, Vol. 75 (2), 289-291 (1999). F. N. Hooge, Phys. Lett. 29A, 139 (1969).
[17] Eric Colinet, Cédric Durand, Laurent Duraffourg, Patrick Audebert, Guillaume Dumas, Fabrice Casset, Eric Ollier, Pascal Ancey, Jean-François Carpentier, Lionel Buchaillot, and Adrian M. Ionescu, IEEE JOURNAL OF SOLID-STATE CIRCUITS, VOL. 44, No. 1 (2009).
[18] KACEM N., HENTZ S., BAGUET S. DUFOUR R., Twelfth Conf. on Nonlinear Vibrations, Dynamics, and Multibody Systems, June 1-5, 2008
[19] Ch. Kittel, Introduction to Solid State Physics, Ed. John Wiley and Sons, New York, (1996).
[20] B. Ilic, H. G. Craighead, S. Krylov, W. Senaratne, C. Ober, and P. Neuzil, J. Appl. Phys. 95, 3694 (2004).
[21] Y. T. Yang, C. Callegari, X. L. Feng, K. L. Ekinci, and M. L. Roukes, NanoLetters 6 (4), 583-586, (2006).
TAB. I. Typical values of the mass sensor – (see Figure 2 for the geometrical parameters) l (µm) w (µm) l1 (µm) lj (µm) wj (nm) a (µm) g (µm) f1 (MHz) e (nm) Composition 5 0.3 0.75 0.5 80 4 0.1 21 160 High doping (1019 cm-3)
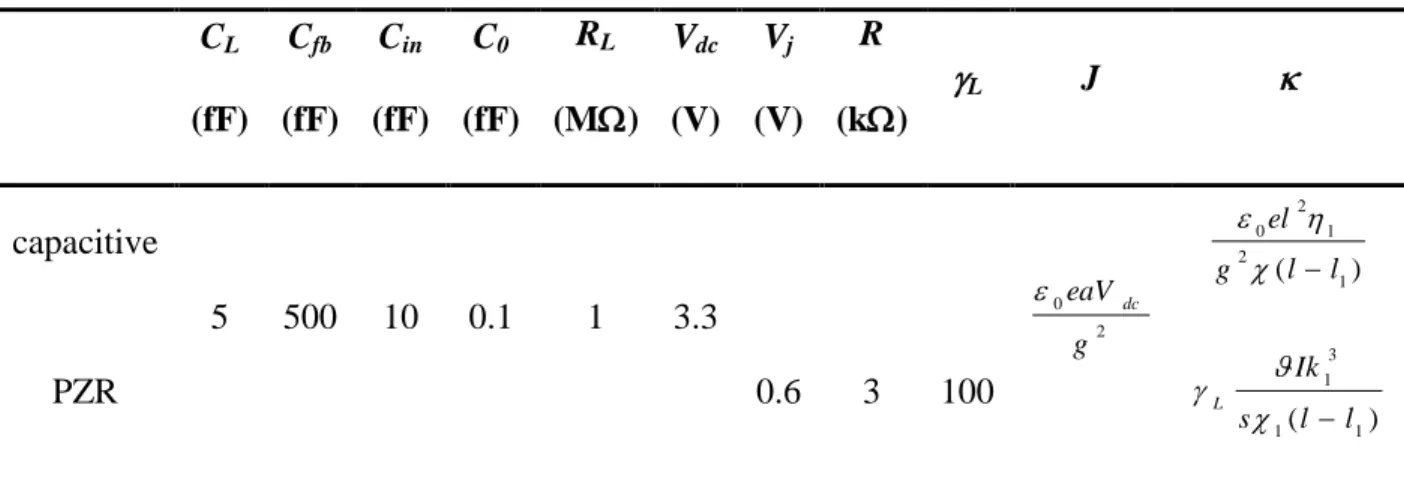
TAB. II. Electrical parameters CL (fF) Cfb (fF) Cin (fF) C0 (fF) RL (M) Vdc (V) Vj (V) R (k) L J capacitive 5 500 10 0.1 1 3.3 0 2 g eaVdc ( 1) 2 1 2 0 l l g el PZR 0.6 3 100 ) ( 1 1 3 1 l l s Ik L
TAB. III. Oscillation conditions Gain Phase capacitive Q J V M C C C C g dc eff in fb L m 3 1 0) ( 1 0 2 1 1 , 1 ) ( 1 V J Q C C C M C R dc in fb eff L L 1 2 1 eff read fb M Q J V C PZR Q J V C M g dc L eff m 3 1 1 2 1 1 , 1 1 V J Q M C R dc eff L L (34) 1 2 3 1 R M Q J V C eff dc fb
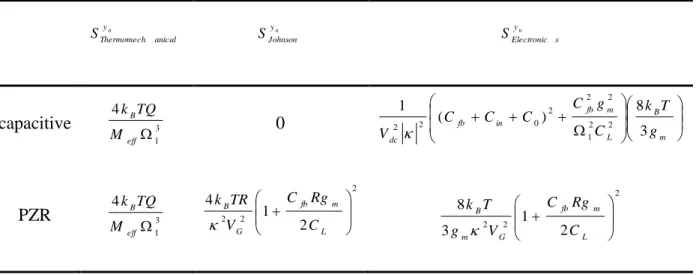
TAB. IV. Main noise sources n y anical Thermomech S yn Johnson S yn s Electronic S capacitive 3 1 4 eff B M TQ k 0 m B L m fb in fb dc g T k C g C C C C V 3 8 ) ( 1 2 2 1 2 2 2 0 2 2 PZR 3 1 4 eff B M TQ k 2 2 2 2 1 4 L m fb G B C Rg C V TR k 2 2 2 2 1 3 8 L m fb G m B C Rg C V g T k
FIG.1. Closed loop representation of the self-exited system
FIG. 2. Schematic of the cross beam used for the in-plane piezoresistive and capacitive detection
FIG. 3. Electrical schematic of the cross beam embedded into a self-oscillation loop – a) “Capacitive oscillator” scheme – b) “PZR oscillator” scheme – VG and VD are static
polarization of the equivalent MOSFET – RG and RL are the polarization resistances - CL
a)
is the load capacitance – (Vj, Vdc) are readout voltages for the PZR and the capacitive
detections respectively – Vdc is the actuation voltage
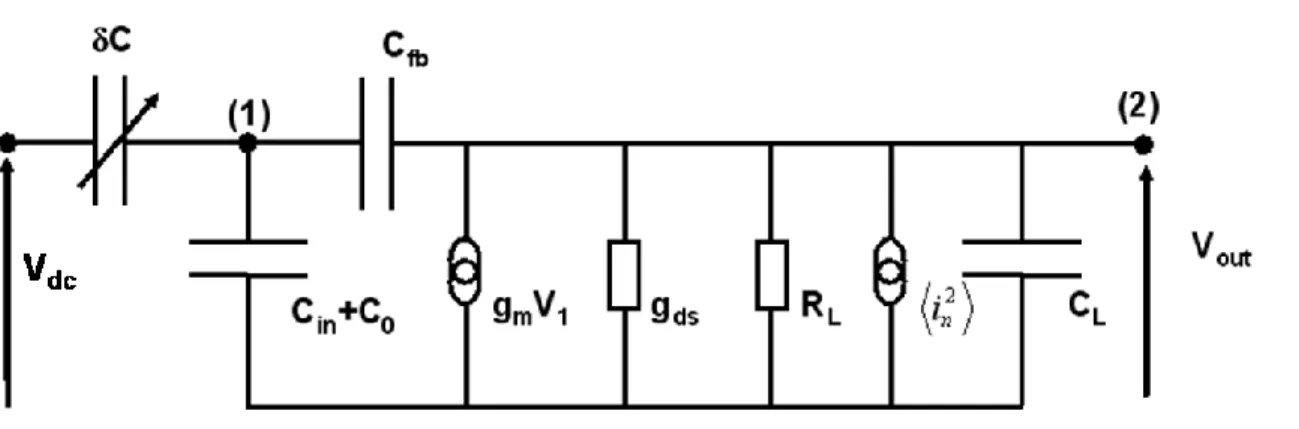
FIG. 4. Small signal model of the ensemble MOSFET+capacitive sensor, Cin is the input
capacitance, C0 is the nominal NEMS sensor capacitance, CL is the output capacitance, Cfb is the feedback capacitance, gm is the transconductance, gds is the channel
conductance, RL is the load resistance and 2 n
i is the noise current at the output of the
MOSFET
FIG. 5. Small signal model of the ensemble MOSFET+gauge, Cin is the input
capacitance, CL is the output capacitance, Cfb is the feedback capacitance, gm is the
transductance, gds is the channel conductance, RL is the load resistance and 2 n
i is the
FIG. 6. (a) Phase conditions (19), (20) and (b) minimal transconductance (17) in the case of capacitive detection – Regions where (19) and (20) are higher than 0.1 are excluded to ensure the phase-conditions – gm should be lower than 1 mS to enable oscillations with a
FIG. 7. (a) Phase conditions (34), (35) and (b) minimal transconductance (33) in the case of piezoresistive detection – Regions where (34) and (35) are higher than 0.1 are excluded to ensure the phase-conditions – gm should be lower than 1 mS to enable
oscillations with a single MOSFET – The frequency range to get self-excited oscillation is 7 MHz to 47 MHz