HAL Id: hal-01925000
https://hal.inria.fr/hal-01925000
Submitted on 12 Oct 2020
HAL is a multi-disciplinary open access
archive for the deposit and dissemination of
sci-entific research documents, whether they are
pub-lished or not. The documents may come from
teaching and research institutions in France or
abroad, or from public or private research centers.
L’archive ouverte pluridisciplinaire HAL, est
destinée au dépôt et à la diffusion de documents
scientifiques de niveau recherche, publiés ou non,
émanant des établissements d’enseignement et de
recherche français ou étrangers, des laboratoires
publics ou privés.
The individual’s signature of telomere length
distribution
Simon Toupance, Denis Villemonais, Daphné Germain, Anne Gégout-Petit,
Eliane Albuisson, Athanase Benetos
To cite this version:
Simon Toupance, Denis Villemonais, Daphné Germain, Anne Gégout-Petit, Eliane Albuisson, et al..
The individual’s signature of telomere length distribution. Scientific Reports, Nature Publishing
Group, 2019, 9 (1), pp.1-8. �10.1038/s41598-018-36756-8�. �hal-01925000�
The individual’s signature of
telomere length distribution
Simon Toupance
1,2,3, Denis Villemonais
4,5, Daphné Germain
4, Anne Gegout-Petit
5,
Eliane Albuisson
5,6,7& Athanase Benetos
1,2Mean telomere length in human leukocyte DNA samples reflects the different lengths of telomeres at the ends of the 23 chromosomes and in an admixture of cells. However, only rudimentary information is available regarding the distribution of telomere lengths in all chromosomes and the different cell types in leukocyte samples. Understanding the configuration of leukocyte telomere length distribution (LTLD) could be helpful in capturing intrinsic elements that are not provided by the mean leukocyte telomere length (mLTL). The objective of this study was to analyse LTLD and its temporal variation in adults. Leukocyte samples were donated on two occasions (8 years apart) by 72 participants in the ADELAHYDE study. Telomere length was measured by Southern blotting of the terminal restriction fragments. Individuals with comparable mLTLs displayed different shapes of LTLDs. Inter-individual variation in LTLD shape was much larger than intra-individual variation in LTLD shape between baseline and follow-up leukocyte samples. These results show an important individual stability of LTLD shape over time indicating that each individual has a characteristic LTLD signature.
Telomeres are non-coding nucleoprotein structures located at the end of chromosomes. They protect loss of vital
DNA sequences, block end-to-end fusions and facilitate distinguishing chromosome ends from DNA damage1.
With age, telomere length (TL) displays a progressive shortening in replicating somatic cells due to the “end
replication problem”2. Ultimately, these cells acquire critically short and dysfunctional telomeres that lead to
growth arrest known as replicative senescence3. A body of work has focused on examining the potential role of
TL dynamics (TL and its age-related shortening) in aging and its related diseases. In adults, short leukocyte TL
(LTL), a proxy to other somatic cells4, is associated with a higher risk of cardiovascular5,6, neurodegenerative7,8
and metabolic diseases6,9, as well as with untimely death10.
Several methods have been developed to measure TL, including 1) Southern blot (SB) analysis of the terminal
restriction fragments (TRF)11; 2) quantitative PCR (qPCR) whose output is expressed as the ratio of telomere
product relative to a single copy gene product12; 3) fluorescent in situ hybridization (FISH) techniques, including
quantitative FISH (qFISH) based on microscopy and flow FISH using flow cytometry13; 4) single telomere length
analysis (STELA)14 and telomere shortest length assay (TeSLA)15, measurements at the single telomere level based
on a combination of PCR and Southern blot. There is ongoing debate as to which method of TL measurement,
principally SB vs. qPCR16–18, is optimal in epidemiological settings. The advantages of the qPCR method are its
high throughput and low cost. SB, considered the “gold standard”19, yields both mean TL (mTL) values and
gen-erates the distribution of TLs in the DNA sample20. However, the vast majority of studies using SB measurements
only report mTL and not the parameters of TL distribution. Generating data on TL distribution can provide valuable information, since the shortest telomeres, rather than mTL, may represent the main determinants of cell
fate14,21–23. Accordingly, the aim of this study was to analyse the distribution of telomere length in leukocytes and
its reconfiguration over the course of 8 years in 72 subjects from the ADELAHYDE (Analyse des DEterminants génétiques et environnementaux de la Leucoaraïose dans une population à sujets Agés HYpertendus présentant des troubles cognitifs DEbutants) study (Table 1).
We hypothesized that the leukocyte telomere length distribution (LTLD) evolved over the 8-year follow-up period and that changes in shape would be noticeable. This hypothesis was based on the following two state-ments. First, when TL is studied with the TRF method, the results reflect the telomere length at both ends of the 1Université de Lorraine, Inserm, DCAC, F-54000, Nancy, France. 2Université de Lorraine, CHRU-Nancy, Pôle “Maladies du Vieillissement, Gérontologie et Soins Palliatifs”, F-54000, Nancy, France. 3Nancyclotep-GIE, F-54000, Nancy, France. 4Université de Lorraine, Ecole des Mines, F-54000, Nancy, France. 5Université de Lorraine, CNRS, Inria, IECL, F-54000, Nancy, France. 6Université de Lorraine, CHRU de Nancy, BIOBASE, Pôle S2R, Nancy, F-54000, France. 7Université de Lorraine, InSciDenSe, F-54000, Nancy, France. Correspondence and requests for materials should be addressed to A.B. (email: a.benetos@chru-nancy.fr)
Received: 25 May 2018 Accepted: 8 November 2018 Published: xx xx xxxx
www.nature.com/scientificreports/
23 pairs of chromosomes (i.e. 92 telomeres for one cell). Attrition can cause a single short telomere to reach the limit that will trigger cell senescence. In this case, this short telomere will disappear as well as the 91 others of this same cell. The impact of such successive losses along years on the shape of the distribution can be assumed to be noticeable. Secondly TRF measurements involve a mixture of cells and the LTLD reflects also the variability of
TL among these different cells. Indeed, TL in leukocyte subtypes can differ24 and the “composition” in leukocyte
subtypes can vary between baseline and follow-up, depending on the inflammatory status of the patient, leading to noticeable LTLD evolutions.
Results
LTL parameters.
Mean LTL decreased between baseline and follow-up (Table 1; p < 0.0001). There was a trend for longer mLTL in women than in men both at baseline (p = 0.15) and follow-up (p = 0.13). The average rate of mLTL attrition was 27.3 base pairs (bp) per year.mLTL tracking and ranking.
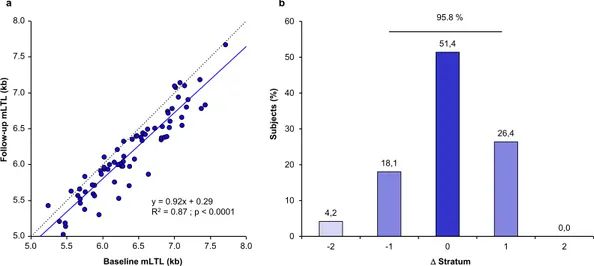
Linear regression was used to assess the association between mLTL at base-line and follow-up. mLTL showed robust tracking, such that individuals with a relatively longer (or shorter) mLTL at baseline also showed a relatively longer (or shorter) mLTL at follow-up (Fig. 1a). The Pearson corre-lation was r = 0.93. To further examine tracking in the context of the ranking of an individual’s mLTL among his/her peers, individuals were subdivided into seven strata according to their mLTL at baseline and follow-up examinations. Each stratum comprised 10–11 individuals and the change in mLTL rank between baseline and follow-up was examined by stratum change (Fig. 1b). Individuals largely maintained their ranks between baseline and follow-up examinations with 51.4% unchanged, 44.5% showing an increase/decrease of one stratum (26.4% up/18.1% down), and only 4.2% showing a change of 2 or more strata. Thus, 95.8% showed no change in rank or a change of only 1 stratum. The above association was also tested as a continuum in all 72 subjects by performing a non-parametric correlation (Spearman rank analysis). This analysis confirmed the strong relationship between baseline and follow-up ranking (R = 0.94; p < 0.0001).Figure 1. Fixed mLTL ranking over time in the ADELAHYDE cohort. (a) Correlation between baseline mLTL and follow-up mLTL. The dashed line represents the identity line. The continuous line represents the linear
regression of the data. R2 (based on Pearson correlation) is equal to 0.87. (b) Distribution of subjects exhibiting
a change in stratum rank (Δ) between baseline and follow-up examinations (population subdivided in 7 mLTL strata in each examination). A negative sign denotes a downward shift in ranking while a positive sign indicates an upward shift in ranking. mLTL = mean leukocyte telomere length.
All Men Women
Number of participants 72 36 36 Age at baseline (years) 67.7 ± 5.4 67.5 ± 5.4 68.0 ± 5.5 Age at follow-up (years) 75.9 ± 6.0 75.8 ± 6.1 76.0 ± 6.0 Follow-up duration (years) 8.2 ± 1.2 8.4 ± 1.4 8.0 ± 1.0 mLTL at baseline (kb) 6.39 ± 0.57 6.29 ± 0.53 6.49 ± 0.60 mLTL at follow-up (kb) 6.16 ± 0.57 6.06 ± 0.54 6.26 ± 0.58 mLTL attrition (bp/year) 27.3 ± 25.6 27.4 ± 23.6 27.2 ± 27.8
Table 1. Characteristics of the participants of the ADELAHYDE cohort. mLTL, mean leukocyte telomere length. Values are mean ± SD or %.
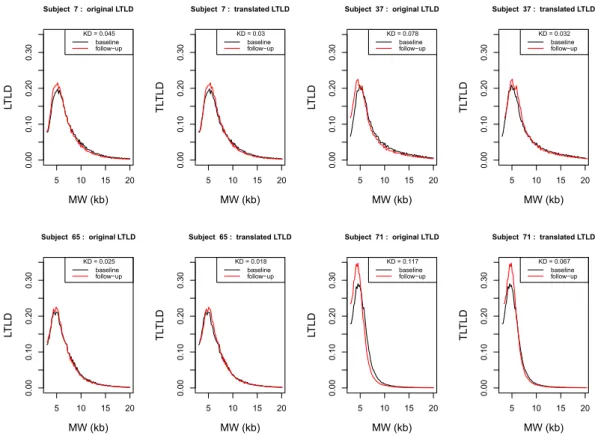
LTLD shape.
To study LTLD shape and its potential reconfiguration over time, the translated LTLDs (TLTLD) at baseline and follow-up were drawn in order to have the same median value in the two distributions. Figure 2 shows examples of this transformation in four subjects (Supplementary Fig. S2 depicts the TLTLD distributions at baseline and follow-up for each of the 72 subjects).Kolmogorov distances between the baseline and follow-up TLTLDs for each of the 72 subjects were computed to illustrate the manner in which the LTLD was reconfigured over the interval of 8 years. The distribution of these 72 distances is shown in red in the normalised histogram in Fig. 3. The 72*71 Kolmogorov distances (each of the 72 subjects was compared with the 71 others) between the TLTLD at baseline for one subject and follow-up TLTD for another subject were also computed. The normalized histogram of these distances is given in blue in Fig. 3. This figure shows that the intra-subject distances were lower than the inter-subject distances: 90% of the intra-subject Kolmogorov distances were lower than 0.05 whereas this was only the case for 40% of the inter-subject distances. The T test confirmed this observation by rejecting the null hypothesis between the two
observed means of the intra-subject distances (xn= 0.0258) vs. the inter-subject distances (yn = 0.0639)
(p < 0.0001). Supplementary Fig. S3 illustrates the TLTLD of one subject taken randomly (number 36) compared to each of the other subjects.
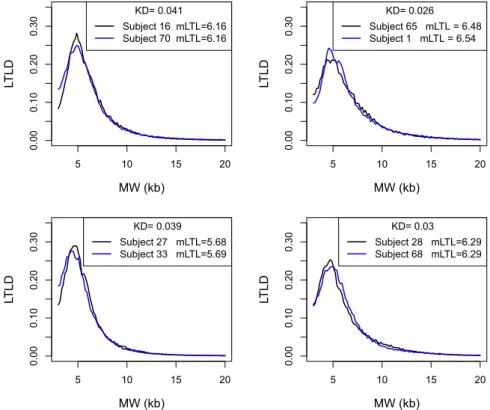
Relationship between LTLD and mLTL.
Figure 4 depicts four pairs of subjects. Each of these pairs had roughly the same values of mLTL at baseline: 6.16 for subjects 16 and 70; approximately 6.51 for subjects 1 and 65; approximately 5.68 for subjects 27 and 33; and 6.29 for subjects 28 and 68. Whereas the mLTL were very similar, the distributions differed considerably as expressed by the Kolmogorov distances. To generalize and confirm these observations, the KDs between 86 pairs of subjects with relatively similar mLTL (less than 40 bp difference in mLTL) were compared with the 72 intra-subject KDs. The mean intra-subject difference in mLTL between baseline and follow-up was 227 bp (more than 5 times higher than the inter-subject differences). Nevertheless, intra-subject KD was statistically lower than the KD between subjects with similar mLTL (0.026 vs. 0.037; p < 0.0001; Fig. 5).Discussion
The central finding of this study is that individuals, even those with similar mLTL, display different LTLD shapes. In addition, these shapes are stable over time, therefore the LTLD shape may be characteristic of each individual.
TL plays an important role in morbidity and mortality in humans. Comparatively short mLTL is associated
with atherosclerosis25, dementia26, type 2 diabetes mellitus27 and cardiovascular mortality12. However, the vast
5 10 15 20 0.00 0.10 0.20 0.30 Subject 7 : original LTLD MW (kb) LT LD KD = 0.045 baseline follow−up 5 10 15 20 0.00 0.10 0.20 0.30 Subject 7 : translated LTLD MW (kb) TL TL D KD = 0.03 baseline follow−up 5 10 15 20 0.00 0.10 0.20 0.30 Subject 37 : original LTLD MW (kb) LT LD KD = 0.078 baseline follow−up 5 10 15 20 0.00 0.10 0.20 0.30 Subject 37 : translated LTLD MW (kb) TL TL D KD = 0.032 baseline follow−up 5 10 15 20 0.00 0.10 0.20 0.30 Subject 65 : original LTLD MW (kb) LT LD KD = 0.025 baseline follow−up 5 10 15 20 0.00 0.10 0.20 0.30 Subject 65 : translated LTLD MW (kb) TL TL D KD = 0.018 baseline follow−up 5 10 15 20 0.00 0.10 0.20 0.30 Subject 71 : original LTLD MW (kb) LT LD KD = 0.117 baseline follow−up 5 10 15 20 0.00 0.10 0.20 0.30 Subject 71 : translated LTLD MW (kb) TL TL D KD = 0.067 baseline follow−up
Figure 2. Original LTLD and Translated LTLD (TLTLD) of 4 subjects at baseline and follow-up.
LTLD = Leukocyte telomere length distribution; TLTLD = Translated leukocyte telomere length distribution; MW = molecular weight; kb = kilobase; KD = Kolmogorov distance Each. pair of panels shows the two LTLDs of one subject at baseline (in black) and follow-up (in red) and their transformation in TLTLD. The Kolmogorov distances between the two LTLD and the two TLTLD are given. The four subjects are respectively subject 7 (upper left panels), 37 (upper right panels), 65 (lower left panels) and 71 (lower right panels).
www.nature.com/scientificreports/
majority of these associations are based on mLTL, which reflects all of the different TL in the chromosomal ends and cells in a given DNA sample. Associations of LTLD with aging-related diseases and longevity have not been examined comprehensively. Some studies have shown that the shortest telomeres, measured using universal
STELA, may be associated with senescence or disease whereas mLTL is not28–30. One study using TRF to calculate
the percentage of short/medium/long telomeres has shown that the distribution can differ between groups with
relatively similar mLTL31. In contrast, the present study analysed the entire LTL distribution as a continuum. As
Kolmogorov distances Propor tion (% ) 05 10 15 20 25 30 35 0.00 0.02 0.04 0.06 0.08 0.10 0.12 0.14 0.16 0.18 0.20 0.22 intra−subjects inter−subjects
Figure 3. Intra-subject and inter-subject distribution of Kolmogorov distances between TLTLD. Normalised histograms for intra-subject distances (in red, mean = 0.0258) and inter-subject distances (in blue,
mean = 0.0639). 5 10 15 20 0.00 0.10 0.20 0.30 MW (kb) LT LD KD= 0.041 Subject 16 mLTL=6.16 Subject 70 mLTL=6.16 5 10 15 20 0.00 0.10 0.20 0.30 MW (kb) LT LD KD= 0.026 Subject 65 mLTL = 6.48 Subject 1 mLTL = 6.54 5 10 15 20 0.00 0.10 0.20 0.30 MW (kb) LT LD KD= 0.039 Subject 27 mLTL=5.68 Subject 33 mLTL=5.69 5 10 15 20 0.00 0.10 0.20 0.30 MW (kb) LT LD KD= 0.03 Subject 28 mLTL=6.29 Subject 68 mLTL=6.29
Figure 4. Relationship between LTLD and mLTL. LTLD = Leukocyte telomere length distribution;
MW = molecular weight; kb = kilobase; mLTL = mean leukocyte telomere length; KD = Kolmogorov distance. For other abbreviations see legends of Figures 1 and 2. Each panel shows the two LTLD of two subjects with similar mLTL. The Kolmogorov distance between the two LTLD are given.
a result, we were able to describe differences in LTLD shapes among individuals even when their mLTLs were similar.
We have previously shown that mLTL ranking among individuals changes little during adult life32 and that
during this period, risk factors and diseases have comparatively less effect on mLTL attrition than variations
already in place prior to adulthood33,34. This indicates that mLTL is primarily determined early in life, mainly
by mLTL at birth and its dynamics during the first two decades of life, in order to accommodate hematopoietic
stem cell pool expansion35–37. However, mLTL attrition rates during adult life do not capture potential
reconfig-uration in LTLD. Two studies using SB have shown that the distribution between short/medium/long telomeres
can change in cultured human cells under specific temperature or radiation conditions38,39. In principle, LTLD
changes may occur without major impact on mLTL. The contribution of this study is to show a strong stability over time not only in the ranking according to mLTL, but also of the shape of LTLD. Since LTLD could be linked
to patterns of stem cell growth36, it could hence play a determinant role in disease development.
The main limitation of this study is that the follow-up duration was only 8 years and therefore we cannot conclude on variations occurring over a longer period. Another limitation is related to the selected profile of the cohort and therefore these analyses should be reproduced in larger unselected cohorts. Third, the Southern blot method lacks sensitivity to detect very short telomeres (below 3 kb) which are therefore excluded from the observed LTLD.
In light of the present findings, we propose that in future clinical studies, LTLD signature could capture new associations between TL dynamics and clinical parameters or disease markers. LTLD signature could become a new parameter to describe patients, enabling a better clustering of and/or discrimination between these patients, thus enabling better insight into the TL-disease connection.
Methods
Subjects.
Leukocyte DNA was extracted from blood samples donated by participants in the ADELAHYDE (Analyse des DEterminants génétiques et environnementaux de la Leucoaraïose dans une population à sujets Agés HYpertendus présentant des troubles cognitifs DEbutants) study. The aim of the study was to assess therole of vascular and genetic parameters in the development of cognitive decline in old hypertensive subjects40.
Participants were men and women aged over 60 years at baseline examination with a history of hypertension and subjective cognitive complaint. A total of 378 hypertensive men and women were recruited between September 2003 and August 2005 (baseline examination); of these, 131 had a follow-up examinations 8 years later between
2011 and 201341. Among these patients (50% women), 72 had available DNA in sufficient quality and quantity
to perform LTL measurements from both baseline and follow-up examinations. The results of these 72 subjects are included in the present analysis. Mean age at baseline examination was 68 ± 5 (SD) years (age range at 60–81 years). The study was approved by the local Research Ethics Committee (Comité de Protection des Personnes de Nancy, France) and all research was performed in accordance with relevant guidelines and regulations. All par-ticipants signed an informed consent form.
Kolmogorov distances Propor tion (%) 0.00 0.02 0.04 0.06 0.08 0.10 05 10 15 20 25 30 35 intra−subjects inter−subjects
Figure 5. Distributions of Kolmogorov distances (KD) between pairs of individuals with similar mLTL (inter-subject) and between baseline vs. follow-up visits in all individuals (intra-(inter-subject). Normalised histograms for intra-subject distances (in red, mean = 0.0258) and inter-subject (with similar mLTL) distances (in blue, mean = 0.0374). Intra-subject KDs measure the differences in TLTLD between baseline and follow-up of the 72 subjects. Inter-subject KDs measure the differences in LTLD of 86 pairs of subjects with similar mLTL (less than 40 bp difference). For abbreviations see legends of Figures 1 and 2.
www.nature.com/scientificreports/
Leukocyte telomere length (LTL) measurements.
White blood cell DNA was extracted from wholeblood after red cell osmotic lysis by a salting out method as described previously42. All DNA samples were verified
for integrity by resolving 100 ng of each sample on a 1% (wt/vol) agarose gel. LTL was measured by Southern
blot of the TRF, as described previously11. Briefly, DNA samples were digested (37 °C) overnight with the
restric-tion enzymes Hinf I and Rsa I (Roche Diagnostics GmbH, Germany). Digested DNA samples and DNA ladders were resolved on 0.5% (wt/vol) agarose gels. After 23 h, the DNA was depurinated, denatured, neutralised and transferred onto a positively charged nylon membrane (Roche) using a vacuum blotter (Biorad, Hercules, CA). Membranes were hybridised at 42 °C with a DIG-labelled telomeric probe after which the probe was detected by the DIG luminescent detection procedure (Roche) and exposed on CCD camera (Las 4000, Fuji). Optical density values (OD) versus DNA migration distances obtained from raw data were converted to OD/MW versus MW
using a 4th degree polynomial function transformation of DNA migration distance (mm) in MW (kb) owing to
DNA ladders. Mean TRF was calculated and the TRF distribution observed in the 3 kb–20 kb range.
Baseline and follow-up samples from each subject were run in adjacent lanes (Supplementary Fig. S1). Measurements were performed in duplicate on separate membranes with an inter-assay variation coefficient of 1.2% on mLTL.
Leukocyte Telomere Length Distribution (LTLD) computations.
The proportion of leukocyte tel-omeres with weight MW was calculated for each MW value between the 3 kb–20 kb range for a given DNA sam-ple (Fig. S1); the LTL distribution (LTLD) was obtained as the function:∑
= =
LTLD MW OD MW
T T OD MW
( ) / , where /
where for each MW value, OD/MW is proportional to the number of leukocyte telomeres with weight MW in the DNA sample and LTLD (MW) ranges between 0 and 1.
Properties of the LTLD function. This approach provides different information than the OD, since LTLD (MW) is
a relative value taking into account the entire range of the TRF between 3 kb–20 kb, contrary to the OD value which is dependent on measurement conditions and starting material. For example, if LTLD(MW1) > LTLD(MW2) for two different values of MW1 and MW2, this indicates that there are more telomeres with weight MW1 than tel-omeres with weight MW2 in the DNA sample. This information is not provided by the corresponding values of OD1 and OD2. Indeed, OD is only proportional to the number of kb (number of telomeres*length of telomeres). LTLD therefore represents a probability distribution over the values of MW in the 3 kb–20 kb range of the DNA sample. The mean of this LTLD is obtained by the formula:
∑
= = ∑ ∑ Mean TLD MWOD MW T OD OD MW ( ) / / MW MW MWand corresponds to the mean TRF value, typically calculated and generally used in the analysis (mLTL). The var-iance is obtained by the following formula:
= ∑ ∗ ∑ − ∑∑ Var TLD OD MW OD MW OD OD MW ( ) / / MW MW MW MW 2
The LTLD is a probability distribution, whose cumulative distribution function (CDF) is defined as the function:
∑
= ′≤ ′ CDF MW( ) LTLD MW( ) MW MWFor a given MW, CDF(MW) is the proportion of values that are less than MW in the DNA sample. For any value p in [0,1], the p-quantile of the LTLD is
= ≥
qp inf MW{ , such thatCDF MW( ) p}
and a proportion p of leukocyte telomeres in the sample is smaller than qp. In particular, q1/2 is the median of the
leukocyte telomere lengths of the current DNA sample.
Translation for all DNA samples. In order to study the shape of the distribution (disregarding the central
param-eters) and allow comparisons between DNA samples, a translated telomere length distribution (TLTLD) was defined as follows:
=
(
+ − . .)
TLTLD MW( ) LTLD MW q1/2 5 5
This is a probability distribution with a median equal to 5.5 kb. This translation was applied to each DNA sample. TLTLD has the same shape as the original distribution (LTLD) and the choice of 5.5 kb does not change the result or the analysis. Indeed, this value only translates all of the TLTLD by a same amount of kb, which could have been 10 kb or 20 kb. The 5.5 kb value was chosen given its proximity to the median of most measured LTLD. LTLD and TLTLD are graphically represented by their density
The Kolmogorov distance. To allow comparison of the shape between DNA samples, the Kolmogorov distance43
between the probability TLTLD measurements for two different DNA samples was chosen, and defined as:
= + − . − + − .
Kol TLTLD TLTLD( 1, 2) maxMW(CDF MW1( q1/2 5 5) CDF MW2( q1/2 5 5))
Note that the value of Kol(TLTLD1, TLTLD2) is independent of the choice of 5.5 kb of the translation.
Statistical analysis.
Descriptive values are expressed as mean ± standard deviation (SD) and percentages. mLTL attrition was calculated from the difference between mLTL at baseline and mLTL at follow-up, divided by the duration of the follow-up.The relationship between mLTL at baseline and mLTL at follow-up was determined using Pearson’s correla-tion coefficients. Paired T tests were performed to compare parameters between baseline and follow-up visits. T tests were performed to compare intra-subject Kolmogorov distances versus inter-subject Kolmogorov distances. A p-value < 0.05 was regarded as statistically significant. Statistical analyses were carried out using the NCSS 9 statistical software package (NCSS, Kaysville, UT) and R statistical software.
Data Availability
The R script and datasets generated during and/or analysed during the current study are available from the cor-responding author on reasonable request.
References
1. de Lange, T. How telomeres solve the end-protection problem. Science 326, 948–952 (2009).
2. Harley, C. B., Futcher, A. B. & Greider, C. W. Telomeres shorten during ageing of human fibroblasts. Nature 345, 458–460 (1990). 3. d’Adda di Fagagna, F. et al. A DNA damage checkpoint response in telomere-initiated senescence. Nature 426, 194–198 (2003). 4. Youngren, K. et al. Synchrony in telomere length of the human fetus. Hum. Genet. 102, 640–643 (1998).
5. Haycock, P. C. et al. Leucocyte telomere length and risk of cardiovascular disease: systematic review and meta-analysis. BMJ 349, g4227 (2014).
6. D’Mello, M. J. J. et al. Association between shortened leukocyte telomere length and cardiometabolic outcomes: systematic review and meta-analysis. Circ. Cardiovasc. Genet. 8, 82–90 (2015).
7. Cai, Z., Yan, L.-J. & Ratka, A. Telomere Shortening and Alzheimer’s Disease. NeuroMolecular Med. 15, 25–48 (2012). 8. Forero, D. A. et al. Telomere length in Parkinson’s disease: A meta-analysis. Exp. Gerontol. 75, 53–55 (2016).
9. Balasubramanyam, M., Adaikalakoteswari, A., Monickaraj, S. F. & Mohan, V. Telomere shortening & metabolic/vascular diseases.
Indian J. Med. Res. 125, 441–450 (2007).
10. Rode, L., Nordestgaard, B. G. & Bojesen, S. E. Peripheral blood leukocyte telomere length and mortality among 64,637 individuals from the general population. J. Natl. Cancer Inst. 107, djv074 (2015).
11. Kimura, M. et al. Measurement of telomere length by the Southern blot analysis of terminal restriction fragment lengths. Nat. Protoc.
5, 1596–1607 (2010).
12. Cawthon, R. M., Smith, K. R., O’Brien, E., Sivatchenko, A. & Kerber, R. A. Association between telomere length in blood and mortality in people aged 60 years or older. Lancet 361, 393–395 (2003).
13. Baerlocher, G. M., Vulto, I., Jong, Gde & Lansdorp, P. M. Flow cytometry and FISH to measure the average length of telomeres (flow FISH). Nat. Protoc. 1, 2365 (2006).
14. Bendix, L., Horn, P. B., Jensen, U. B., Rubelj, I. & Kolvraa, S. The load of short telomeres, estimated by a new method, Universal STELA, correlates with number of senescent cells. Aging Cell 9, 383–397 (2010).
15. Lai, T.-P. et al. A method for measuring the distribution of the shortest telomeres in cells and tissues. Nat. Commun. 8, 1356 (2017). 16. Elbers, C. C. et al. Comparison between southern blots and qPCR analysis of leukocyte telomere length in the health ABC study. J.
Gerontol. A. Biol. Sci. Med. Sci. 69, 527–531 (2014).
17. Martin-Ruiz, C. M. et al. Reproducibility of telomere length assessment: an international collaborative study. Int. J. Epidemiol. 44, 1673–1683 (2015).
18. Verhulst, S. et al. Commentary: The reliability of telomere length measurements. Int. J. Epidemiol. 44, 1683–1686 (2015). 19. Aviv, A. et al. Impartial comparative analysis of measurement of leukocyte telomere length/DNA content by Southern blots and
qPCR. Nucleic Acids Res. 39, e134 (2011).
20. Steenstrup, T. et al. Leukocyte telomere dynamics in the elderly. Eur. J. Epidemiol. 28, 181–187 (2013).
21. Hemann, M. T., Strong, M. A., Hao, L.-Y. & Greider, C. W. The Shortest Telomere, Not Average Telomere Length, Is Critical for Cell Viability and Chromosome Stability. Cell 107, 67–77 (2001).
22. Zou, Y., Sfeir, A., Gryaznov, S. M., Shay, J. W. & Wright, W. E. Does a sentinel or a subset of short telomeres determine replicative senescence? Mol. Biol. Cell 15, 3709–3718 (2004).
23. Xu, Z., Duc, K. D., Holcman, D. & Teixeira, M. T. The length of the shortest telomere as the major determinant of the onset of replicative senescence. Genetics 194, 847–857 (2013).
24. Aubert, G., Baerlocher, G. M., Vulto, I., Poon, S. S. & Lansdorp, P. M. Collapse of telomere homeostasis in hematopoietic cells caused by heterozygous mutations in telomerase genes. PLoS Genet. 8, e1002696 (2012).
25. Benetos, A. et al. Short Leukocyte Telomere Length Precedes Clinical Expression of Atherosclerosis: The Blood-and-Muscle Model.
Circ. Res. 122, 616–623 (2018).
26. Jenkins, E. C. et al. Telomere shortening in T lymphocytes of older individuals with Down syndrome and dementia. Neurobiol. Aging
27, 941–945 (2006).
27. Tentolouris, N. et al. White blood cells telomere length is shorter in males with type 2 diabetes and microalbuminuria. Diabetes Care
30, 2909–2915 (2007).
28. Sawhney, V. et al. Telomere shortening and telomerase activity in ischaemic cardiomyopathy patients - Potential markers of ventricular arrhythmia. Int. J. Cardiol. 207, 157–163 (2016).
29. Harbo, M. et al. The relationship between ultra-short telomeres, aging of articular cartilage and the development of human hip osteoarthritis. Mech. Ageing Dev. 134, 367–372 (2013).
30. Harbo, M. et al. The distribution pattern of critically short telomeres in human osteoarthritic knees. Arthritis Res. Ther. 14, R12 (2012).
31. Guan, J. Z. et al. Change in the telomere length distribution with age in the Japanese population. Mol. Cell. Biochem. 304, 353–360 (2007).
32. Benetos, A. et al. Tracking and fixed ranking of leukocyte telomere length across the adult life course. Aging Cell 12, 615–621 (2013). 33. Verhulst, S. et al. A short leucocyte telomere length is associated with development of insulin resistance. Diabetologia 59, 1258–1265
www.nature.com/scientificreports/
34. Toupance, S. et al. Short Telomeres, but Not Telomere Attrition Rates, Are Associated With Carotid Atherosclerosis. Hypertension
70, 420–425 (2017).
35. Daniali, L. et al. Telomeres shorten at equivalent rates in somatic tissues of adults. Nat. Commun. 4, 1597 (2013).
36. Werner, B. et al. Reconstructing the in vivo dynamics of hematopoietic stem cells from telomere length distributions. eLife 4 (2015). 37. Sabharwal, S. et al. Telomere length dynamics in early life: the blood-and-muscle model. FASEB J. 32, 529–534 (2018).
38. Guan, J.-Z., Guan, W. P., Maeda, T. & Makino, N. Changes in telomere length distribution in low-dose X-ray-irradiated human umbilical vein endothelial cells. Mol. Cell. Biochem. 396, 129–135 (2014).
39. Maeda, T., Guan, J.-Z., Koyanagi, M. & Makino, N. Alterations in the telomere length distribution and the subtelomeric methylation status in human vascular endothelial cells under elevated temperature in culture condition. Aging Clin. Exp. Res. 25, 231–238 (2013). 40. Kearney-Schwartz, A. et al. Vascular structure and function is correlated to cognitive performance and white matter hyperintensities
in older hypertensive patients with subjective memory complaints. Stroke 40, 1229–1236 (2009).
41. Ferreira, J. P. et al. Memory Alterations and White Matter Hyperintensities in Elderly Patients With Hypertension: The ADELAHYDE-2 Study. J. Am. Med. Dir. Assoc. 18, 451.e13–451.e25 (2017).
42. Miller, S. A., Dykes, D. D. & Polesky, H. F. A simple salting out procedure for extracting DNA from human nucleated cells. Nucleic
Acids Res. 16, 1215 (1988).
43. Hájek, J. A course in nonparametric statistics. (Holden-Day, 1969).
Acknowledgements
The authors wish to thank Cécile LAKOMY for her technical assistance in the DNA extractions of the samples from the second ADELAHYDE visit and Pierre POTHIER for his critical review and language corrections. This work was supported by the French national program PHRC 2010-A01399-30, the regional project CPER-ITM2P 2015-2020, the French PIA project « Lorraine Université d’Excellence », reference ANR-15-IDEX-04-LUE and the Investments for the Future program under grant agreement No. ANR-15-RHU-0004.
Author Contributions
S.T., A.B. designed experiments; S.T. performed experiments; D.V., D.G., A.G.-P., performed LTLD computations; S.T., D.V., D.G., A.G.-P., E.A., analysed data; E.A., A.B. supervised analysis and S.T., D.V., A.G.-P., E.A., A.B. wrote the manuscript.
Additional Information
Supplementary information accompanies this paper at https://doi.org/10.1038/s41598-018-36756-8. Competing Interests: The authors declare no competing interests.
Publisher’s note: Springer Nature remains neutral with regard to jurisdictional claims in published maps and institutional affiliations.
Open Access This article is licensed under a Creative Commons Attribution 4.0 International License, which permits use, sharing, adaptation, distribution and reproduction in any medium or format, as long as you give appropriate credit to the original author(s) and the source, provide a link to the Cre-ative Commons license, and indicate if changes were made. The images or other third party material in this article are included in the article’s Creative Commons license, unless indicated otherwise in a credit line to the material. If material is not included in the article’s Creative Commons license and your intended use is not per-mitted by statutory regulation or exceeds the perper-mitted use, you will need to obtain permission directly from the copyright holder. To view a copy of this license, visit http://creativecommons.org/licenses/by/4.0/.