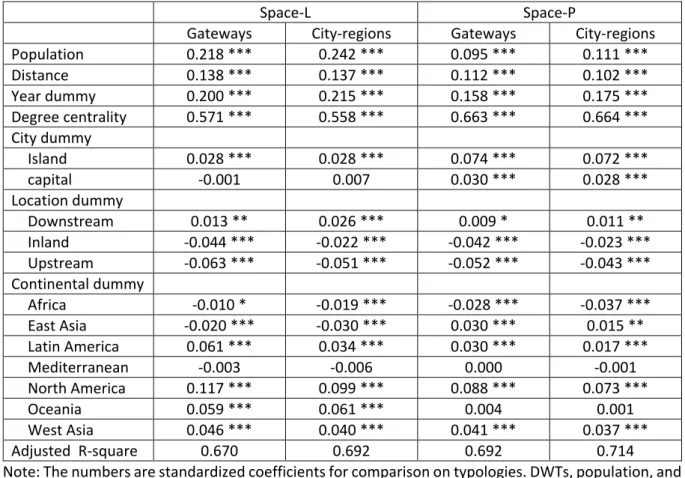
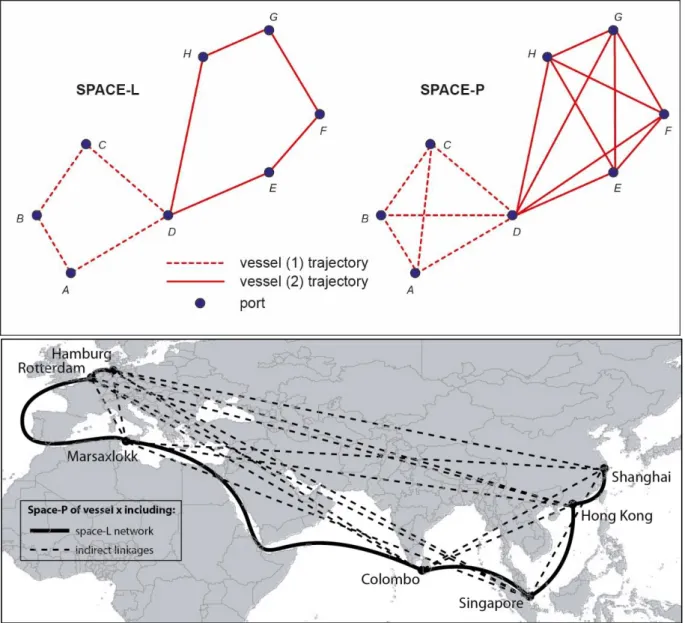
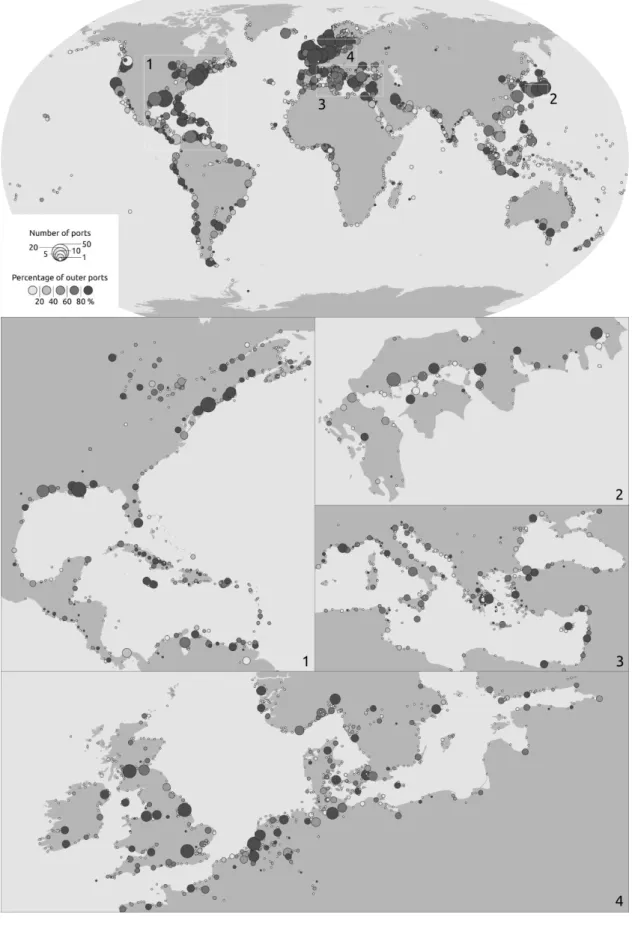
Urban gravity in the global container shipping network
Texte intégral
Figure


Documents relatifs
The composition of the tribological films formed in the presence of ZnDTP is heterogeneous, with longer poly- phosphate chain lengths being present in the outermost layer and a layer
RESUME
Les conséquences sociales de l’aménagement des territoires agraires au Mont Liban se lisent dans la construction progressive, depuis la fin d u M oyen  ge, d ’une identité
S’il ne (le) ramène pas et ne (le) donne pas, il encourra le châtiment du roi. Il est donc difficile d’affirmer quoi que ce soit. Cependant, YNER 1 7 étant muet quant au patronyme de
and calcite crystallises within faults during their activity (syn- tectonic calcite) or after fault death (post-tectonic calcite). Measuring the U/Th isotopes in these
After describing the site and experimental setup, the aims of this paper are to (1) analyze variations in observed aerosol optical properties in relation with changes in
The effect of this vertical gradient on our modeling results is obvious: trajectories starting near the ocean surface start with vapor with a much lower initial d excess value (from
To better document the role of RH on SVM, estimates of liquid water content (LWC) in aerosols were derived from light scattering coefficient and integrated aerosol volume
