HAL Id: cea-02883393
https://hal-cea.archives-ouvertes.fr/cea-02883393
Submitted on 29 Jun 2020HAL is a multi-disciplinary open access archive for the deposit and dissemination of sci-entific research documents, whether they are pub-lished or not. The documents may come from
L’archive ouverte pluridisciplinaire HAL, est destinée au dépôt et à la diffusion de documents scientifiques de niveau recherche, publiés ou non, émanant des établissements d’enseignement et de
From Protein Corona to Colloidal Self-Assembly: The
Importance of Protein Size in Protein-Nanoparticle
Interactions
Laurent Marichal, Jéril Degrouard, Anouchka Gatin, Nolwenn Raffray,
Jean-Christophe Aude, Yves Boulard, Sophie Combet, Fabrice Cousin,
Stéphane Hourdez, Jean Mary, et al.
To cite this version:
Laurent Marichal, Jéril Degrouard, Anouchka Gatin, Nolwenn Raffray, Jean-Christophe Aude, et al.. From Protein Corona to Colloidal Self-Assembly: The Importance of Protein Size in Protein-Nanoparticle Interactions. Langmuir, American Chemical Society, 2020, 36, pp.8218-8230. �10.1021/acs.langmuir.0c01334�. �cea-02883393�
From Protein Corona to Colloidal Self-Assembly:
The Importance of Protein Size in
Protein-Nanoparticle Interactions
Laurent Marichala,b*, Jéril Degrouardc, Anouchka Gatina, Nolwenn Raffraya, Jean-Christophe Audeb, Yves Boulardb, Sophie Combetd, Fabrice Cousind, Stéphane Hourdeze, Jean Marye,
Jean-Philippe Renaulta, Serge Pina*
aUniversité Paris-Saclay, CEA, CNRS, NIMBE, 91190 Gif-sur-Yvette, France
bUniversité Paris-Saclay, CEA, CNRS, I2BC, B3S, 91190 Gif-sur-Yvette, France
cUniversité Paris-Saclay, CNRS, Laboratoire de Physique des Solides, 91405 Orsay, France
dUniversité Paris-Saclay, Laboratoire Léon-Brillouin, UMR 12 CEA-CNRS, CEA-Saclay, 91191
Gif-sur-Yvette Cedex, France
eSorbonne Université, CNRS, Lab. Adaptation et Diversité en Milieu Marin, Team DYDIV,
Station Biologique de Roscoff, 29680 Roscoff, France
Corresponding Authors
Laurent Marichal*: laurent.marichal@universite-paris-saclay.fr
Serge Pin*: serge.pin@cea.fr
ABSTRACT
Protein adsorption on nanoparticles is an important field of study, particularly with regard to
nanomedicine and nanotoxicology. Many factors can influence the composition and structure of
the layer(s) of adsorbed proteins, the so-called “protein corona”. However, the role of protein size
has not been specifically investigated, although some evidence has indicated its potential large role
for corona composition and structure. To assess the role of protein size, we studied the interactions
of hemoproteins (spanning a large size range) with monodisperse silica nanoparticles. We
combined various techniques — adsorption isotherms, isothermal titration calorimetry, circular
dichroism, and transmission electron cryomicroscopy — to address this issue. Overall, results
show that small proteins behaved as typical model proteins, forming homogenous monolayers on
the nanoparticle surface (protein corona). Their adsorption is purely enthalpy-driven, with subtle
structural changes. In contrast, large proteins interact with nanoparticles via entropy-driven
mechanisms. Their structure is completely preserved during adsorption and any given protein can
directly bind to several nanoparticles forming bridges in these newly formed protein-nanoparticle
assemblies. Protein size is clearly an overlooked factor that should be integrated in proteomics and
toxicological studies.
TEXT
Adsorption phenomena and, in particular, protein adsorption have been studied for more than a
century.1,2 Recently, protein adsorption has regained importance due to the development of
nanoscience and nanotechnology,3–5 and the subsequent manufacture of large amounts of
engineered nanomaterials. Their applications are numerous in the environmental, agri-food, health,
and pharmaceutical sectors. For example, nanoparticles (NPs) are used in medicines to prevent
and treat diseases, including those used in vaccines, diagnostic probes, targeted drug delivery,
material biocompatibility (implants), molecular imaging, and theranostic applications.6–9 The field
of nanotoxicology is concomitantly being developed to assess the risks and potential pernicious
effects of exposure to NPs on health and the environment.10–13 The main issue for the development
of engineered NPs is the fact that, in vivo, NP physicochemical properties are usually totally
distinct from their pristine state. In biological media, NPs are promptly covered by molecules
(proteins, lipids, metabolites) that can bind to their surface and form a “biomolecular corona”,
giving NPs their biological identity.14–16 The new entity can induce specific cellular recognition
mechanisms causing cellular uptake, which strongly depends on the composition of the corona.17– 19 Moreover, it is now well established that the most studied type of interacting biomolecules —
proteins — can induce deleterious biological effects by modifying their structure (often by partial
loss of secondary structure),20–22 and/or their function (protein activity can increase or decrease)23– 25 when adsorbed on NPs.
In a complex biological environment, many physicochemical factors can influence protein-NP
interactions. A recent report established a comprehensive list of factors that have been shown to
govern protein adsorption on NPs.26 These factors are linked to the intrinsic properties of the NPs,
of the nano-bio interface triangle.27–29 Among all these physicochemical factors, some have been
extensively studied, such as the size/curvature effect of NPs,30–32 the physicochemical properties
of protein sequences,33–36 or the pH effect of the surrounding environment.37–39 Others have not
been as thoroughly examined, but may prove crucial in specific conditions (e.g., NP roughness,
dynamic flow, temperature).40–42
Non-covalent interactions of proteins with other molecules or with surfaces are often described
in terms of electrostatic and hydrophobic interactions and, to a lesser extent, hydrogen bounds and
Van der Waals forces.43 A common way proteins can interact is through distortion of their internal
structure. One model proposed by W. Norde predicts the adsorption or non-adsorption of proteins
on a surface by using a relationship between the protein structural stability and its adsorption
behavior.20,44 In this context, proteins with low structural stability (“soft proteins”) are
preferentially adsorbed and their adsorption results in structural reorganization. On the contrary,
proteins with a strong internal stability (“hard proteins”) tend to not contribute to adsorption and,
when they do, to not undergo any significant structural rearrangements. In more recent years,
statistical comparative analyses32,33,36 revealed that the main physicochemical factors relevant for
protein adsorption on silica NPs include i) an enrichment in positively charged amino acids,
particularly in arginine residues (forming electrostatic interactions with the negatively charged
silica surface), and ii) an enrichment in disordered regions — and conversely a depletion in
structured regions — confirming the hard/soft protein paradigm in the case of silica NPs.
Besides electrostatic interactions and disordered regions, protein size may also be an important
parameter in determining corona composition. For instance, in coronas, there is an enrichment of
high molecular weight proteins compared with their natural abundance in the medium.32 This
protein size for protein adsorption. First, protein size has a large influence on adsorption kinetics,
because small proteins get adsorbed faster (due to higher diffusion rates), but get replaced by larger
proteins that can bind more strongly to the surface due to a larger contact area. This is one of the
five proposed causes of the sequential adsorption mechanism called “Vroman effect” (abundant
but low affinity proteins interact first on a surface then get replaced by proteins with higher
affinity),47 and can have obvious consequences in terms of protein corona composition. Another
effect caused by protein size is its correlation with adsorbent capacity.45 Large proteins form
thicker 3D interphases that separate the physical surface of the material from the bulk solution.
Thus, these increased interfacial volumes can hold higher amounts of proteins compared to those
formed by small proteins. Finally, a classification of proteins that combines Norde’s paradigm
with protein size has been proposed:46 small and rigid proteins (e.g., lysozyme, β-lactoglobulin)
that behave as “hard proteins”, intermediate-size proteins (e.g., albumin, transferrin) being able to
undergo conformational reorientations upon surface contact like “soft proteins”, and
high-molecular-weight proteins including lipoproteins and glycoproteins whose behavior is essentially
dominated by the content of lipids or glycans. However, in this classification, protein size is not
the only factor at play and no size effect can be extrapolated. Many studies comparing proteins of
different sizes were not specifically designed to address this factor and used proteins with highly
different physicochemical properties, such as isoelectric point, secondary structure, shape
(globular or fibrillar), or dynamics. Therefore, a direct protein size effect cannot be established.
The aim of this study was to evaluate the effect of protein size on protein-NP interactions. The
NPs used were spherical silica NPs whose size is commensurate with the proteins of interest (13.0
nm of radius). In order to unambiguously assess the protein size effect, this study was designed to
possible, and iii) well-characterized proteins. For these reasons, we chose proteins from the same
family: hemoproteins. They consist of varying numbers of subunits that possess a highly structured
polypeptidic chain with a globin fold. To analyze the effect of protein size, we selected horse
myoglobin (denoted Mb), pig hemoglobin (Hb), Riftia pachyptila coelomic hemoglobin (HbC1),
and Arenicola marina hemoglobin (HbAm) which have molecular weights of 17, 65, 400, and
3600 kDa,48–52 corresponding to radii of gyration of 1.4, 2.3, 6.0, and 11.0 nm, respectively.
Interestingly, these hemoproteins respectively contain 1, 4, 24, or 144 similar subunits that can be
considered as multimers of Mb (Figure S1). Overall, this size range covers almost every protein
found in cells,53 either in their free state or bound to protein complexes (e.g., ribosomes,
nucleosomes, etc.).
The originality of this study lies in the selection of proteins with highly similar biochemical,
functional, and structural properties whose size is the only variable. Adsorption isotherms,
determined by solution depletion and by isothermal titration calorimetry, circular dichroism, and
transmission electron cryomicroscopy experiments were combined to investigate the adsorption
behaviors of proteins of different sizes, as well as the thermodynamics and structural consequences
of their adsorption. With changes in both affinity constant, structural stability, and thermodynamic
Results and Discussion
Protein and Nanoparticle Characterization
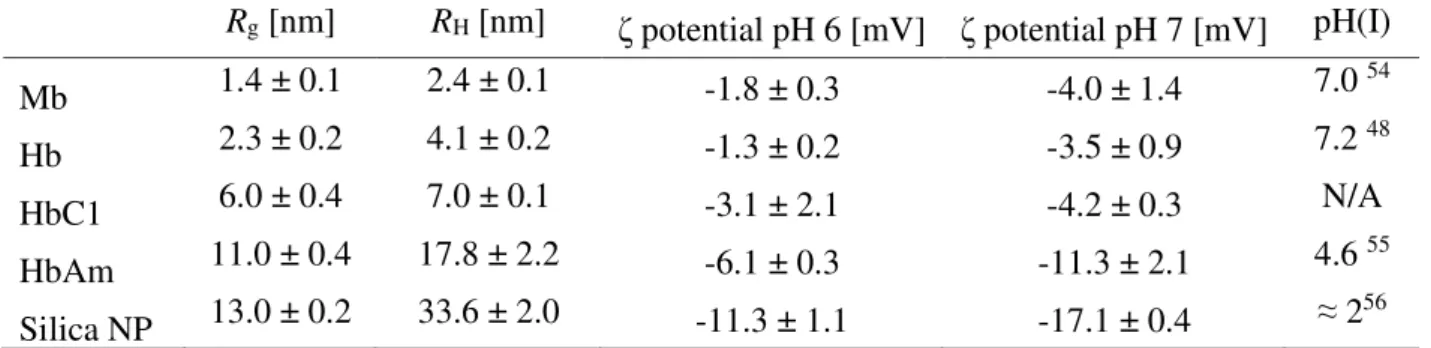
Table 1. Physicochemical characteristics of the hemoproteins and silica nanoparticles used
Rg [nm] RH [nm] ζ potential pH 6 [mV] ζ potential pH 7 [mV] pH(I)
Mb 1.4 ± 0.1 2.4 ± 0.1 -1.8 ± 0.3 -4.0 ± 1.4 7.0 54 Hb 2.3 ± 0.2 4.1 ± 0.2 -1.3 ± 0.2 -3.5 ± 0.9 7.2 48 HbC1 6.0 ± 0.4 7.0 ± 0.1 -3.1 ± 2.1 -4.2 ± 0.3 N/A HbAm 11.0 ± 0.4 17.8 ± 2.2 -6.1 ± 0.3 -11.3 ± 2.1 4.6 55 Silica NP 13.0 ± 0.2 33.6 ± 2.0 -11.3 ± 1.1 -17.1 ± 0.4 ≈ 256 Radius of gyration (Rg), hydrodynamic radius (RH), and zeta (ζ) potential of hemoproteins were measured in phosphate buffers (0.1 mol L-1), at pH 6 and pH 7. Isoelectric points (pH(I)) taken from the literature are also indicated. Mb, horse myoglobin; Hb, pig hemoglobin; HbC1, Riftia
pachyptila coelomic hemoglobin; HbAm, Arenicola marina hemoglobin. Standard deviations
come from data fitting (Rg) or from the variability between replicates (RH, ζ potential).
Before studying the protein size factor and its impact on protein adsorption, we have to define
protein size. In biology, protein size is generally defined by its molecular weight that can be
measured or directly calculated from the protein primary structure. A closely related parameter of
size — the sequence length — can also be used. From a physicochemical point of view, proteins,
like every macromolecular object, can be defined by geometric parameters; the most common ones
being the radius of gyration (Rg) and hydrodynamic radius (RH). Because protein folding generally
leads to globular structures comparable to spheres, molecular weight and geometric parameters are
intrinsically linked (Figures S2).57 Then, despite having specific meanings, all these parameters
relate to protein size and can, to some extent, be used interchangeably.
Prior to the experiments, the four hemoproteins were extensively characterized (Table 1).
chromatographic characteristics (Figures S3 and S4). Using small-angle neutron scattering and
based on the Guinier formalism, we measured their Rg (Figure S5), which ranged from 1.4 to 11.0
nm. Their RH, measured by dynamic light scattering, ranged from 2.4 to 17.8 nm. Zeta (ζ)
potentials, measured by electrophoretic light scattering, at pH 6 and pH 7, were negative in every
condition studied. The largest protein, HbAm, differed from the others by having larger negative
values at both pH values. However, the mathematical model used for ζ potential calculation —
namely the Smoluchowski approximation — assumes the presence of spherical objects.58 This
assumption is wrong in the case of HbAm which possess a particular hexagonal bilayer shape.51,59
Thus, for HbAm, ζ potential determination is unreliable.
Mb, Hb, and HbC1 consist exclusively of Mb-like subunits (1, 4, and 24, respectively) and
HbAm possesses 144 Mb-like subunits and 36 linker chains located inside the multimer that
stabilize the global structure by forming non-covalent bonds with subunits.59 Every Mb-like
subunit has the same phylogenetic origin and, despite having a large variability of primary
sequence, possesses a remarkably preserved globin fold that give them highly similar secondary
and tertiary structures.60,61 Thus, only the quaternary structure of the proteins (related to their
multimeric state) differs.62
The silica NPs used were monodisperse LUDOX TM-50 nanospheres that were thoroughly
characterized in our previous study (same batch).63 Their size (radius of 13.0 nm) measured by
small-angle neutron scattering (Table 1 and Figure S6) is commensurate with the size of the
largest protein, HbAm. These NPs were chosen because they combine a small size and a low
sensitivity to dissolution under our experimental conditions. Their negative ζ potentials confirm
the acidity of silica64 and indicate that the NP surface was negatively charged in the pH range of
Adsorption Isotherms
The quantification of molecular interactions is essential to understand the physicochemical
mechanisms at play. For instance, many techniques have been developed to assess binding affinity
and stoichiometry in protein-protein interactions (e.g., surface plasmon resonance, microscale
thermophoresis, analytical ultracentrifugation).65 However, each technique has limitations and
only a combination of techniques can depict a complete picture of the situation. Here, to
quantitatively assess the hemoprotein-NP interactions, we applied two adsorption isotherm
techniques: solution depletion (Figure 1) and isothermal titration calorimetry (ITC, Figures 2 and
S7 at pH 7 and 6, respectively). The first technique uses centrifugation to separate adsorbed
proteins from loosely bound (the so-called soft corona) and free proteins. This can lead to
limitations related to weakly bound proteins or NPs and proteins having similar sedimentation
coefficients.16,66,67 The second technique measures the change in heat in a solution during titration.
It does not require any labelling agent or separation step, but its drawbacks concern reactions not
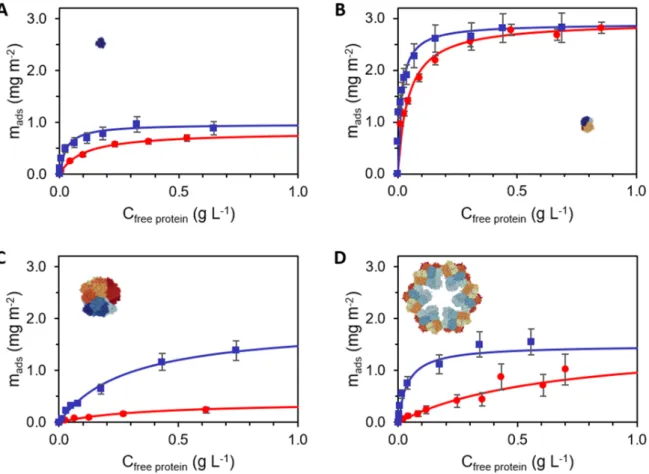
Figure 1. Adsorption isotherms of hemoproteins adsorbed on silica NPs: horse myoglobin (Mb)
(A), pig hemoglobin (Hb) (B), Riftia pachyptila coelomic hemoglobin (HbC1) (C), Arenicola
marina hemoglobin (HbAm) (D). Isotherms were performed in phosphate buffer (0.1 mol L-1) pH
6 (blue squares) or pH 7 (red circles). For each condition, at least three replicas were done. The
average values and standard deviations of the experimental points are shown. Data were fitted
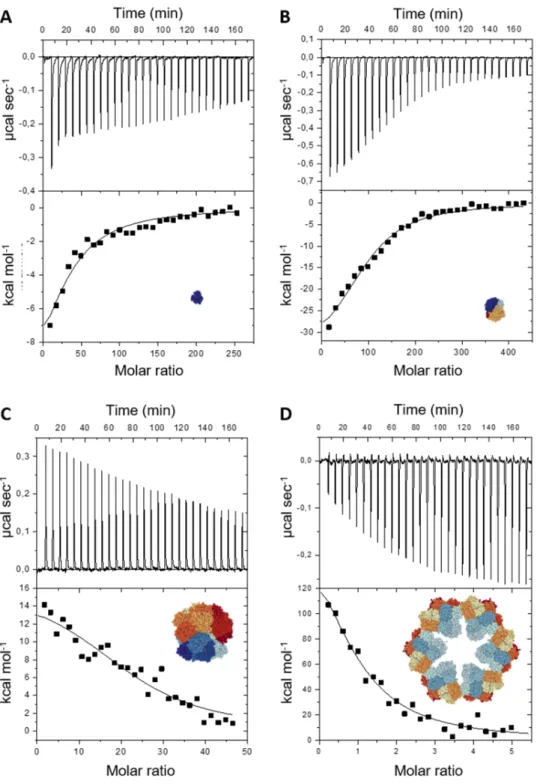
Figure 2. Isothermal titration calorimetry experiments of hemoproteins adsorbed on NPs in
phosphate buffer (0.1 mol L-1, pH 7): horse myoglobin (Mb) (A), pig hemoglobin (Hb) (B), Riftia
panels: raw data of the heat exchange. Each spike corresponds to one injection of protein solution
in a NP solution. Lower panels: Integrated heat of each injection after subtraction of the dilution
signal and titration curve fitted according to the SSIS model.
Table 2. Adsorption constants measured by isothermal titration calorimetry (ITC) (KI) and
solution depletion isotherms (Kads)
pH 6 pH 7
Protein KI [L mol-1] Kads [L mol-1] KI/Kads KI [L mol-1] Kads [L mol-1] KI/Kads
Mb 2.9 ± 1.9 x 10⁵ 5.4 ± 1.4 x 10⁵ 0.5 1.6 ± 0.5 x 10⁵ 1.7 ± 0.5 x 10⁵ 0.9
Hb 5.9 ± 1.4 x 10⁵ 4.0 ± 0.8 x 10⁶ 0.1 6.8 ± 1.1 x 10⁵ 1.9 ± 0.2 x 10⁶ 0.4
HbC1 4.6 ± 2.5 x 10⁶ 2.4 ± 0.3 x 10⁶ 1.9 8.1 ± 3.2 x 10⁵ 1.1 ± 0.7 x 10⁶ 0.7
HbAm 3.7 ± 1.6 x 10⁷ 8.3 ± 1.1 x 10⁷ 0.4 5.2 ± 3.9 x 10⁶ 5.7 ± 1.8 x 10⁶ 0.9
Measurements were taken in phosphate buffer (0.1 mol L-1) at pH 6 and pH 7. Mb, horse myoglobin; Hb, pig hemoglobin; HbC1, Riftia pachyptila coelomic hemoglobin; HbAm,
Arenicola marina hemoglobin. Standard deviations come from the variability between replicates.
Each hemoprotein-NP system was studied under two pH conditions (pH 6 and 7) to identify pH
dependency and potential effects of surface charge of proteins. Adsorption constants, which are
proportional to protein affinity, were deduced from these experiments (Table 2). In a number of
cases, the values measured by ITC (KI) and by solution depletion (Kads) were quite different, KI
values being smaller than Kads values. This can be explained by how proteins and NPs come into
contact. With the solution-depletion technique, protein solution is added all at once, whereas with
the ITC technique, the protein solution is added gradually. In the latter case, the nature of the NP
surface evolves during the experiment with more and more proteins covering it. This leads to less
favorable conditions for the adsorption of additional proteins due to repulsion effects between
technique, identical trends could be observed. The smallest protein (Mb) always had the weakest
affinity, whereas the largest protein (HbAm) had the largest one, with up to two orders of
magnitude between both values. Intermediate-sized proteins, Hb and HbC1, had intermediate
affinities, not significantly different from one another. This pattern suggests that, if there is a strong
trend between protein size and its affinity for NPs, other factors may also be at play.
The affinity values were always smaller at pH 7 than at pH 6, regardless of the protein. This
difference can be explained by the change in surface charge under those pH values. With increasing
pH, silica and hemoproteins had more negatively charged surfaces (Table 1). For silica, this is
caused by the deprotonation of the main population of silanol groups that have a pKa of 5.6.69 For
hemoproteins, the change is due to their isoelectric point, which is either neutral or slightly acidic
(Table 1). Between pH 6 and pH 7, histidine moieties are the only moieties whose charge can
vary. Depending on their environment, their pKa ranges between 5 and 870 (e.g., 6 out of 11
histidine moieties of Mb had a pKa comprised between 5.5 and 7).71 Thus, at pH 7, histidine
moieties are far less likely to be protonated (i.e., positively charged) and thus to interact
electrostatically with the negatively charged silica surfaces. This pH dependency indicates that
electrostatic interactions promote hemoprotein adsorption on NPs. This was confirmed for Mb and
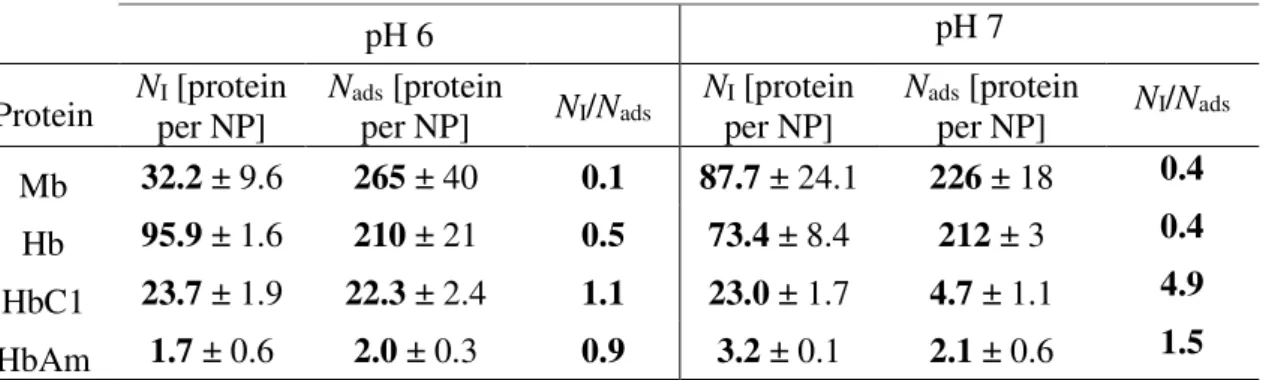
Table 3. Amounts of adsorbed protein per NP measured by isothermal titration calorimetry (ITC) (NI) and solution depletion isotherms (Nads)
pH 6 pH 7
Protein Nper NP] I [protein Nads [protein per NP] NI/Nads Nper NP] I [protein Nads [protein per NP] NI/Nads
Mb 32.2 ± 9.6 265 ± 40 0.1 87.7 ± 24.1 226 ± 18 0.4
Hb 95.9 ± 1.6 210 ± 21 0.5 73.4 ± 8.4 212 ± 3 0.4
HbC1 23.7 ± 1.9 22.3 ± 2.4 1.1 23.0 ± 1.7 4.7 ± 1.1 4.9
HbAm 1.7 ± 0.6 2.0 ± 0.3 0.9 3.2 ± 0.1 2.1 ± 0.6 1.5
Measurements were taken in phosphate buffer (0.1 mol L-1) at pH 6 and pH 7. Mb, horse myoglobin; Hb, pig hemoglobin; HbC1, Riftia pachyptila coelomic hemoglobin; HbAm,
Arenicola marina hemoglobin. Standard deviations come from the variability between replicates.
The other constant measured by adsorption isotherm techniques was the stoichiometry (i.e., the
maximum number of adsorbed proteins per NP). Stoichiometries measured by ITC (NI) and by
solution depletion (Nads) were generally quite different for any given condition (Table 3). For Mb
and Hb, NI values were always a small fraction of Nads values (between 12% and 46%). This
difference shows that a significant part (more than half) of hemoproteins are adsorbed by athermic
phenomena or phenomena whose heat variations cancel each other out. This difference in
stoichiometry has already been observed with proteins adsorbed on hydroxyapatite68 and was
attributed to the existence of two types of binding sites: sites with measurable enthalpy that are
covered first and sites without measurable enthalpy. This interpretation empirically solves the
problem, but the physical reasons of the site differences are still missing. In the present case,
another athermic phenomenon can also be considered: hemoproteins mixed with silica NPs form
aggregates.63 Unbound and loosely bound proteins may then get trapped inside aggregates and be
counted as adsorbed proteins, overestimating the actual amount of adsorbed protein indicated by
quantifying surface coverages. Remarkably, NI and Nadsvalues of the large proteins, HbC1 and
HbAm, were fairly consistent both at pH 6 and 7. The only exception was for HbC1 at pH 7 where
NI was 5 times higher than Nads, and identical to the values found at pH 6. In this case, the
solution-depletion technique probably underestimated the stoichiometry. Due to pH effects, HbC1
interactions with NPs were weaker at pH 7 than at pH 6. Thus, this may be caused by a partial
desorption of the adsorbed proteins during centrifugation.73 If so, the centrifugation-based method
becomes unsuitable for stoichiometry measurement and milder separation techniques (e.g.,
chromatographic methods)16,67 may be more appropriate. This doesn’t necessarily apply to Kads
measurement. Indeed, Kads is determined mainly by the slope of the isotherm and highly depends
on the first points of the curve where all the NP surface is available. Despite being quite simple,
silica surface has a mix of potential binding sites with different affinities.64 The highest affinity
sites are populated first and Kads reflects their affinity. Proteins bound to high affinity sites will be
less sensitive to centrifugation effect. In less favorable conditions (pH 7) the number of high
affinity binding sites is likely reduced. However, this doesn’t necessarily interfere in Kads
measurement as long as a significant amount of proteins still strongly interacts. This is evidenced
by the lower but non-zero Nads values at pH 7 compared to pH 6 for HbC1.
Comparing the Nads values from the solution-depletion method, Mb and Hb adsorbed similar
numbers of proteins on a NP surface (265 and 210 proteins per NP at pH 6, respectively). However,
due to the larger size of Hb, there was actually a three-fold increase in terms of protein mass for
Hb compared with Mb (Figure 1A and B). This difference had already been observed under other
physicochemical conditions (using the same method).38,63 However, in both cases, a monolayer of
adsorbed proteins formed, as confirmed by the hyperbolic shape of the isotherms, typical of a
and ≈ 2 proteins per NP, respectively). Using a simulation method developed previously,63,75 we
calculated a theoretical maximal number of proteins per NP based on the coverage of a sphere by
hard spheres of sizes similar to the hemoproteins. Up to 29 and 14 proteins (HbC1 and HbAm,
respectively) can potentially get adsorbed on the surface of each NP. Considering the necessary
approximations of this comparison, HbC1 may be able to completely cover the NP surface, but
HbAm is far from covering it.
Thermodynamics of Adsorption
ITC experiments (Figures 2 and S7) also showed that small and large proteins interact on NPs
with totally different calorimetric patterns, because the former had negative (exothermic) peaks
and the latter had positive (endothermic) peaks (except for HbAm at pH 6). This difference
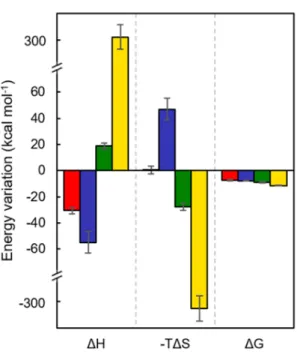
translates into fundamentally distinct thermodynamic parameters (Figure 3 for values at pH 7 and
Table S1 for values at both pH whose trends are comparable): small proteins have enthalpy-driven
interactions (negative ΔH) and large proteins have entropy-driven interactions (negative -TΔS).
During an adsorption process, variations in enthalpy can be associated with the number and
strength of anchor residue contacts.76 On the other hand, variations in entropy are more complex
to interpret, but can be globally regarded as a measure of the configuration space of the particles.77
Here, this configurational entropy had many components: conformational entropy (i.e., the entropy
associated with the number of distinct conformational states that are accessible to the
surface-bound protein), translational and rotational entropies of the proteins, and buffer entropy (i.e., the
degree of freedom of water molecules and ions).76–78
Adsorption phenomena are both enthalpy- and entropy-driven, but one component usually
predominates. In the case of Mb and Hb, the negative contribution of ΔS can be interpreted as a
loss of entropy is compensated by a gain in energy of the protein-NP complex in the form of
electrostatic interactions. There are a sufficient number of anchor contacts (electrostatic
interactions) to keep the protein adsorbed. However, for HbC1 and HbAm, protein-surface
electrostatic interactions, which are supported by the observed pH effects, were not the driving
force and seem to not even compensate for the probable disruption of intra-protein interactions (as
suggested by the positive ΔH values). The large increase in the entropy in these systems was clearly
the driving force.
Figure 3. Thermodynamic values of hemoproteins adsorbed on silica NPs based on the ITC
experiments done in phosphate buffer (0.1 mol L-1, pH 7). Variations of free energy (ΔG), enthalpy
(ΔH), and entropy (-TΔS) for horse myoglobin (Mb) (red), pig hemoglobin (Hb) (blue), Riftia
pachyptila coelomic hemoglobin (HbC1) (green), Arenicola marina hemoglobin (HbAm)
We can distinguish local molecular entropic effects from global ones. Among local effects, the
first entropy-driven mechanism is the destructuration of proteins, either by multimeric disassembly
or by unfolding. This explanation has a long history in protein adsorption.44 In addition, one can
also mention an increase in solvent entropy due to the expulsion of ions and water molecules
ordered at the surface. This is the origin of hydrophobic interactions and is also at play during
adsorption.44 It has been shown with peptides and proteins adsorbed on charged surfaces that, in
some cases, solvent entropy gains can be larger than the decrease in conformational entropy of the
bound molecule.78,79 Also, there is a direct link between protein size and the number of water
molecules that can be displaced during adsorption.45 Thus, for large proteins such as HbC1 and
HbAm, the increase in solvent entropy may dominate even more. We can also classify the
so-called chelate effect as a local effect. Although it has not been described as a chelate effect,
prestructuration of large multimeric proteins may induce similar positive cooperativity
phenomena: preexisting bonds cancel the entropic penalty of new bonds.80 Both HbC1 and HbAm
are highly multimeric and have many intra- and inter-helix interactions, especially disulfide and
ionic bonds formed by divalent cations,52,59 that are not present in Mb and Hb.48 Applied here, a
chelate effect may explain both the high affinity of HbC1 and HbAm for NPs and the entropic
nature of their adsorption on NPs. Finally, global effects give rise to the so-called entropic forces
in colloidal sciences.81 Colloid studies have revealed many entropy-driven transitions from
disorder to order.77
Structural Studies
Among all these possible explanations, some can be tested using structural analyses. To examine
potential structural changes upon adsorption, UV circular dichroism (CD) experiments were
CD spectrum characterized by a maximum at about 192 nm and two minima at 208 and 222 nm
(Figure S8). This pattern is typical of α-helix-rich proteins with the 192 and 208 nm bands
corresponding to the π → π* excitation transition (perpendicularly and parallel-polarized,
respectively) and the 222 nm band corresponding to the n → π* transition.82,83 The comparison
between free and adsorbed proteins shows different behaviors between the systems. The large
proteins, HbC1 and HbAm, did not exhibit any significant differences between adsorbed and free
proteins. However, the two small proteins, Mb and Hb, had weaker CD signals in the 208 and 222
nm regions for the adsorbed proteins, the decrease being much stronger in the 208 nm region.
Figure 4. Circular dichroism spectra of hemoproteins, free in solution (red lines) or adsorbed on
silica NPs (blue lines) in phosphate buffer (0.1 mol L-1, pH 7): horse myoglobin (Mb) (A), pig
hemoglobin (Hb) (B), Riftia pachyptila coelomic hemoglobin (HbC1) (C), Arenicola marina
hemoglobin (HbAm) (D). Csubunit = 3 µmol L-1. CNP varied between 1 and 20 g L-1.
Table 4. rα (θ222:θ208) ratios of hemoproteins, free in solution or adsorbed on silica NPs.
Protein proteins rα - free rα - proteins and NPs Mb 1.08 ± 0.01 1.27 ± 0.17
Hb 1.04 ± 0.01 1.51 ± 0.10
HbC1 1.06 ± 0.02 1.05 ± 0.06
HbAm 1.09 ± 0.02 1.10 ± 0.03
Values are the average of at least three independent replicates. Mb, horse myoglobin; Hb, pig hemoglobin; HbC1, Riftia pachyptila coelomic hemoglobin; HbAm, Arenicola marina hemoglobin. Uncertainty values (standard deviations) come from the adjustment of experimental data and from the use of replicates.
To quantify the dichroism discrepancy, we calculated the rα (θ222:θ208) ratios (Table 4). Free
hemoproteins had similar rα values (between 1.04 and 1.09), but adsorbed proteins had very
different rα values. HbC1 and HbAm kept the same rα values when adsorbed. However, Mb and
Hb had significantly higher rα values (1.27 and 1.51, respectively) compared with free proteins.
The rα ratio has been used to distinguish between two structural states of α-helix peptides,84–87
non-associated helices (for rα ≤ 1) and coiled-coil systems (for rα > 1). Applied to hemoproteins, a
coiled-coil formation seems unlikely. Indeed, after adsorption, Mb-like subunits keep their tertiary
structure63,72 and the linker chains of HbAm, which already have a coiled-coil conformation, are
located inside the multimer (not in direct contact with NPs).59 However, the change in r
caused by conformational changes happening in the α-helix structure as suggested for
tropomyosin.88 In our case, we hypothesize that a loss and/or rearrangement of the protein
hydrogen bond network occurs when hemoproteins get adsorbed. This rearrangement leads to
helix-NP surface interactions and possibly to new helix-helix interactions. Therefore, for small
proteins, conformational changes seem to occur and may be connected to functional changes
(oxygenation properties) previously seen on Hb adsorbed on NPs.25,38,63 However, this should not
be regarded as destructuration, because the changes are subtle and do not lead to a loss of shape or
function.63 For large proteins, the lack of differences can be explained by the fact that only a small
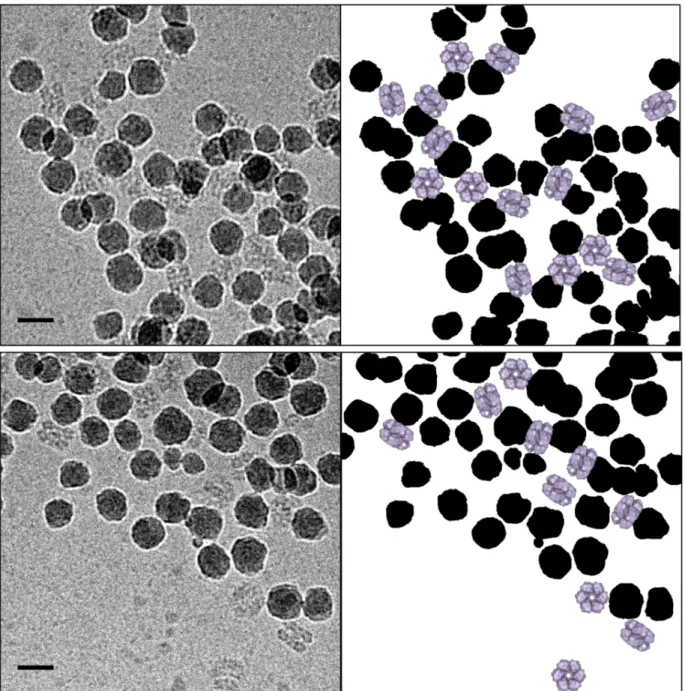
Figure 5. Cryo-TEM micrographs of HbAm proteins adsorbed on silica nanoparticles (NPs) in
phosphate buffer (0.1 mol L-1) at pH 6 (top) and 7 (bottom). The corresponding schematics
highlighting the orientation of the proteins (in purple) relative to the NPs (in black) are also given.
CHbAm = 0.4 g L-1, CNP = 3 and 6 g L-1 (pH 6 and 7, respectively) to obtain more than 80% of
Nevertheless, multimeric proteins may undergo disassembly processes that cannot be probed
using CD. The structure of adsorbed HbAm was thus assessed by taking cryo-TEM images of
HbAm adsorbed on NPs at pH 6 and pH 7 (Figure 5). In both cases, the typical hexagonal bilayer
shape of the protein was maintained (Figure S1)51 even when the protein was adsorbed. This
eliminates the hypothesis of subunit dissociation or large destructuration upon adsorption. In
addition, we can be more specific about the type of self-assembly observed here. HbAm and NPs
form open network structures.89 NPs did not seem to interact with more than two proteins (based
on a sample of seven images for each pH value). This is in agreement with the stoichiometries
found by isotherms and confirms the incomplete coverage of the surface by HbAm. Conversely,
each HbAm protein could interact with up to four NPs. In this case, we can even consider that NPs
are adsorbed on proteins, because HbAm and NPs have very similar sizes. In this network, much
of the NP surface is not available for any additional protein adsorption due to steric effects, thus
possibly explaining the very low stoichiometry values. Moreover, at pH 6, HbAm seemed to
interact with more NPs (up to 4 NPs per protein) than at pH 7, resulting in a higher aggregation
state and confirming pH dependency (Figure S9 shows the zoomed-out images displayed in
Figure 5 and highlights the differences of aggregation level). Finally, at both pH value, proteins
did not have specific orientations towards NPs. The binding site can be located either on one of
the faces (near the “hole”), on the side, or on one of the edges of the protein (Figure S10). This
nonspecific orientation suggests that HbAm do not maximize their interaction with the NPs. The
chelate effect and the water expulsion hypotheses are thus unlikely.
Therefore, having ruled out all local entropic considerations, we are left with the global entropic
explanation based only on the colloidal nature of the protein observed here. The nearest connection
entropic forces underlying such lattices is the conservation of a maximum degree of rotational
entropy.
These results, as well as previous results,25,38 show that adsorption on negatively charged NPs is
not detrimental to the native structure of hemoproteins, inducing only subtle structural
rearrangements, and preserving their biological oxygen-carrying function, which depends strongly
on tertiary and quaternary structures. Moreover, cryo-TEM images, as well as small-angle neutron
scattering experiments done with Mb and Hb interacting with NPs63 clearly showed that
hemoprotein-NP interactions lead to reaction-limited aggregation mechanisms. Many studies have
experienced NP aggregation in presence of proteins caused by unfolding of proteins during
adsorption.91–93 This NP aggregation phenomenon implies that protein unfolding can induce
protein-protein interactions, linking the NPs via their respective coronas. Here, protein-induced
NP assembly is clearly not caused by protein unfolding, but by proteins bridging the NPs, i.e., the
same protein can belong to two (or more) coronas forming an open network of proteins and NPs.
Although every hemoprotein seems to form networks, their exact structure is not known and may
differ depending on their size (formation of more or less close-knit networks).
Finally, based on these results, the classification of proteins between three classes (small and
hard proteins, intermediate and soft proteins, and high molecular weight proteins) proposed by
Rabe et al.46 should be reconsidered. Hemoproteins of any size are highly structured and don’t
suffer any large structural modifications during adsorption. Then, none of them belong to the soft
protein class despite covering the intermediate size range. Moreover, the high molecular weight
protein class is said to be determined by the content of lipids and glycans. None of them are present
in the hemoproteins studied (including the very high molecular weight HbAm). Eventually, based
the small size attributed to the hard protein class becomes wrong. Therefore, none of the classes
should be defined in terms of size and larger-scale studies should be designed in order to refine
this classification.
Conclusion
The present study demonstrated the existence of a protein-size effect in the case of hemoproteins
adsorbed on silica NPs. Large proteins tend to interact with more affinity for NPs than small
proteins. This may be of great importance when considering protein corona formation in complex
biological media where large proteins complexes are present. Until recently,32 proteomics studies
had not identified protein size as a determining factor for protein adsorption. This is partly due to
the fact that proteins are usually considered in terms of amino-acid sequences and that the actual
protein size — especially the size of large protein complexes — cannot be computationally
investigated by classical proteomics analyses.
We highlighted the fact that both techniques used to perform the isotherms have their limitations
that need to be acknowledged before any interpretation. Adsorption isotherms by solution
depletion are not well suited for weakly bound proteins. If this is the only isotherm technique used,
it would be of interest to quantify the binding strength of a given system using analytical
centrifugation.66 On the other hand, calorimetric isotherms are intrinsically limited by the fact that
all thermodynamic variations of a system are measured at the same time and that some of them
cancel each other out, concealing part of the information. A combination of techniques is definitely
the best approach to overcome these limitations.
Calorimetry experiments clearly showed that closely related proteins can have fundamentally
enthalpy-driven phenomena (i.e., electrostatic interactions) and large proteins adsorbing via entropy-enthalpy-driven
phenomena (several possible causes). Entropy-driven adsorption may be common for very large
proteins or protein complexes, which may behave as colloids.
Contrary to homogenous protein coronas formed by typical model proteins, large proteins tend
to form incomplete coronas. This can be easily explained by the fact that large proteins are more
likely to bind to several NPs causing the self-assembly of aggregated structures that prevent more
proteins from interacting with the empty surface due to steric effects.
Finally, each hemoprotein keeps its overall (quaternary) structure during adsorption. Yet, subtle
changes in the tertiary structure (i.e., organization of helices) occur for small proteins, but not for
large ones. These changes may explain the modifications in oxygenation properties found for Hb
adsorbed on silica NPs.25,38,63 The absence of any structural modification for large proteins may
also be of great interest for the design of hemoglobin-based oxygen carriers.25
Experimental Procedures Chemicals
Phosphate buffers were prepared by dissolving disodium phosphate (28029 VWR Chemicals,
purity ≥ 99.5%) and monosodium phosphate (28015 VWR Chemicals, purity ≥ 99%) salts in pure,
Milli-Q water (MilliPore, 18 MΩ cm).
Silica nanoparticles (LUDOX® TM-50, Merck) are nanospheres with a physical radius of 13.0
± 0.2 nm63. Shortly before the experiments, NPs were dialyzed twice against 100 volumes of pure
water for a minimum of 3h per dialysis to eliminate excess salts (using Spectra/Por™ 3.5 kDa
and the NP mass concentration was measured by desiccation (90°C, overnight) of 1 mL aliquots
and dry mass weighing.
Protein Preparation
Metmyoglobin from equine heart (Mb) was purchased as a lyophilized powder (M1882, Merck),
solubilized, dialyzed twice against 100 volumes of pure water at 4 °C, and centrifuged (20,000 g)
for 10 min before use. The Mb concentration was measured by spectrophotometry with ε623 = 3500
L mol-1 cm-1.48
Pig hemoglobin (Hb) was purified in its oxygenated form from fresh blood following standard
preparation94 using erythrocyte membrane precipitation. Then, the Hb solution was dialyzed three
times against 100 volumes of pure water at 4 °C, stripped of the bound 2,3-diphosphoglycerate by
passing the desalted hemoglobin solution through a mixed-bed ion-exchange resin (AG® 501-X8,
Bio-Rad), and centrifuged at 20,000 g for 10 min95. The Hb concentration was measured using
spectrophotometry with ε576 = 15,150 L mol-1 cm-1.48
Extracellular hemoglobins were purified from biological fluids given by the Roscoff Marine
Station (France). Riftia pachyptila coelom was collected during an oceanographic expedition on
the East Pacific Rise (MESCAL 2011) and stored at -80 °C until use. Arenicola marina blood was
collected from specimens harvested on the shore in Roscoff (France). The purification process was
adapted from protocols developed previously.49,51 Briefly, fluids were centrifuged twice (20,000
g, 10 min, 4 °C) to eliminate suspended particles, then eluted in a Superose® 6 Increase 10/300
column (GE Healthcare) using an ÄKTA FPLC system for size-exclusion chromatography. The
elution was followed by spectrophotometry at 280 nm (all proteins) and 414 nm (hemoproteins
only). The fractions of native hemoproteins were the largest and the first to be eluted (due to their
using 100 kDa Amicon Ultra-4 units (Merck), and stored at 4 °C. To our knowledge, no molar
extinction coefficient (ε) had been established for R. pachyptila coelomic hemoglobin (HbC1) or
A. marina blood hemoglobin (HbAm). Measurements of the amount of iron atoms using inducted
coupled plasma mass spectrometry on an iCAP Q (Thermo Scientific) allowed us to deduce ε
values at the Soret band: ε414 = 170,000 and 160,000 L mol-1 cm-1 for HbC1 and HbAm,
respectively (data not shown). Absorption spectra of every hemoprotein are given in Figure S3.
After purification, protein solutions were thoroughly characterized in order to check for purity
and for physicochemical assessment. RH and zeta (ζ) potentials were measured using a Zetasizer
Nano ZS (Malvern Instruments). Samples were placed in phosphate buffers (0.1 mol L-1), at pH 6
or pH 7 and measurement were done in triplicate. Rg were measured using small-angle neutron
scattering following the method developed previously.63 Samples were placed in 100% D2O
phosphate buffer (0.1 mol L-1, pD 7).
Adsorption Isotherms
Adsorption isotherms of hemoproteins on silica NPs were measured using a centrifugation-based
solution-depletion method (amount of adsorbed proteins obtained by subtracting the total protein
fraction with the non-adsorbed protein fraction).68,72 For each isotherm, two sets of samples were
prepared, one set containing a constant concentration of NPs (1 g L-1) and varying concentrations
of proteins (ranging from 0.01 to 2 g L-1) and another set containing the same concentrations of
proteins. Samples were gently mixed at room temperature for 3 h and then centrifuged (20,000 g,
10 min). Protein concentration in the supernatant was finally measured by spectrophotometry. The
affinity constants were calculated by fitting the adsorption isotherms to the Langmuir model96
according to Equation (1):
= . .
where mads (mg m-2) is the mass of adsorbed protein per square meter of NPs and C (g L-1) is the
non-adsorbed protein concentration at equilibrium. The deduced constants are m∞ (mg m-2), the
maximum amount of adsorbed protein per square meter of NPs, and Kads (L mol-1), the adsorption
constant (proportional to the affinity) given in moles of subunits to account for the large size
differences of the proteins studied. mads was converted into Nads(number of proteins per NP) for
comparison purposes.
Isothermal Titration Calorimetry (ITC)
ITC of hemoproteins adsorbed on silica NPs was performed using a VP-ITC calorimeter
(MicroCal). Before each measurement, every solution was degassed under vacuum. The reaction
cell (1.8 mL) was loaded with a NP solution and the syringe (500 μL) was filled with a hemoprotein
solution. NP and protein concentrations varied from 1 to 10 g L-1 and 0.01 to 0.3 mmol L-1,
respectively. The proteins and NPs were prepared in the same buffer (phosphate, 0.1 mol L-1, pH
6 or 7) to prevent any pH effect. The experiments were done in triplicate at 20 °C by adding 10 μL
of the protein solution to the NP solution with an equilibration interval of 350 s. The control
experiments were performed either without protein or without NPs. The measured heat exchange
was subtracted from the titration data prior to curve-fitting. The enthalpy (ΔH), the stoichiometry
of the reaction (NI), and the association constant (Kads) were obtained by nonlinear least-squares
fitting of the experimental data using the single set of independent binding sites (SSIS) model97 of
the Origin software provided with the instrument.
UV Circular Dichroism (CD)
The CD study was done using a Chirascan spectrometer (Applied Photophysics). Because the
CD signal is proportional to the amount of protein secondary structures, subunit concentration was
adsorption isotherm data in order to obtain a large excess of adsorbed protein in solution (80% for
Mb, 90% for Hb, and 70% for HbC1 and HbAm). The final NP concentration ranged from 1 to 20
g L-1. Samples were placed in phosphate buffer (0.1 mol L-1, pH 7) and gently mixed for 3 h before
measurements. We used 1 mm Quartz cells (Hellma), requiring a volume of 400 µL. Spectra were
measured from 190 to 250 nm with 0.5 nm steps and 0.5 s of acquisition time per point. Dichroic
signals were corrected by the NP-buffered solution spectrum, which showed no significant signal
in the range of wavelengths studied (Figure S7). Measured ellipticity was converted into delta
epsilon (Δε) by normalizing with the subunit molar concentration (3 µmol L-1), the number of
residues per subunit (153, 144, 146, and 176 residues, respectively), and the pathlength (0.1 cm).
Normalization was done using the BeStSel web server.98
Cryogenic Transmission Electron Microscopy (cryo-TEM)
Solutions containing HbAm proteins and silica NPs in phosphate buffer (0.1 mol L-1, pH 6 or 7)
were prepared as follows: concentrations were chosen so as to obtain more than 80% of adsorbed
proteins (excess of NPs); CHbAm = 0.4 g L-1; CNP = 3 or 6 g L-1 (pH 6 and 7, respectively). Then, 4
µL of sample solution was deposited onto a glow-discharged holey carbon grid (Quantifoil R2/2).
The grid was blotted with filter paper for 2 s and directly plunged into liquid ethane cooled by
liquid nitrogen using a Vitrobot Mark IV (Thermo Fisher Scientific) operated at 22 °C and 100%
relative humidity. The grids were stored in liquid nitrogen until use. Frozen samples were
transferred to a Gatan 626 cryo-holder and observed in a JEOL 2010F cryo transmission electron
microscope operating at 200 kV. The samples were imaged with a magnification of ×50,000 using
a minimal dose system and the images were collected with a Gatan Ultrascan 4K CCD camera at
ASSOCIATED CONTENT
The following sections are available free of charge in the Supporting Information file at
https://pubs.acs.org/:
Figure S1. Scale representation of the structures of hemoproteins
Figure S2. Representation of the dependence between radius and molecular weight of proteins
Figure S3. Absorption spectra of hemoproteins
Figure S4. Size-exclusion chromatography of annelid coelom and blood
Figure S5. Small-angle neutron scattering curves of hemoprotein solutions
Figure S6. Structural characterization of LUDOX TM-50 silica nanoparticles
Figure S7. Isothermal titration calorimetry experiments of hemoproteins adsorbed on silica NPs
(pH 6)
Figure S8. Circular dichroism spectra of free hemoproteins and silica nanoparticle
Figure S9. Raw cryo-TEM images of HbAm proteins adsorbed on silica nanoparticles
Figure S10. Distribution of the orientations of HbAm interacting with nanoparticles
Table S1. Adsorption and thermodynamic constants of hemoproteins adsorbed on silica
nanoparticles
AUTHOR INFORMATION
Corresponding Authors
Laurent Marichal*: laurent.marichal@universite-paris-saclay.fr
Serge Pin*: serge.pin@cea.fr
The manuscript was written with contributions from all authors. All authors approved the final
version of the manuscript.
Conflict of Interest: The authors declare no competing financial interest.
ACKNOWLEDGMENTS
The authors are grateful to Jean Labarre (CEA) for his scientific contribution and his supervision
of L. Marichal during his PhD thesis.
Funding Sources
This research was supported by a grant from the CEA “Programme de Toxicologie” (NaToM
grant).
L. Marichal was supported by a CFR grant from the CEA.
The MESCAL cruise during which Riftia pachyptila specimens were collected was supported
by the Flotte Océanographique Française.
This work was supported by the French Infrastructure for Integrated Structural Biology
(FRISBI) ANR-10-INBS-05.
The electron microscopy imaging was supported by “Investissements d'Avenir” LabEx PALM
(ANR-10LABX-0039-PALM).
The authors are grateful to the French METSA network (FR3507) for their financial support for
the cryo-TEM experiments.
REFERENCES
(1) Freundlich, H. Über Die Adsorption in Lösungen. Zeitschrift für Phys. Chemie 1907, 57U (1). https://doi.org/10.1515/zpch-1907-5723.
(2) Abramson, H. A. ELECTROKINETIC PHENOMENA: VI. RELATIONSHIP BETWEEN ELECTRIC MOBILITY, CHARGE, AND TITRATION OF PROTEINS. J. Gen. Physiol.
1932, 15 (5), 575–603. https://doi.org/10.1085/jgp.15.5.575.
(3) Parak, W. J.; Nel, A. E.; Weiss, P. S. Grand Challenges for Nanoscience and Nanotechnology. ACS Nano 2015, 9 (7), 6637–6640.
https://doi.org/10.1021/acsnano.5b04386.
(4) Vance, M. E.; Kuiken, T.; Vejerano, E. P.; McGinnis, S. P.; Hochella, M. F.; Rejeski, D.; Hull, M. S. Nanotechnology in the Real World: Redeveloping the Nanomaterial Consumer Products Inventory. Beilstein J. Nanotechnol. 2015, 6 (1), 1769–1780. https://doi.org/10.3762/bjnano.6.181.
(5) Kagan, C. R.; Fernandez, L. E.; Gogotsi, Y.; Hammond, P. T.; Hersam, M. C.; Nel, A. E.; Penner, R. M.; Willson, C. G.; Weiss, P. S. Nano Day: Celebrating the Next Decade of Nanoscience and Nanotechnology. ACS Nano 2016, 10 (10), 9093–9103. https://doi.org/10.1021/acsnano.6b06655.
(6) Anselmo, A. C.; Mitragotri, S. Nanoparticles in the Clinic. Bioeng. Transl. Med. 2016, 1 (1), 10–29. https://doi.org/10.1002/btm2.10003.
(7) Pelaz, B.; Alexiou, C.; Alvarez-Puebla, R. A.; Alves, F.; Andrews, A. M.; Ashraf, S.; Balogh, L. P.; Ballerini, L.; Bestetti, A.; Brendel, C.; et al. Diverse Applications of Nanomedicine. ACS Nano 2017, 11 (3), 2313–2381.
https://doi.org/10.1021/acsnano.6b06040.
(8) Hua, S.; de Matos, M. B. C.; Metselaar, J. M.; Storm, G. Current Trends and Challenges in the Clinical Translation of Nanoparticulate Nanomedicines: Pathways for Translational Development and Commercialization. Front. Pharmacol. 2018, 9 (JUL), 1–14. https://doi.org/10.3389/fphar.2018.00790.
(9) Soares, S.; Sousa, J.; Pais, A.; Vitorino, C. Nanomedicine: Principles, Properties, and Regulatory Issues. Front. Chem. 2018, 6 (AUG), 1–15.
https://doi.org/10.3389/fchem.2018.00360.
(10) Rivera Gil, P.; Oberdörster, G.; Elder, A.; Puntes, V.; Parak, W. J. Correlating Physico-Chemical with Toxicological Properties of Nanoparticles: The Present and the Future. ACS
Nano 2010, 4 (10), 5527–5531. https://doi.org/10.1021/nn1025687.
(11) Sharifi, S.; Behzadi, S.; Laurent, S.; Laird Forrest, M.; Stroeve, P.; Mahmoudi, M. Toxicity of Nanomaterials. Chem. Soc. Rev. 2012, 41 (6), 2323–2343.
https://doi.org/10.1039/C1CS15188F.
(12) Shin, S.; Song, I.; Um, S. Role of Physicochemical Properties in Nanoparticle Toxicity.
Nanomaterials 2015, 5 (3), 1351–1365. https://doi.org/10.3390/nano5031351.
(13) Su, H.; Wang, Y.; Gu, Y.; Bowman, L.; Zhao, J.; Ding, M. Potential Applications and Human Biosafety of Nanomaterials Used in Nanomedicine. J. Appl. Toxicol. 2018, 38 (1), 3–24. https://doi.org/10.1002/jat.3476.
(14) Monopoli, M. P.; Åberg, C.; Salvati, A.; Dawson, K. A. Biomolecular Coronas Provide the Biological Identity of Nanosized Materials. Nat. Nanotechnol. 2012, 7 (12), 779–786. https://doi.org/10.1038/nnano.2012.207.
(15) Kelly, P. M.; Åberg, C.; Polo, E.; O’Connell, A.; Cookman, J.; Fallon, J.; Krpetić, Ž.; Dawson, K. a. Mapping Protein Binding Sites on the Biomolecular Corona of Nanoparticles. Nat. Nanotechnol. 2015, 10 (5), 472–479.
https://doi.org/10.1038/nnano.2015.47.
(16) Docter, D.; Westmeier, D.; Markiewicz, M.; Stolte, S.; Knauer, S. K.; Stauber, R. H. The Nanoparticle Biomolecule Corona: Lessons Learned – Challenge Accepted? Chem. Soc.
Rev. 2015, 44 (17), 6094–6121. https://doi.org/10.1039/C5CS00217F.
(17) Peng, Q.; Liu, J.; Zhang, T.; Zhang, T.-X.; Zhang, C.-L.; Mu, H. Digestive Enzyme Corona Formed in the Gastrointestinal Tract and Its Impact on Epithelial Cell Uptake of Nanoparticles. Biomacromolecules 2019, 20 (4), 1789–1797.
https://doi.org/10.1021/acs.biomac.9b00175.
(18) Cai, R.; Chen, C. The Crown and the Scepter: Roles of the Protein Corona in Nanomedicine.
Adv. Mater. 2019, 31 (45), 1805740. https://doi.org/10.1002/adma.201805740.
(19) Francia, V.; Yang, K.; Deville, S.; Reker-Smit, C.; Nelissen, I.; Salvati, A. Corona Composition Can Affect the Mechanisms Cells Use to Internalize Nanoparticles. ACS Nano
2019, 13 (10), 11107–11121. https://doi.org/10.1021/acsnano.9b03824.
(20) Zoungrana, T.; Findenegg, G. H.; Norde, W. Structure, Stability, and Activity of Adsorbed Enzymes. J. Colloid Interface Sci. 1997, 190 (2), 437–448.
https://doi.org/10.1006/jcis.1997.4895.
(21) Cukalevski, R.; Lundqvist, M.; Oslakovic, C.; Dahlbäck, B.; Linse, S.; Cedervall, T. Structural Changes in Apolipoproteins Bound to Nanoparticles. Langmuir 2011, 27 (23), 14360–14369. https://doi.org/10.1021/la203290a.
(22) Klein, G.; Devineau, S.; Aude, J. C.; Boulard, Y.; Pasquier, H.; Labarre, J.; Pin, S.; Renault, J. P. Interferences of Silica Nanoparticles in Green Fluorescent Protein Folding Processes.
Langmuir 2016, 32 (1), 195–202. https://doi.org/10.1021/acs.langmuir.5b03890.
(23) Johnson, B. J.; Russ Algar, W.; Malanoski, A. P.; Ancona, M. G.; Medintz, I. L. Understanding Enzymatic Acceleration at Nanoparticle Interfaces: Approaches and Challenges. Nano Today 2014, 9 (1), 102–131.
https://doi.org/10.1016/j.nantod.2014.02.005.
(24) Wei, Y.; Thyparambil, A. A.; Wu, Y.; Latour, R. A. Adsorption-Induced Changes in Ribonuclease A Structure and Enzymatic Activity on Solid Surfaces. Langmuir 2014, 30 (49), 14849–14858. https://doi.org/10.1021/la503854a.
(25) Devineau, S.; Kiger, L.; Galacteros, F.; Baudin-Creuza, V.; Marden, M.; Renault, J. P.; Pin, S. Manipulating Hemoglobin Oxygenation Using Silica Nanoparticles: A Novel Prospect for Artificial Oxygen Carriers. Blood Adv. 2018, 2 (2), 90–94.
https://doi.org/10.1182/bloodadvances.2017012153.
(26) Patel, P.; Kumar, A. CHAPTER 3. Factors Affecting a Nanoparticle’s Protein Corona Formation. In Nanoparticle–Protein Corona: Biophysics to Biology; Kumar, A., Dhawan, A., Eds.; Issues in Toxicology; Royal Society of Chemistry: Cambridge, 2019; pp 61–79. https://doi.org/10.1039/9781788016308-00061.
(27) Mu, Q.; Jiang, G.; Chen, L.; Zhou, H.; Fourches, D.; Tropsha, A.; Yan, B. Chemical Basis of Interactions Between Engineered Nanoparticles and Biological Systems. Chem. Rev.
2014, 114 (15), 7740–7781. https://doi.org/10.1021/cr400295a.
(28) Pulido-Reyes, G.; Leganes, F.; Fernández-Piñas, F.; Rosal, R. Bio-Nano Interface and Environment: A Critical Review. Environ. Toxicol. Chem. 2017, 36 (12), 3181–3193. https://doi.org/10.1002/etc.3924.
(29) Nguyen, V. H.; Lee, B.-J. Protein Corona: A New Approach for Nanomedicine Design. Int.
J. Nanomedicine 2017, Volume 12, 3137–3151. https://doi.org/10.2147/IJN.S129300.
(30) Lundqvist, M.; Stigler, J.; Elia, G.; Lynch, I.; Cedervall, T.; Dawson, K. A. Nanoparticle Size and Surface Properties Determine the Protein Corona with Possible Implications for Biological Impacts. Proc. Natl. Acad. Sci. U. S. A. 2008, 105 (38), 14265–14270. https://doi.org/10.1073/pnas.0805135105.
(31) Piella, J.; Bastús, N. G.; Puntes, V. Size-Dependent Protein–Nanoparticle Interactions in Citrate-Stabilized Gold Nanoparticles: The Emergence of the Protein Corona. Bioconjug.
Chem. 2017, 28 (1), 88–97. https://doi.org/10.1021/acs.bioconjchem.6b00575.
(32) Marichal; Klein; Armengaud; Boulard; Chédin; Labarre; Pin; Renault; Aude. Protein Corona Composition of Silica Nanoparticles in Complex Media: Nanoparticle Size Does Not Matter. Nanomaterials 2020, 10 (2), 240. https://doi.org/10.3390/nano10020240. (33) Mathé, C.; Devineau, S.; Aude, J.-C.; Lagniel, G.; Chédin, S.; Legros, V.; Mathon, M.-H.;
Renault, J.-P.; Pin, S.; Boulard, Y.; et al. Structural Determinants for Protein Adsorption/Non-Adsorption to Silica Surface. PLoS One 2013, 8 (11), e81346. https://doi.org/10.1371/journal.pone.0081346.
(34) Tenzer, S.; Docter, D.; Rosfa, S.; Wlodarski, A.; Kuharev, J.; Rekik, A.; Knauer, S. K.; Bantz, C.; Nawroth, T.; Bier, C.; et al. Nanoparticle Size Is a Critical Physicochemical Determinant of the Human Blood Plasma Corona: A Comprehensive Quantitative Proteomic Analysis. ACS Nano 2011, 5 (9), 7155–7167.
https://doi.org/10.1021/nn201950e.
(35) Cai, X.; Ramalingam, R.; Wong, H. S.; Cheng, J.; Ajuh, P.; Cheng, S. H.; Lam, Y. W. Characterization of Carbon Nanotube Protein Corona by Using Quantitative Proteomics.
Nanomedicine Nanotechnology, Biol. Med. 2013, 9 (5), 583–593.
https://doi.org/10.1016/j.nano.2012.09.004.
(36) Klein, G.; Mathé, C.; Biola-Clier, M.; Devineau, S.; Drouineau, E.; Hatem, E.; Marichal, L.; Alonso, B.; Gaillard, J.-C.; Lagniel, G.; et al. RNA-Binding Proteins Are a Major Target
of Silica Nanoparticles in Cell Extracts. Nanotoxicology 2016, 10 (10), 1555–1564. https://doi.org/10.1080/17435390.2016.1244299.
(37) Bharti, B.; Meissner, J.; Klapp, S. H. L.; Findenegg, G. H. Bridging Interactions of Proteins with Silica Nanoparticles: The Influence of PH, Ionic Strength and Protein Concentration.
Soft Matter 2014, 10 (5), 718–728. https://doi.org/10.1039/C3SM52401A.
(38) Devineau, S.; Zargarian, L.; Renault, J. P.; Pin, S. Structure and Function of Adsorbed Hemoglobin on Silica Nanoparticles: Relationship between the Adsorption Process and the Oxygen Binding Properties. Langmuir 2017, 33 (13), 3241–3252.
https://doi.org/10.1021/acs.langmuir.6b04281.
(39) Meissner, J.; Wu, Y.; Jestin, J.; Shelton, W. A.; Findenegg, G. H.; Bharti, B. PH-Induced Reorientation of Cytochrome c on Silica Nanoparticles. Soft Matter 2019, 15 (3), 350–354. https://doi.org/10.1039/C8SM01909F.
(40) Rechendorff, K.; Hovgaard, M. B.; Foss, M.; Zhdanov, V. P.; Besenbacher, F. Enhancement of Protein Adsorption Induced by Surface Roughness. Langmuir 2006, 22 (26), 10885– 10888. https://doi.org/10.1021/la0621923.
(41) Pozzi, D.; Caracciolo, G.; Digiacomo, L.; Colapicchioni, V.; Palchetti, S.; Capriotti, A. L.; Cavaliere, C.; Zenezini Chiozzi, R.; Puglisi, A.; Laganà, A. The Biomolecular Corona of Nanoparticles in Circulating Biological Media. Nanoscale 2015, 7 (33), 13958–13966. https://doi.org/10.1039/C5NR03701H.
(42) Mahmoudi, M.; Abdelmonem, A. M.; Behzadi, S.; Clement, J. H.; Dutz, S.; Ejtehadi, M. R.; Hartmann, R.; Kantner, K.; Linne, U.; Maffre, P.; et al. Temperature: The “Ignored” Factor at the NanoBio Interface. ACS Nano 2013, 7 (8), 6555–6562. https://doi.org/10.1021/nn305337c.
(43) Nel, A. E.; Mädler, L.; Velegol, D.; Xia, T.; Hoek, E. M. V; Somasundaran, P.; Klaessig, F.; Castranova, V.; Thompson, M. Understanding Biophysicochemical Interactions at the Nano-Bio Interface. Nat. Mater. 2009, 8 (7), 543–557. https://doi.org/10.1038/nmat2442. (44) Norde, W. My Voyage of Discovery to Proteins in Flatland …and Beyond. Colloids
Surfaces B Biointerfaces 2008, 61 (1), 1–9. https://doi.org/10.1016/j.colsurfb.2007.09.029.
(45) Vogler, E. A. Protein Adsorption in Three Dimensions. Biomaterials 2012, 33 (5), 1201– 1237. https://doi.org/10.1016/j.biomaterials.2011.10.059.
(46) Rabe, M.; Verdes, D.; Seeger, S. Understanding Protein Adsorption Phenomena at Solid Surfaces. Adv. Colloid Interface Sci. 2011, 162 (1–2), 87–106.
https://doi.org/10.1016/j.cis.2010.12.007.
(47) Vroman, L. When Blood Is Touched. Materials (Basel). 2009, 2 (4), 1547–1557. https://doi.org/10.3390/ma2041547.
(48) Antonini, E.; Brunori, M. Hemoglobin and Myoglobin in Their Interactions with Ligands, Frontiers.; North-Holland Pub. Co.: Amsterdam, 1971.