HAL Id: hal-03005940
https://hal.archives-ouvertes.fr/hal-03005940
Submitted on 16 Nov 2020
HAL is a multi-disciplinary open access
archive for the deposit and dissemination of
sci-entific research documents, whether they are
pub-lished or not. The documents may come from
teaching and research institutions in France or
abroad, or from public or private research centers.
L’archive ouverte pluridisciplinaire HAL, est
destinée au dépôt et à la diffusion de documents
scientifiques de niveau recherche, publiés ou non,
émanant des établissements d’enseignement et de
recherche français ou étrangers, des laboratoires
publics ou privés.
In situ study of the synthesis of thorite (ThSiO 4 )
under environmental representative conditions
Paul Estevenon, Jérémy Causse, Stephanie Szenknect, Éléonore Welcomme,
Adel Mesbah, Philippe Moisy, Christophe Poinssot, Nicolas Dacheux
To cite this version:
Paul Estevenon, Jérémy Causse, Stephanie Szenknect, Éléonore Welcomme, Adel Mesbah, et al.. In
situ study of the synthesis of thorite (ThSiO 4 ) under environmental representative conditions. Dalton
Transactions, Royal Society of Chemistry, 2020, 49 (33), pp.11512-11521. �10.1039/D0DT01790F�.
�hal-03005940�
a.
ICSM, Univ Montpellier, CEA, CNRS, ENSCM, Bagnols-sur-Cèze, France. b.CEA, DES, ISEC, DMRC, Univ Montpellier, Marcoule, France. † Present addresses:
The European Synchrotron, CS40220, 38043 Grenoble Cedex 9, France.
Helmholtz Zentrum Dresden-Rossendorf (HZDR), Institute of Resource Ecology, P.O. Box 510119, 01314, Dresden, Germany.
Electronic Supplementary Information (ESI) available: Figure S1 to Figure S6; Table S1 to Table S3. See DOI: 10.1039/x0xx00000x
In situ study of the synthesis of thorite (ThSiO
4) under
environmental representative conditions
Paul Estevenon,a,b,† Jeremy Causse,*a Stephanie Szenknect,a Eleonore Welcomme,b Adel Mesbah,a Philippe Moisy,b Christophe Poinssot b and Nicolas Dacheux a
Thorite, ThSiO4 with Zircon structure type, is one of the most abundant natural source of thorium on earth. While actinides
are known to form nanoparticles in silicate medium, no direct link between those colloids and crystalline form of thorite was evidenced until now. Here we show that thorite can be produced in experimental conditions close to environmental pH and temperature. Thanks to in-situ Small and Wide Angle X-rays Scattering (SWAXS) measurements, colloids of a few nanometers are first evidenced for low reaction time. These colloids exhibit elongated shapes and finally tend to aggregate after the size has reached 10 nm. Once aggregated, the system goes through a maturation step finishing with the emergence of nanocrystallites presenting thorite zircon structure. This maturation step is longer when the reaction temperature is decreased highlighting kinetic considerations. The conclusions of this article have potential implications in the paragenesis of Th minerals deposits, but also in the behaviour of Th and, by analogy, tetravalent actinides in the environment. The Th-silicate colloids evidenced in this work have, at low temperature and at near neutral pH, a long-term stability and a morphology in favor of a high mobility in groundwaters. If these species are formed in more diluted media, this could be problematic regarding to the spreading of Th and, by analogy of others tetravalent actinides in the environment.
1 Introduction
The thorium chemistry may be considered as indicative of the reactivity of the actinide elements at the oxidation state +IV. Due to the abundance of silicate species in the environment, identifying the actinide-silicate interactions is a key point to evaluate the actinides behaviour in environment. On the one hand, thorium, uranium and neptunium are known to form nanometric particles in silicate reactive media1–9. The structure, size and stability of these intrinsic actinide-oxyhydroxy-silicate colloids have been investigated1,3,5,9. The prevailing size of the colloids is less than 20 nm, they appear as virtually amorphous or poorly structured and exhibit low isoelectric point (pHIEP ≤ 4.6)3,6,8, corresponding to a negative
surface charge. Thus, AnIV oxyhydroxy-silicate colloids may be able to stabilize significant amounts of AnIV in a waterborne form and may enhance their mobility in soils and aquifers. On the other hand, the zircon-type structure minerals thorite (ThSiO4) and coffinite (USiO4) are among the most abundant
natural sources of thorium and uranium in ore deposits. Although they could play an important role in the formation of ore deposits, to the best of our knowledge, no specific link between the colloidal species and the corresponding crystalline phases (i.e. thorite and coffinite) has been highlighted until now.
The thorite formation has been extensively studied using high temperature dry chemistry10–15 and hydrothermal synthesis methods13–31. However, even though thermodynamic
measurements established that ThSiO4 was more stable than a
ThO2 and SiO2 mixture at 298 K23,27,32, hydrothermal conditions
or elevated temperatures have always been used to synthesize thorite. To the best of our knowledge, the lowest temperature reported is 150°C in ligand rich reactive media (fluoride or carbonate ions)16,30 and 160°C in ligand free reactive media (pH = 1 and CTh = 4.2 10-2 mol.L-1)31. Nevertheless, a recent
study has demonstrated that increasing the reactant concentration and modifying the pH of the reactive media may enable the formation of the silicate phase on a wider range of conditions31.
Small and Wide-Angle X-rays Scattering (SWAXS) allowed us to follow the evolution of the size and shape of colloids, to assess the nature of their interactions (electrostatic repulsion, aggregation…) and to identify the nature of crystalline phases formed in solution. This technique was already used to investigate the first stages of formation of various crystalline phases such as zeolite, titanium dioxide, microporous aluminophosphonate, molybdate catalysts, tungstite, zirconia or MOFs. For example, Panzarella et al. showed that microwave synthesis of NaY zeolite started first with the formation of amorphous nanoparticles33. Then, these colloids tended to aggregate throughout the synthesis, to finally produce crystalline NaY zeolite. Fan et al. studied LTA zeolite formation and concluded that homogeneous nucleation took place in a first step to produce amorphous nanoparticles of about 5-15 nm, then a growth step occurred, followed by the crystallization of this species34. While in-situ SWAXS technique has been mainly used to study inorganic materials, some authors used it to depict the crystallisation process of Metal Organic Frameworks (MOFs). For example, Stavitski et al. have used SWAXS to differentiate the mechanisms of nucleation /crystal growth for two different MOFs (MIL-53 and MIL-101) obtained from the same molecular precursors but in various solvents35.
Therefore, in-situ SWAXS is relevant to study the first moments of a crystallisation process. However, this technique has never been used to describe the crystallization of actinide-silicate phases. To the best of our knowledge, only Neill et al. have used SAXS technique in order to determine the size of uranium silicate colloids and to investigate their stability with regard to pH and concentration1. They combined SAXS and EXAFS to propose a core-shell model of the colloids with a core made of UO2 and a shell made of uranium silicate. However,
no direct link between the existence of these colloids and the formation of the crystalline phase, coffinite was made. Thermodynamic data available for thorite indicated that this phase was more stable at 298 K than the mixture of the binary oxides. Thus, hydrothermal conditions were not required to precipitate thorite from a thorium and silicate solution. However, elevated temperature increased the kinetics of crystallization of thorite30,31. The present paper aims to evidence the formation of Th-based colloids in silicate solutions at low temperatures and under environmental conditions. The relevant synthesis conditions were identified thanks to the multiparametric study of ThSiO4 reported in a
recent article31. The impact of the temperature and of the pH of the synthesis medium on the kinetics of crystallisation of thorite was investigated using in-situ SWAXS technique. This technique, associated to X-rays diffraction, Raman and IR-spectroscopies allowed to establish the link between the presence of thorium silicate colloids in synthesis solutions and the formation of the crystalline thorite.
2 Materials and methods
2.1 Sample preparation
All of the reagents used for the syntheses were of analytical grade and were supplied by Sigma-Aldrich. Th(NO3)4·4-5H2O is
known to be a highly hygroscopic salt. Therefore, in order to accurate control the thorium concentration, a stock solution was prepared by dissolving thorium nitrate salt in 1 mol·L-1 HNO3. The obtained solution was titrated by inductively
coupled plasma atomic emission spectroscopy (ICP-AES) and the thorium concentration obtained reached CTh = 0.96 ± 0.01
mol·L-1. In such acidic conditions, thorium was also protected against hydrolysis.
The synthesis of ThSiO4 was performed using the protocol we
recently developed for preparation of the thorium silicate in carbonate free reactive media31. An aqueous silicate solution was prepared by dissolving Na2SiO3 in water and a precise
volume of the thorium stock solution was added to this solution to obtain a reacting mixture with CSi ≈ CTh = 0.21 mol·L -1
. In order to obtain thorium oxide-free samples, a silicate excess of 3 mol.% in the reacting mixture was maintained. The pH was then adjusted to the chosen final value with 8 mol·L-1 NaOH.
In order to perform in-situ SWAXS measurements, a small volume of the solution was taken and placed in glass capillary
tubes (1 mm diameter). These capillaries were then sealed thanks to an epoxy resin which was reticulated during 15 minutes under a UV lamp ( = 365 nm). This hermetic sealing was performed to ensure the confinement of the sample and to avoid sample dehydration.
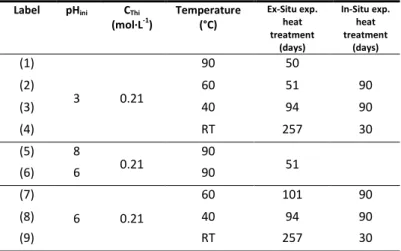
The prepared ex-situ mixtures were introduced in 5 mL Savillex PFA hermetic vials and kept at room temperature or placed in an oven at temperatures equal to 40°C, 60°C or 90°C for a variable period of time (ranged between 50 and 257 days), while SWAXS capillaries were also kept at fixed temperature (40°C or 60°C) thanks to a specific oven. The synthesis conditions of the ThSiO4 samples are summarized in Table 1, in
which in-situ experiments refer to SWAXS samples.
At the end of the heat treatment, samples were cooled down to room temperature. Then, the precipitates were separated from the supernatant by centrifugation for 12 min at 14000 rpm, washed twice with deionized water and once with ethanol, and finally dried overnight at 60°C in an oven.
Table 1.
Synthesis parameters for the ThSiO4 samples obtained by ex-situ experiments, corresponding time of in-situ SWAXS experiments performed under the same conditions. Labels are then used in Figures 1, S1, S2 and S4 for easier reading. CSi = CTh + 3 mol.%.Label pHini CThi (mol·L-1) Temperature (°C) Ex-Situ exp. heat treatment (days) In-Situ exp. heat treatment (days) (1) 3 0.21 90 50 (2) 60 51 90 (3) 40 94 90 (4) RT 257 30 (5) 8 0.21 90 51 (6) 6 90 (7) 6 0.21 60 101 90 (8) 40 94 90 (9) RT 257 30
2.2 Methods and characterization
PXRD data were collected on the resulting powders using a Bruker D8 Advance diffractometer equipped with a lynxeye detector and using Cu Kα radiation (λ = 1.54184 Å) in a reflection geometry (parallel beam). Adapted sample holders were used in order to avoid any potential radioactive contamination. PXRD patterns were recorded between 5 and 100° (2θ) with steps of 0.019° and a total counting time of 2.5 to 3 hours per sample. Instrumental function was extracted thanks to measurements on pure silicon metal sample. The collected data were refined by the Rietveld method using the Fullprof_suite package36. During the refinements, different profile and structure parameters, such as the zero shift, unit-cell parameters, scale factor, and overall displacement factor were allowed to vary. However, the size of the crystallite has been determined thanks to the Scherrer equation. This
method has been preferred to the Rietveld method because Scherrer equation has also been used to evaluate the size of the coherent-domain of ThSiO4 on the diffraction peaks
obtained by SWAXS measurements.
Raman spectra were recorded with a Horiba-Jobin Yvon Aramis spectrometer equipped with an edge filter and a Nd:YAG laser (532 nm) that delivers 60 mW at the sample surface. The laser beam was then focused on a sample using an Olympus BX 41 microscope with a 50LMP objective, resulting in a spot area of ∼1 μm2 and a power of 39 mW. Four scans were recorded for each analysed area and a dwell time of 1 to 30 s was used for each spectrum.
FTIR spectra were recorded in the 300 – 4000 cm-1 range using a Perkin-Elmer FTIR Spectrum 100 instrument. Powdered samples were deposited on the surface of an ATR crystal without any prior preparation. The spectra collected under such operating conditions exhibited a resolution of 1 cm-1. Four scans were performed to average the measurement error.
TEM observations were conducted on small powder samples deposed on a copper grid using a JEOL 1200 EX II electronic microscope, equipped with a QUEMESA (EMSIS) camera. The accelerating voltage of the electron beam was fixed at 120 kV. Thermogravimetric analyses were performed on the ThSiO4
samples prepared, in order to determine their hydration content, thanks to a SETSYS evolution ATD/ATG analyser. All of these analyses were performed between room temperature and 1000°C under air.
In-situ SWAXS experiments were conducted using a Guinier-Mering setup with a 2D image plate detector. The X-ray source was a molybdenum anode, which delivered a high-energy monochromatic beam (λ = 0.71 Å, E = 17.4 keV), providing structural information over scattering vectors q ranging from 0.25 to 30 nm-1. Helium flowed between the sample and the image plate to prevent air absorption. A specific oven was used to set temperature at 40 and 60°C. The sample acquisition time was 1800s. Data corrections and radial averaging were performed by standard procedures. The image azimuthal average was determined by FIT2D software from ESRF (France)37,38. At the beginning of the experiment, spectra were acquired each 90 minutes, then the waiting time between two measurements was gradually increased. Spectra were recorded throughout the experiment, from the beginning of the heating up to 3 months of heat treatment.
3 Results and discussion
3.1 Characterization of low temperature
synthesized ThSiO
4Based on the protocol reported for the hydrothermal synthesis of ThSiO431, several attempts to prepare this phase were
conducted at CTh = 0.21 mol·L-1 and CSi = CTh + 3 mol.%, at 90°C
for 50 days and pH ranged between 1 and 8. If, the treatment performed at pH = 1 did not lead to the precipitation of any
solid phase, the experiment at pH ≥ 3 led to the formation of the thorite as single crystallized phase according to the PXRD data (Figure S1). The non-precipitation of ThSiO4 species at
pH = 1 is in good agreement with the results we obtained at 120°C and 150°C in our previous study31. Moreover, Raman and infrared spectroscopies allowed to confirm the formation of thorite as the final phase obtained without any evidence of the formation of another solid phase (Figure S1).
Similar experiments have been performed for pH = 3 and pH = 6 at room temperature, 40°C, 60°C and 90°C for various holding times. Based on the PXRD data, the formation of crystalline thorite has been evidenced at 60°C for pH = 3 (Figure 1) and at 40°C at pH = 6 (Figure S2). At pH = 3, broad diffraction peaks corresponding to the ThSiO4 pattern have
been observed for the experiments performed at room temperature and 40°C. This behaviour might correspond to the formation of nanocrystalline or poorly crystallized silicate phase. Moreover, the shape of the XRD patterns obtained for the sample synthesized at pH = 6 at room temperature or 40°C suggests also the formation on nanometric or poorly crystallized ThO2.
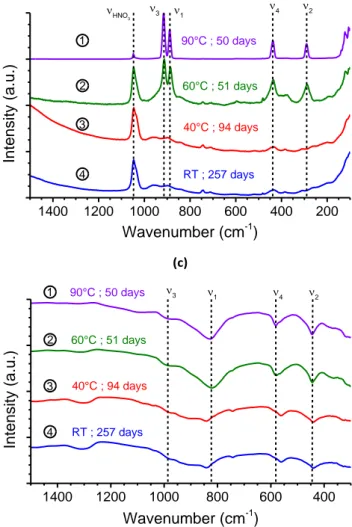
Additionally, the spectroscopic characterization of these samples allowed to confirm the presence of thorite in the final phase (Figure 1 and Figure S2). Indeed, at pH = 3, the formation of thorite has been identified by infrared spectroscopy whatever the temperature considered, especially thanks to the characteristic ν2 and ν4 bands of the silicate
entities. (a) 10 20 30 40 50 60 70 80 90 100
I
ntensity
(a.
u.)
RT ; 257 days 90°C ; 50 days 60°C ; 51 days2·
(degree)
ThSiO4 40°C ; 94 days ThO2 * * * * * * 1 2 3 4 (b)1400 1200 1000 800 600 400 200
I
ntensity
(a.
u.)
Wavenumber (cm
-1)
1 3 4 2 HNO 3 1 2 3 4 RT ; 257 days 90°C ; 50 days 60°C ; 51 days 40°C ; 94 days (c) 1400 1200 1000 800 600 400I
ntensity
(a.
u.)
1Wavenumber (cm
-1)
3 4 2 1 2 3 4 90°C ; 50 days 60°C ; 51 days 40°C ; 94 days RT ; 257 daysFigure 1. PXRD patterns (a), Raman (b) and infrared spectra (c) obtained for samples prepared with starting silicate and thorium(IV) concentrations of 0.21 mol·L-1 in nitric reactive media at initial pH = 3 at 90°C for 50 days (1), 60°C for 51 days (2), 40°C for 94 days (3) and at room temperature for 257 days (4). Characteristic XRD lines of ThO2 and ThSiO4 were extracted from references40 and 3, respectively.
However, it may be noticed that these bands are shifted for the syntheses performed at low temperature (from ν2 =
581 cm-1 to ν2 = 561 cm-1 and from ν4 = 444 cm-1 to
ν4 = 440 cm-1). This shift probably corresponds to a very strong
modification of silicate groups geometry at low temperature compared to the ideal ThSiO4 structure. Moreover, samples
characterization by Raman spectroscopy are also consistent with the formation of ThSiO4, which may be identified thanks
to the characteristic vibration bands associated to the
symmetric and antisymmetric stretching modes (at 892 cm-1 and 918 cm-1, respectively), although these bands appeared to be very broadened and attenuated at low temperature. The spectra obtained for the sample synthesized at pH = 6 were consistent with the formation of ThSiO4 above 40°C
(Figure S2).
Rietveld refinement of the samples synthesized at pH = 3 at 60°C and 90°C allowed to observe a very strong modification of the ThSiO4 lattice parameters. Indeed, the a lattice parameter
has been determined to be significantly higher than the reference parameter reported in the literature for thorite single-crystal prepared at 1100°C (at 60°C a = 7.1674(18) Å; at 90°C, a = 7.1593(9) Å; reference a = 7.1328(2) Å 39). Simultaneously, the obtained c parameter was lower than that reported for ThSiO4 single crystal (at 60°C c = 6.3081(18) Å; at
90°C, c = 6.3099(8) Å; reference c = 6.3188(2) Å 39). Consequently, the volume of the lattice was significantly higher for the synthesis performed at low temperature compared to the reference unit cell volume (at 60°C V = 324.06(15) Å3; at 90°C, V = 323.42(7) Å3; reference V = 321.48(3) Å339). This behaviour was probably due to the insertion of water or hydroxide groups in the thorite lattice according to the results reported by Frondel et al.2 and those we obtained recently forThSiO4 synthesis performed under
hydrothermal conditions31. In order to confirm this hypothesis, thermogravimetric analyses have been conducted up to 1000°C from ThSiO4 sample prepared at pH = 3 at 60°C and at
90°C. This analysis allowed to measure a mass loss of 9.85 % and 8.65 % for the samples synthesized at 60°C and 90°C, respectively (Figure S3). These mass losses were principally due to water elimination. It is worth noting that the mass loss observed for the syntheses conducted at 60°C led to the release of 1.97 and 1.71 water molecules per ThSiO4 unit for
the samples prepared at 60°C and 90°C, respectively. This content matched with the one reported for environmental actinide silicate samples41–43. From PXRD analysis of the samples heated at 1000°C, the ThSiO4 lattice parameters were
found to be close (a = 7.1337(11) Å, c = 6.3259(11) Å and V = 321.92(9) Å3) to the reference parameters (a = 7.1328(2) Å,
c = 6.3188(2) Å and V = 321.48(3) Å3) (Figure S4).
Figure 2. Transmission Electron Microscopy micrographs recorded for the syntheses performed at CTh = 0.21 mol·L-1, pH = 3 at 60°C for 51 days (a), at 40°C for 94 days (b) and at room temperature for 257 days (c).
Moreover, the formation of a small amount of ThO2 (around
10 wt.%) has been observed, probably due to the crystallization of nanometric or very poorly crystallized thorium dioxide or to the degradation of a part of the hydrated thorium silicate when heating.
Transmission Electron Microscopy observations have been conducted for various samples (Figure 2 and Figure S5). These experiments did not lead to ThSiO4 with a well-defined
morphology, but to aggregates composed of small particles of around 10 nm in size. Whatever the temperature of the treatment, difference in the morphology was observed between the samples prepared at pH = 3 and at pH = 6; the first ones being more dispersed than the latest ones.
3.2 In-situ study of the ThSiO
4formation
In order to obtain more information on the mechanism of formation of ThSiO4, in-situ SWAXS experiments were
conducted at pH = 3 and pH = 6 at room temperature, 40°C and 60°C. No experiments were conducted at 90°C due to the brittleness in temperature of the glass capillary tubes used. Complementary experiments were conducted with pH = 1 and pH = 8 at 60°C. However, neither of these experiments actually led to the formation of ThSiO4. Indeed, as previously reported,
at pH = 1, no solid phase was found while at pH = 8, the formation of ThSiO4 seemed to have been prevented by the
precipitation of nanometric or poorly crystallized thorium dioxide particles.
Additionally, it is worth noting that increasing the pH of the reactive media over 3.5 led to the formation of a gel in the reactive media, which conducted to the opacification of the reactive media (from an uncoloured and transparent solution to a white and opaque solution). This precipitation corresponds to the precipitation of particles, which are too big to allow the determination of particle size and shape by SWAXS method. Therefore, the results presented here will mainly correspond to the experiments performed at pH = 3 while the results obtained at pH = 6 are available in supporting information.
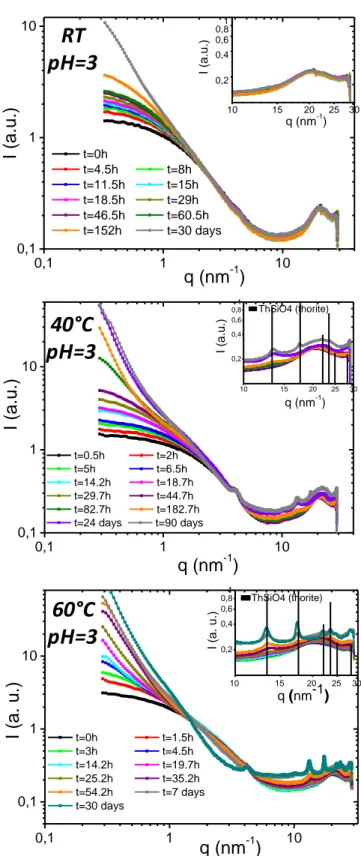
SWAXS kinetics curves for three different temperatures at pH = 3 are presented in Figure 3. The global examination of these curves indicated first that the systems obtained at pH = 3 exhibited species under the colloidal form for short reaction times. For those samples the SWAXS curves at low q values showed a quasi-constant variation of the scattered intensity, which characterized the presence of small unaggregated objects. This constant regime at low q values was no longer observable when the objects started to aggregate. This change in the curve made then possible to set three different steps in the thorite formation.
Figure 3. In-situ SWAXS measurements kinetics at room temperature (RT), 40°C and 60°C for pH = 3. The inset graphics refer to a focus in the q range from 10nm -1 to 30nm-1.
RT
pH=3
60°C
pH=3
40°C
pH=3
0,1 1 10 0,1 1 10 q(
nm-1)
I (a. u.) t=0h t=1.5h t=3h t=4.5h t=14.2h t=19.7h t=25.2h t=35.2h t=54.2h t=7 days t=30 days ThSiO4 (thorite)q (nm
-1)
I (a. u.)
10 15 20 25 30 0,2 0,4 0,6 0,81 0,1 1 10 0,1 1 10 q (nm-1) I (a.u. )I (a.u.)
q (nm
-1)
t=0h t=4.5h t=8h t=11.5h t=15h t=18.5h t=29h t=46.5h t=60.5h t=152h t=30 days 10 15 20 25 30 0,2 0,4 0,6 0,81 0,1 1 10 0,1 1 10 q (nm-1) I (a.u. )I (a.u.)
q (nm
-1)
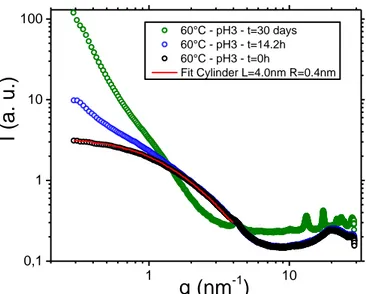
t=0.5h t=2h t=5h t=6.5h t=14.2h t=18.7h t=29.7h t=44.7h t=82.7h t=182.7h t=24 days t=90 days ThSiO4 (thorite) 10 15 20 25 30 0,2 0,4 0,6 0,8 1Figure 4. In-situ SWAXS measurements kinetic of thorite formation at pH = 3 at 60°C. Description of STEP I, II and III. At low q values (< 4nm-1), experiment at t
0 is fitted with a cylinder form factor model, P(q).
Table 2. Life-times of unaggregated colloids (STEP I); aggregates (STEP II) and for the appearance of ThSiO4 crystals (STEP III) for experiments performed at pH = 3, RT, 40°C and 60°C. Colloids (STEP I) Aggregates (STEP II) ThSiO4 crystals (STEP III) pH3 – RT 0 -152h 152h – 30d >> 90d pH3 – 40°C 0 - 44.7h 44.7h – 24d 24d pH3 – 60°C 0 -4.5h 4.5h – 54.2h 54.2h
The three steps observed for the system prepared at pH = 3 and 60°C are presented in Figure 4. In the first step (STEP I), small unaggregated objects, describable by geometric model such as cylinder, remained in suspension until they started to aggregate (STEP II). As shown on the blue data points series, this aggregation led to the alteration of scattered intensity at low q values. Then, after a maturation time, crystallites appeared in solution, large enough to give clear diffraction peaks of the thorite crystal (lattice planes (1,0,1) ; (2,0,0) ; (1,1,1) ; (2,1,1) ; (1,1,2) ; (2,2,0)) at large q values (STEP III). It was therefore possible to assess three different characteristic times for each system (Table 2 and Table S1 of supporting information for the samples obtained at pH = 3 and pH = 6, respectively) from the SAXS curves reported in Figure 3 and
Figure S6.
In Table 2, the time needed to move from unaggregated colloids (STEP I) to aggregated ones (STEP II) decreases when the temperature increases, i.e. from 152 hours at room temperature (20°C) to 44.7 hours at 40°C and to 4.5 hours at 60°C. While constant scattered intensity regime at low q values for very short lifetime (STEP I) was observed at pH = 3, it was clearly not the case at pH = 6 (Figure S6). At pH = 6, the colloids were aggregated from the very beginning of the reaction. Even at room temperature, the scattered intensity at low q values showed a drastic increase explained by the presence of big objects of several hundreds of nanometers in solution. The presence of these big scattering objects was
attributed to the colloids low surface-charge at pH = 6. Indeed, the isoelectric point of thorium silicate sets at pH = 4.63. In these conditions, electrostatic repulsion do not stabilize colloids and aggregation occurs at the early stage of reaction. The time needed for the observation of diffraction peaks characteristics of ThSiO4 crystals is also presented in Table 2.
This characteristic time was obtained when crystallites are large enough to give diffraction peaks in the high q region of SWAXS curves. The thorite peaks appeared for q values between 10 nm-1 and 30 nm-1, in the focus at right bottom of each curve of Figure 3 (Figure S6 at pH = 6). As expected, the time needed to detect ThSiO4 crystals decreased when
temperature increased. At pH = 3 and RT, ThSiO4 crystals were
not detected, even after one month of reaction whereas ThSiO4 diffraction peaks appeared for high q values after 24
days and 54.2 hours at 40°C and 60°C, respectively. It is worth noting that at room temperature and for pH = 3, crystals of ThSiO4 was evidenced by PXRD after 257 days of reaction
(Figure 1a). At pH = 6 (Table S1), only STEP II was observed at RT during 30 days while ThSiO4 diffraction peaks appeared for
high q values after 24 days and 35.7 hours at 40°C and 60°C, respectively. Thus, and as expected, at pH = 3 and 6, the kinetics of crystallization of ThSiO4 increased with
temperature. At geological timescale for example, it is thus reasonable to suggest that those samples should be finally crystallized under the thorite form even at temperature as low as room temperature.
3.2.1 From colloidal state to aggregated clusters
The SWAXS theory claims that the curves relative to scattering objects dispersed in a medium can be described by the following general equation:
(1)
Where I(q) is the scattered intensity; A is a prefactor depending on scattering objects volume fraction and the molecular volume of objects; P(q) is the scattering objects form factor; and S(q) is the structure factor describing interaction between scattering objects.
When the colloids are diluted enough, without any aggregation in solution, S(q) equals to 1 and the SWAXS curves can be described with only form factor P(q). This means that for low reaction times, in the STEP I, the SWAXS curves can be fitted with a simple model not taking into account any structure factor. Therefore, this simplified description was only possible for experiments performed at pH = 3 due to aggregation phenomenon occurring in the gel state at pH = 6. Several form factor models were tested but only cylinder shape exhibited a good correlation with SWAXS curves (see the detailed expression of the form factor model in the supporting information). An example of a fitted curve is presented in
Figure 4 (red curve). Therefore, fitting experimental data
points at each reaction time allowed to analyze the evolution of cylinder length L during STEP I until those cylinders started to aggregate (Figure 5). For all the considered temperatures, the cylinder length increased while no noticeable change of the radius was observed (Table S2). The growth rate, given by the slope of L(t), also increased with the temperature. This
1 10 0,1 1 10 100
q (nm
-1)
60°C - pH3 - t=30 days 60°C - pH3 - t=14.2h 60°C - pH3 - t=0h Fit Cylinder L=4.0nm R=0.4nmI (a.
u.)
result is in agreement with faster kinetics of reaction at high temperature. It is noticeable that regardless of the temperature, colloids started to aggregate as soon as the cylinder length reached 10 nm.
Figure 5. Evolution of the cylinders length at low reaction times (STEP I) for SWAXS at pH = 3, at RT, 40°C and 60°C.
It is assumed that at the early stage of the reaction, 1D-growth of the nuclei occured giving birth to elongated cylinders. Then, at a given time that corresponds to the end of STEP I, these isolated cylinders started to agglomerate leading to larger objects with heterogeneous sizes (STEP II). Another explanation could be that the growth mechanism changed from 1D to 3D. In that case, the extremities of the cylinders would be no more energetically favourable than the walls. This change of reaction site has been already observed for silicates. For example, it is known that silicic acid produced linear structures of silica at low pH values while denser structures were observed for higher pH values due to a change in the localization of condensation reaction in the colloids44.
3.2.2 Emergence and growth of nanocrystalline domains
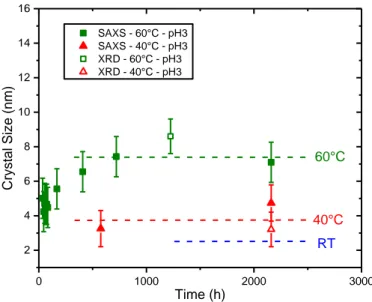
If STEP I corresponds to the stage of 1D-growth of colloids and STEP II to an aggregation period, the STEP III refers to the appearance of thorite nanocrystalline domains. The inserts in the curves presented in Figure 3 show the SWAXS large q range where thorite diffraction peaks were detected. Thorite crystals were not observed at room temperature for the entire duration of the in-situ SWAXS experiment at pH = 3. However, as already mentioned, PXRD pattern obtained from ex-situ synthesis at RT showed a very broad and diffuse signal after 257 days of reaction, which was the sign of the presence of nanocrystalline thorite. Thanks to ex-situ PXRD and in-situ SWAXS measurements, it was possible to determine the size of coherent domain in thorite crystals using the Debye-Scherrer equation45. The variation of the size of the coherent domains in thorite crystals with reaction time is reported in Figure 6. Data were treated integrating peak at 20° (PXRD) and 13 nm-1 (SAXS) corresponding to lattice plane (1,0,1). First of all, the results obtained from SWAXS (full markers) and from PXRD patterns (open markers) are consistent. At RT, diffraction peaks in the large q range are not observed on SWAXS curves, even after 90 days of experiments. From the results obtained at 60°C, it appeared that the size of ThSiO4 crystals increased
mainly between 54.2 and 700 hours of reaction, from 4 ± 1 nm to 7.5 ± 0.5 nm. After this first increase, the values reached a plateau until the end of these in-situ measurements (3 months).
Figure 6. Evolution of the size of the coherent domains in thorite crystals synthesized at pH = 3 determined from in-situ SAXS and ex-situ PXRD measurements. Dashed lines correspond to crystallite mean size at large lifetime (257 days for RT and pH=3, the data point obtained with PXRD is not represented to ease the reading of the figure).
The dotted blue line in Figure 6 stands for the size of coherent domains in ThSiO4 crystals obtained from PXRD pattern of the
synthesis performed at RT after 257 days, i.e. 2.5 nm. After stabilization, the size of the coherent domains in ThSiO4
crystals reached 4 ± 1 nm and 7.5 ± 0.5 nm at 40°C and 60°C, respectively. From these results, it appeared that increasing the temperature improved the crystallinity of thorite. It is worth noting that the size of the coherent domains obtained at large reaction time were lower than the maximum length of the cylinders initially formed in the reactive media. This observation indicates that the objects formed at low temperatures (i.e. ≤ 60 °C) presented a large degree of disorder, which was reduced to some extent by increasing the temperature of the synthesis. Thermogravimetric analyses showed that the amount of water molecules or hydroxide groups in ThSiO4 decreased with an increase of the
temperature of synthesis. Thus, it could be suspected that a part of the observed disorder in the thorite crystals formed at low temperature (i.e ≤ 60°C) was caused by insertion of water molecules or hydroxide groups in the lattice. The variation of the rate of crystallization with respect to temperature was more difficult to establish due to the lack of values at 40°C and RT.
4 Conclusions
For the first time, thorite ThSiO4 was obtained from direct
precipitation in weakly acid silicate solution at room temperature. This result confirmed the thermodynamic stability at 298 K with respect to the mixture of the binary oxides. In addition, this study allowed following of the early
0 100 200 0 2 4 6 8 10 12 14 16 RT 60°C 40°C Time (h) Cyli nd er Le ng th (n m)
STRUCTURE FACTOR NEEDED IN THE MODEL
0 1000 2000 3000 2 4 6 8 10 12 14 16 40°C 60°C SAXS - 60°C - pH3 SAXS - 40°C - pH3 XRD - 60°C - pH3 XRD - 40°C - pH3 Crysta l Size (n m) Time (h) RT
stages of thorite formation. By decreasing the temperature of synthesis in comparison with classical hydrothermal conditions, the kinetic of formation of thorite was considerably reduced. In-situ SWAXS monitoring of the first steps of crystallization was thus made possible.
This in-situ monitoring allowed characterising of the kinetics of thorite nucleation and growth as a function of the pH value and temperature of the reactive medium. At the early stages of the reaction, SWAXS measurements showed that thorium was maintained in solution in the presence of silicate species under a waterborne form during a long period of time. These Th-silicates colloids adopted a cylinder shape of less than 10 nm length, for a radius around 0.5 nm, before agglomeration or 3D-growth occurred. The duration of this first step increased when decreasing the temperature and pH value. After a given maturation time, during which SAXS signal was no longer describable with simple form factor model due to particles aggregation, the formation of ThSiO4 crystals was
systematically observed by WAXS and PXRD. This result led to the conclusion that colloidal species were either embryo, or intermediate for the crystallisation of thorite. The duration of maturation time was found to increase by decreasing the temperature. The resulting thorite nanocrystals of about 10 nm in diameter were poorly structured. However, the crystallinity of thorite was improved by increasing the temperature. Based on thermogravimetric analyses, it is found that the amount of water molecules or hydroxides groups inserted in the ThSiO4 crystal structure and responsible for
lattice distorsion, decreased by increasing the temperature. This behaviour led to less disordered material. Treating these compounds at high temperature (i.e. 1000°C) allowed recovering of the lattice parameters of thorite mineral, while no or very low amount of ThO2 was observed in the mixtures.
These results have potential implications in the paragenesis of Th minerals deposits, but also in the behaviour of Th and, by analogy, of AnIV in the environment. Under environmental conditions, concentration of Th based aqueous species is usually several orders of magnitude lower than silicates concentrations due to the very low solubility of Th phases. However, the formation of oxyhydroxide colloids is known to increase the concentration of waterborne Th by several orders of magnitude, even for near neutral pH values. In the presence of a large excess of silicate ions, silicate or Th-hydroxosilicate colloids could exist. The Th-silicate colloids evidenced in this work have, at low temperature and at near neutral pH, a long-term stability and a morphology in favor of a higher mobility in groundwaters. If these species are formed in more diluted media, this could affect the spreading of Th and AnIV in permeable environmental media, which would allowed colloidal transport.
Conflicts of interest
There are no conflicts to declare.
Acknowledgements
The authors would like to acknowledge Bruno Corso (ICSM) for his technical support with PXRD and SWAXS measurements.
Notes and references
1 T. S. Neill, K. Morris, C. I. Pearce, N. K. Sherriff, M. G. Burke, P. A. Chater, A. Janssen, L. S. Natrajan and S. Shaw, Environmental
science & technology, 2018, 52, 9118–9127.
2 V. Peretroukhine, C. Riglet-Martial, H. Capdevila, V. Calmon, P. Bienvenu and I. Laszak, Journal of Nuclear Science and
Technology, 2002, Supplement, 516–519.
3 C. Hennig, S. Weiss, D. Banerjee, E. Brendler, V. Honkimäki, G. Cuello, A. Ikeda-Ohno, A. C. Scheinost and H. Zänker, Geochimica
et Cosmochimica Acta, 2013, 103, 197–212.
4 C. Riglet-Martial, I. Laszak, L. Bion and P. Vitorge, Competition
carbonate-silicate sur la complexation des actinides en milieu argileux riche en silice, CEA, 2000.
5 H. Zänker, S. Weiss, C. Hennig, V. Brendler and A. Ikeda-Ohno,
Chemistry Open, 2016, 5, 174–182.
6 I. Dreissig, S. Weiss, C. Hennig, G. Bernhard and H. Zänker,
Geochimica et Cosmochimica Acta, 2011, 75, 352–367.
7 I. Ulbricht, Ph.D. Thesis. Technischen Universität Dresden, 2010. 8 R. Husar, Ph.D. Thesis. Technischen Universität Dresden, 2015. 9 R. Husar, S. Weiss, C. Hennig, R. Hübner, A. Ikeda-ohno and H.
Zänker, Environmental science & technology, 2015, 49, 665–671. 10 L. Troost and L. Ouvrard, Comptes rendus hebdomadaires des
séances de l’Academie des Sciences, 1887, 105, 255–258.
11 L. H. Fuchs, The American Mineralogist, 1958, 43, 367–368. 12 E. R. Vance, Materials Research Bulletin, 1986, 21, 321–329. 13 L. H. Fuchs and E. Gebert, The American Mineralogist, 1958, 43,
243–248.
14 C. Keller, Nukleonik, 1963, 5, 41–48.
15 C. Keller, Karlsruhe Kernforschungszentrum report.
16 C. Frondel and R. L. Collette, The American Mineralogist, 1957,
42, 759–765.
17 D. P. Sinha and R. Prasad, Journal of Inorganic and Nuclear
Chemistry, 1973, 35, 2612–2614.
18 N. Clavier, S. Szenknect, D. T. Costin, A. Mesbah, C. Poinssot and N. Dacheux, Spectrochimica Acta Part A: Molecular and
Biomolecular Spectroscopy 118, 2014, 118, 302–307.
19 N. Clavier, S. Szenknect, D. T. Costin, A. Mesbah, J. Ravaux, C. Poinssot and N. Dacheux, Journal of Nuclear Materials, 2013, 441, 73–83.
20 D. T. Costin, Ph.D. Thesis. Université de Montpellier 2, 2012. 21 D. T. Costin, A. Mesbah, N. Clavier, N. Dacheux, C. Poinssot, S.
Szenknect and J. Ravaux, Inorganic Chemistry, 2011, 50, 11117– 11126.
22 D. T. Costin, A. Mesbah, N. Clavier, S. Szenknect, N. Dacheux, C. Poinssot, J. Ravaux and H. P. Brau, Progress in Nuclear Energy, 2012, 57, 155–160.
23 S. Szenknect, D. T. Costin, N. Clavier, A. Mesbah, C. Poinssot, P. Vitorge and N. Dacheux, Inorganic Chemistry, 2013, 52, 6957– 6968.
24 J. D. Bauer, S. Labs, L. Bayarjargal, W. Morgenroth, S. Weiss, H. Curtius, D. Bosbach and B. Winkler, DESY annual report.
25 S. Labs, Schriften des Forschungszentrums Jülich.
26 S. Labs, C. Hennig, S. Weiss, H. Curtius, H. Zänker and D. Bosbach, Environmental science & technology, 2014, 48, 854–860. 27 X. Guo, A. Mesbah, N. Clavier, C. Poinssot, D. Wu, H. Xu, N. Dacheux, R. C. Ewing and A. Navrotsky, Chemistry of Materials, 2016, 28, 7117–7124.
28 A. Mesbah, N. Clavier, M. J. Lozano-rodriguez, S. Szenknect and N. Dacheux, Inorganic Chemistry, 2016, 55, 11273–11282. 29 A. V. Knyazev, M. E. Komshina and I. A. Savushkin,
Radiochemistry, 2017, 59, 225–228.
30 P. Estevenon, E. Welcomme, S. Szenknect, A. Mesbah, P. Moisy, C. Poinssot and N. Dacheux, Inorganic Chemistry, 2018, 57, 12398–12408.
31 P. Estevenon, E. Welcomme, S. Szenknect, A. Mesbah, P. Moisy, C. Poinssot and N. Dacheux, Inorganic Chemistry, 2018, 57, 9393– 9402.
32 R. D. Schuiling, L. Vergouwen and H. van der Rijst, American
Mineralogist, 1976, 61, 166–168.
33 B. Panzarella, G. Tompsett, W. C. Conner and K. Jones, Chemical
Physics and Physical Chemistry, 2007, 8, 357–369.
34 W. Fan, M. Ogura, G. Sankar and T. Okubo, Chemistry of
Materials, 2007, 19, 1906–1917.
35 E. Stavitski, M. Goesten, J. Juan-Alcaniz, A. Martinez-Joaristi, P. Serra-Crespo, A. V. Petukhov, J. Gascon and F. Kapteijn,
Angewandte Chemie - International Edition, 2011, 50, 9624–9628.
36 C. Frontera and J. Rodriguez-Carvajal, Physica B: Condensed
Matter, 2003, 335, 219–222.
37 A. P. Hammersley, FIT2D: An Introduction and Overview, ESRF, 1997.
38 A. P. Hammersley, FIT2D V9.129 Reference Manual V3.1, ESRF, 1998.
39 M. Taylor and R. C. Ewing, Acta Crystallographica Section
B-Structural Crystallography and Crystal Chemistry, 1978, 34, 1074–
1079.
40 J. Holzer and G. McCarthy, 1991.
41 A. P. Deditius, S. Utsunomiya and R. C. Ewing, Chemical Geology, 2008, 251, 33–49.
42 J. Janeczek and R. C. Ewing, Materials Research Society,
Symposium Proceedings, 1992, 257, 497–504.
43 C. Frondel, United State Departement of the Interior Geological
Survey.
44 R. Corriu and T. A. Nguyên, Chimie moléculaire, sol-gel et
nanomatériaux, Ecole polytechnique, Palaiseaux, 2008.
45 U. Holzwarth and N. Gibson, Nature Nanotechnology, 2011, 6, 534–534.