HAL Id: hal-02880106
https://hal.archives-ouvertes.fr/hal-02880106
Submitted on 24 Jun 2020
HAL is a multi-disciplinary open access
archive for the deposit and dissemination of
sci-entific research documents, whether they are
pub-lished or not. The documents may come from
teaching and research institutions in France or
abroad, or from public or private research centers.
L’archive ouverte pluridisciplinaire HAL, est
destinée au dépôt et à la diffusion de documents
scientifiques de niveau recherche, publiés ou non,
émanant des établissements d’enseignement et de
recherche français ou étrangers, des laboratoires
publics ou privés.
Film-Forming Amines for the Corrosion Protection of
Carbon Steels in Nuclear Power Plant Secondary Circuit
Conditions: An Impedance Study
Jordan Baux, Nicolas Caussé, Sophie Delaunay, Jonathan Tireau, Marion
Roy, Dominique You, Nadine Pébère
To cite this version:
Jordan Baux, Nicolas Caussé, Sophie Delaunay, Jonathan Tireau, Marion Roy, et al.. Film-Forming
Amines for the Corrosion Protection of Carbon Steels in Nuclear Power Plant Secondary Circuit
Conditions: An Impedance Study. Journal of The Electrochemical Society, Electrochemical Society,
2020, 167 (6), pp.061504. �10.1149/1945-7111/ab7d42�. �hal-02880106�
OATAO is an open access repository that collects the work of Toulouse
researchers and makes it freely available over the web where possible
Any correspondence concerning this service should be sent
to the repository administrator:
tech-oatao@listes-diff.inp-toulouse.fr
This is an author’s version published in:
http://oatao.univ-toulouse.fr/26125
To cite this version:
Baux, Jordan
and Caussé, Nicolas
and Delaunay, Sophie and Tireau,
Jonathan and Roy, Marion and You, Dominique and Pébère, Nadine
Film-Forming Amines for the Corrosion Protection of Carbon Steels in Nuclear
Power Plant Secondary Circuit Conditions: An Impedance Study. (2020)
Journal of The Electrochemical Society, 167 (6). 061504. ISSN 1945-7111
conductivity, pH and ODA concentration during the tests. A titanium mesh, attached to a rotating axis, carried three carbon steel plates. The rotation rate of the sample holder was maintained at 100 rpm.
ODA was in the form of ODACON®, a commercial emulsion
(≈50 g L−1FFA) supplied by REICONTM.
Electrochemical deposition of magnetite. A magnetite layer was electrodeposited on the carbon steel during 30 min to ensure the formation of a thick layer, following the procedure described by Goujon et al.28 A classical three electrode cell was used with a mercury sulfate electrode (MSE) in a saturated potassium sulfate solution as reference, a platinum grid as counter electrode and the RDE as working electrode. The rotation rate wasfixed at 500 rpm. Figure1shows a top view and a cross section of the magnetite layer. After 30 min of deposition, its thickness is about 40μm. Through pores can be observed on the micrograph. The magnetite layer has been thoroughly characterized by Goujon et al.28
ODA films formation. At low temperature (T < 100 °C), the ODAfilm formation on the electrodeposited magnetite was obtained with conditions similar to those used for the ODAfilm formation on the bare carbon steel.25The deposition conditions (ODA concentra tion, temperature, pH of the solution, immersion time and electrode rotation rate) are reported in TableII.
At higher temperatures (T> 100 °C), the carbon steel plates were placed in the pressure equipment, the pH25°C of the solution was
fixed between 9.6 and 9.8 with ammonia and ethanolamine. The electrolyte was deaerated with nitrogen bubbling before each experiment. Hydrazine was added (1 mg kg−1) to ensure reducing conditions. For security reasons, the pressure equipment was not completelyfilled, and a steam phase was present above the liquid phase. Three test temperatures were chosen: 120 °C, 220 °C and 275 °C. These temperatures are representative of the water station, the entrance of the generator and the generator, respectively.1 3 At 120 °C and 220 °C, the samples were dipped in the liquid phase. At 275 °C, the samples were placed in the steam phase to reproduce the conditions of the upper part of the steam generators. The ODA concentration in the liquid phase was controlled to be close to
2 mg kg−1, which is in the order of magnitude of the ODA
concentration injected for the conservation of the circuit.1 3 For 220 °C, an additional experiment was carried out with a higher ODA concentration (25 mg kg−1). For each temperature, carbon steel reference samples were prepared without ODA in similar conditions as described above.
Surface characterizations. For the surface characterizations, the electrodeposited magnetite and the samples from the autoclave were kept in contact with air for the shortest possible time.
Optical observations were performed with an Olympus PMG3 optical microscope. Scanning electron microscopy (SEM) images were obtained with a Zeiss Gemini Sigma in secondary electron mode. Energy dispersive X ray spectroscopy (EDX) analyses were
performed at different locations on the carbon steel surface treated with ODA at 120 °C to compare the chemical composition of the regions of interest.
The contact angles were measured at room temperature using a Krüss Mobile Surface Analyzer. The protocol consisted in depos iting a deionized water drop of an accurate volume of 1μl on the sample surface and then measuring the static contact angle (θ) 60 s after the drop deposition. To assess the homogeneity of the surface properties, 20 measurements were performed on different locations on the samples surface.
EIS measurements. The impedance measurements were per
formed with a conventional three electrode cell with a mercury sulfate electrode (MSE) in a saturated potassium sulfate solution and a platinum grid, as reference electrode and counter electrode, respectively. The working electrode consisted of the carbon steel RDE or the carbon steel plate, depending on the temperature of the ODAfilms formation. In both cases, the surface area in contact with the electrolyte was 1 cm2. The electrolytic solution was prepared from deionized water by adding 10−3M Na2SO4(analytical grade).
The choice of this medium was based upon its low electrical conductivity, close to that encountered in industrial water circuits, its low corrosiveness toward carbon steel and because it is an easily
reproducible baseline solution. The pH was fixed at 10 with
ammonia. A high pH value (around 10) is currently considered for secondary circuit conditioning to limitflow accelerated corrosion of carbon steels and to decrease the magnetite solubility.29 31
A Solartron 1286 electrochemical interface connected to a Solartron 1250 frequency response analyzer was used. EIS measure ments were performed under potentiostatic regulation at the
Table I. Chemical composition (wt%) of the P275 carbon steel. Element C Si Mn Cr Mo Ni Cu Fe
0.16 0.4 0.5 1.5 0.3 0.08 0.5 0.3 Bal.
Figure 1. Observations of the carbon steel surface (RDE) after the magnetite electrodeposition: (a) Top view (optical microscope) and (b) cross section (SEM).
Table II. Deposition parameters for the ODAfilm formation on the magnetite layer.
ODA concentration 100 mg kg 1
Temperature 80 °C
Electrode rotation rate 500 rpm
pH25°C 10
corrosion potential (Ecorr) in the frequency range of 65 kHz to
1 mHz with 8 points per decade, using 15 mVrmssinusoidal voltage.
The linearity was checked by varying the amplitude of the signal from 5 mVrms to 50 mVrms. At least two measurements were
performed to ensure reproducibility. All the experiments were carried out at room temperature. Data modelling was carried out with a non commercial software developed at the LISE CNRS (Paris).
EIS Data Analysis
When the presence of an ODAfilm was identified on the ODA treated samples, the impedance results were analyzed with a model to determine the thickness and the dielectric permittivity of the organic film, according to the recently developed methodology.25 This methodology is briefly recalled below.
The impedance data are commonly analyzed by using electrical equivalent circuits, in which the capacitances are replaced by constant phase elements (CPE) to better describe the non ideal behavior of the interface. The CPE impedance, (ZCPE), is expressed
in terms of model parametersα and Q as: w = a Z j Q 1 1 CPE ( ) [ ]
With ω = 2πf. The α and Q parameters can be graphically
extracted.32
In the case of oxidefilms or organic coatings, the capacitance of the layers can be graphically extracted from the high frequency part of the impedance data, (Z(ω)), by using the complex capacitance representation:25,33 35 w w w = -C j Z R 1 2 e ( ) [ ( ) ] [ ]
Where C is the capacitance as a function of w=2pf and Reis the
electrolyte resistance. The ODA film capacitance, C ,f was deter
mined from the extrapolation at high frequency. Then, the dielectric layer thickness can be calculated using the following relationship:
d= ee
Cf 3
0 [ ]
Where e, e0 and δ, represent the ODA dielectric permittivity, the
vacuum permittivity and the ODAfilm thickness, respectively. For bulk ODA, a dielectric permittivity value of 2.7 was reported in the literature.36
Recently, different studies suggested that the origin of the CPE behavior observed with oxidefilms or organic coatings may be the consequence of a normal distribution of their resistivity along the film thickness according to the model developed by Hirschorn et al.37,38 The resistivity r x ,( ) with x = dx , is expressed (Eq. (4)) as a function of the layer thickness,δ, the depth, x, in the layer, the boundary resistivity valuesρ0andρδat the metal/film interface (x =
0) and at thefilm/electrolyte interface (x = δ) and γ which is derived from the CPE parameterα such as a = (g-g1).
r x r r r r r x = + -d d d g -1 4 0 0 1 ⎛ ⎝ ⎜⎜ ⎛⎝⎜ ⎞ ⎠ ⎟ ⎞ ⎠ ⎟⎟ ( ) [ ]
The corresponding impedance can be determined using an integral expression:
ò
w d wee x x = + + -r rd r g Z j d 1 5 f 1 0 1 0 1 1 0(
0)
( ) [ ]Regression of EIS data with the power law model allows the extraction of physical parameters related to the film such as
permittivity, thickness and resistivity values at the interfaces. In the present work, the ODA dielectric permittivity value obtained from the regression will be compared to that reported in the literature.36
Results and Discussion
First, the ODAfilm formed on the magnetite layer (henceforth called ODA treated magnetite) is characterized by EIS. Then, the influence of the treatment temperature on the ODA films formation is discussed. In a third part, the impedance data are analyzed with the power law model in order to extract the physical parameters of the ODA films formed at different temperatures. Finally, the instanta neous corrosion inhibition efficiency is assessed from the impedance data obtained at the corrosion potential, with and without ODA.
ODA treated magnetite. The impedance spectra, in Bode
coordinates, obtained for the magnetite layer and for the ODA treated magnetite after 2 h of immersion in the Na2SO4solution are
Figure 2. Electrochemical impedance diagrams for the carbon steel covered by the magnetite with ODA treatment (100 mg kg 1, 80 °C; 30 min; pH25 °C 10,Ω 500 rpm) and without ODA. The diagrams are obtained after 2 h of immersion in the 10 3M Na2SO4solution. (a) Impedance modulus and (b) phase angle. The dotted lines are thefitted curves with the equivalent circuit shown in Fig.10.
presented in Fig.2. For the magnetite layer, the impedance diagram is characterized by a single time constant related to the electro chemical behavior of the carbon steel/magnetite/electrolyte inter face. After the ODA treatment, an additional time constant appears
at high frequency (between 104 10 Hz), attributed to the presence of the ODAfilm.25Without ODA, the value of the impedance modulus at low frequency is about 3200Ω cm2, close to that obtained for the bare carbon steel (mechanically polished) in the same conditions.25
Figure 3. SEM micrographs of the carbon steel samples after the treatments in the autoclave. (a) 168 h at 120 °C without ODA, (b) 168 h at 120 °C with ODA (2 mg kg 1), (c) 168 h at 220 °C without ODA, (d) 168 h at 220 °C with ODA (2 mg kg 1), (e) 2 h at 275 °C in the steam phase without ODA, (f) 2 h at 275 °C in the steam phase with ODA (2 mg kg 1in the liquid phase) and (g) EDX spectra (normalized from the Fe peak) corresponding to different areas on the treated ODA carbon steel at 120 °C during 168 h (Fig.3b).
This means that the thick electrodeposited magnetite layer does not strongly influence the electrochemical behavior of the interface. This could be attributed both to the porous structure of the magnetite, as observed in Fig.1, and to its good conductive properties.39For the ODA treated magnetite, the impedance modulus at low frequency increases about one decade (24600Ω cm2) which is, again, similar to the result previously obtained with ODA on the bare carbon steel.25 These results underline that the ODA film has roughly the same signature on the impedance diagrams when adsorbed on the bare carbon steel or on the electrodeposited magnetite. These impedance data will be further analysed and the results will be discussed by comparison with those obtained after the treatments in the autoclave at temperatures higher than 100 °C.
Carbon steel treated with ODA in the autoclave at T > 100 °C. Surface observations and contact angle measurements. SEM images of the surface morphology of the carbon steel samples treated at 120 °C, 220 °C and 275 °C in the autoclave, with and without ODA, are shown in Fig.3. The formation of a magnetite layer is observed for all the coupons. The size of the magnetite crystallites increases when the treatment temperature increases, particularly for the samples treated at 275 °C in the steam phase (Figs.3e and3f). In that case, the dissolution of the magnetite was limited in the steam and it accumulated on the samples surface. In the presence of ODA, dark areas are visible on the samples treated at 120 °C and 220 °C (Figs.3b and3d). Their composition was qualitatively analyzed by EDX for the sample treated at 120 °C (Fig.3g). A significant enrichment in carbon is observed which could be attributed to the presence of ODA clusters. Such clusters have already been observed for the bare carbon steel treated at 80 °C with a higher ODA concentration (100 mg kg−1).25
Contact angle measurements for the ODA treated samples at 120 °C (Fig. 3b) and 220 °C (Fig. 3d) highlight a change in the surface hydrophobicity by comparison with the non treated samples (Figs. 3a and 3c, respectively). The contact angles increase by around 22° and 25° for the ODA treated carbon steel at 120 °C and 220 °C, respectively, compared to the reference samples. This difference would be linked to the ODA adsorption on the surface. For the samples exposed at 275 °C in the steam phase (Figs. 3e and 3f), the surface roughness, due to the formation of larger magnetite crystallites, could be at the origin of the increase of the contact angle, both with and without ODA. In that case, the contact angle measurement cannot be used to verify the ODA adsorption. As it will be shown further, there was no ODAfilm on the surface at this temperature.
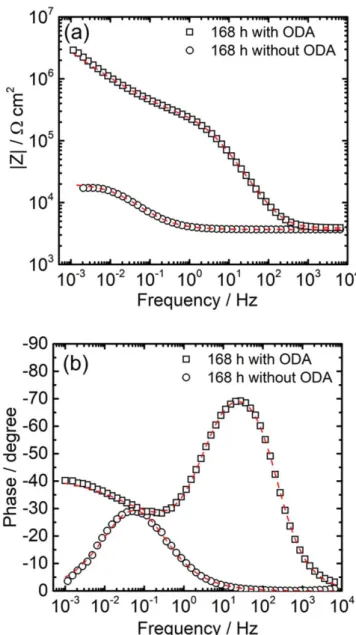
ODAfilm formation: influence of the deposition conditions. The impedance diagram, in Bode coordinates, for the carbon steel treated in the autoclave with ODA (2 mg kg−1) during 168 h at 120 °C and after 2 h of immersion in the Na2SO4solution is presented in Fig.4.
The diagram is compared with that obtained for a reference sample (same conditions without ODA). The impedance modulus (Fig.4a) at 10−3Hz shows a significant increase after the ODA treatment (more than two decades) compared to the reference sample. In addition, the phase angle (Fig.4b) reveals a very well defined time constant in the high frequency range, which is not visible on the reference sample, and related to the ODA film formation on the sample. Thus, the ODA is able to form afilm on the carbon steel surface at 120 °C in the representative thermochemical conditions of the secondary circuit. The significant increase of the impedance modulus after the ODA treatment could be due to the deposition condition (temperature and treatment time in the autoclave) and could also reveal a synergistic effect between the magnetite layer formation and the ODA adsorption.
Figure 5 shows the impedance diagrams of the carbon steel samples after the treatment in the autoclave at 220 °C, with ODA
(2 mg kg−1 and 168 h of immersion (Figs. 5a and 5b) and
25 mg kg−1 and 2 h of immersion (Figs. 5c and 5d) and without
ODA. With 2 mg kg−1 of ODA, the impedance diagram for the
ODA treated sample (Figs.5a and5b) is relatively similar to that of the sample without ODA. This was unexpected because the contact angle measurements pointed out a more hydrophobic surface after the ODA treatment. Moreover, the SEM images suggested the presence of the organic molecules on the surface (dark areas in Fig.3d). The impedance results indicate that the ODA molecules did not homogeneously cover the electrode surface, leaving film free areas without protection.
To check if it was possible to form an ODA film at 220 °C, carbon steel coupons were treated in similar conditions with a higher ODA concentration (25 mg kg−1). The impedance diagrams are displayed in Figs. 5c and 5d. It can be seen that after 2 h of treatment, the impedance modulus at 10−3Hz (Fig. 5c) increases about 2 decades, similarly to what was observed after the treatment at 120 °C, and a time constant, characteristic of the presence of the ODA film, is visible on the phase angle (Fig. 5d). Thus, the comparison of the EIS results for the samples treated with 2 mg kg−1of ODA at 120 °C (Fig.4) and at 220 °C (Figs.5a and
5b) emphasizes the important role played by the temperature. To explain these results, the most likely hypothesis would be the
Figure 4. Electrochemical impedance diagrams for the carbon steel samples treated at 120 °C during 168 h with ODA (2 mg kg 1) and without ODA. The diagrams are obtained after 2 h of immersion in the 10 3M Na2SO4 solution. (a) Impedance modulus and (b) phase angle. The dotted lines are thefitted curves with the equivalent circuit shown in Fig.10.
thermal degradation of the ODA at 220 °C and for long immersion times, as set out further.
Figure 6 compares the impedance diagrams obtained for the carbon steel treated at 275 °C after 2 h and 24 h in the presence of
ODA (2 mg kg−1) and after 2 h without ODA. The impedance
modulus at low frequency is higher after 2 h of treatment with ODA (4× 10⁶Ω cm2) compared to the reference sample (2× 10⁵Ω cm2). However, the time constant characteristic of thefilm is hardly discernible (Fig. 6b). After 24 h of treatment, the impedance modulus decreases and the phase angle reveals a single time constant, indicating that the film effect disappeared after 24 h at 275 °C. The thermal degradation of the ODA molecules at 275 °C could explain this result.
To confirm this hypothesis, the ODA concentration in the liquid phase at 275 °C was determined as a function of time. The variation of the ODA concentration with time is reported in Fig.7. It can be seen that the ODA concentration rapidly decreases. About 80 wt% of the initial concentration disappear during thefirst 6 h. After 24 h, the ODA concentration is almost zero. Thus, the absence of the ODA film response on the impedance spectra after 24 h of treatment (Fig. 6) and the rapid decrease of the ODA concentration in the liquid phase during the same period (Fig.7) confirmed the thermal degradation of the ODA at 275 °C. The ODA degradation might also take place at 220 °C, which would explain the absence of thefilm after 168 h of treatment with 2 mg kg−1ODA (Figs.5a and5b).
EIS analysis. High frequency part: physical description of the ODAfilms. The ODA films formed on the steel samples at different temperatures were characterized by analyzing the high frequency domain (10 Hz to 10 kHz) of the impedance diagrams. A focus was made on the determination of the ODAfilms thickness and on the
resistivity profiles obtained from the power law model. Due to the absence of a high frequency time constant on the impedance diagrams for the samples treated with ODA (2 mg kg−1) during 168 h at 220 °C and during 2 h at 275 °C, the corresponding impedance results were not considered in the following.
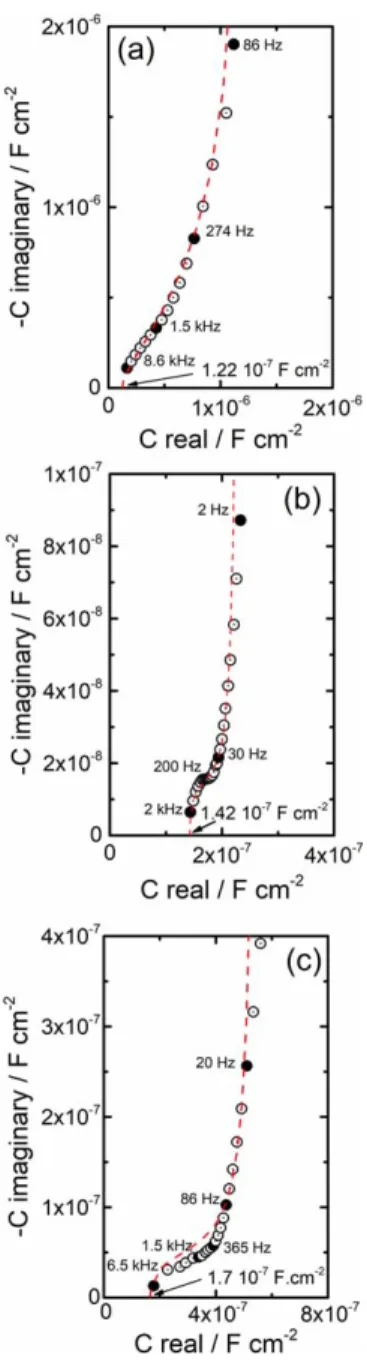
The complex capacitance plots corresponding to the impedance diagrams with ODA presented in Figs. 2, 4 and 5c and 5d are displayed in Fig.8, as well as thefitted curves with the power law model (Eq.5). The regressed parameters are reported in TableIII. For comparison, the values obtained for the ODA treated carbon steel25are added in TableIII. It is interesting to note that in all cases, the ODA permittivity value extracted from the power law model is equal to 2.8 which is very close to the permittivity value found in the literature for bulk ODA (ε = 2.7).36
First, the result for the ODA treated magnetite is shown in Fig. 8a. The film thickness, δ, calculated from Eq. 3 with Cf =
1.22 × 10⁻⁷F cm−2 (graphically determined film capacitance) is identical to the extracted value with the power law model and is equal to 20 nm. This result is roughly consistent with that obtained on the carbon steel treated with ODA in the same deposition conditions.25 The in depth resistivity profile of the ODA layer formed on the electro deposited magnetite was calculated from Eq.4and reported line (a) in Fig. 9. The profile is similar to that obtained on the treated carbon steel.25From Figs.2,8a and9, it can be concluded that the ODAfilm formed on two different substrates (electrodeposited magnetite and carbon steel), in the same deposition conditions (treatment with 100 mg kg−1 ODA during 30 min at 80 °C), have the same physical characteristics.
The complex capacitance plot of the ODA treated carbon steel at 120 °C during 168 h with 2 mg kg−1ODA is shown in Fig.8b.
The ODA film thickness, calculated from the film capacitance
Figure 5. Electrochemical impedance diagrams for the carbon steel samples treated: (a), (b) at 220 °C during 168 h with ODA (2 mg kg 1) and without ODA and (c), (d) at 220 °C during 2 h with ODA (25 mg kg 1) and without ODA. The diagrams are obtained after 2 h of immersion in the 10 3M Na
2SO4solution. (a), (c) Impedance modulus and (b), (d) phase angle. The dotted lines are thefitted curves with the equivalent circuit shown in Fig.10.
(Cf = 1.42 × 10⁻⁷F cm−2) and from the regression with the
power law model, is equal to 18 nm. This value is relatively similar to that obtained after the treatment with 100 mg kg−1ODA at 80 °C during 30 min on the bare carbon steel (16 nm25) and on the magnetite (20 nm). Thus, it appears that the deposition
conditions have little influence on the ODA film thickness.
However, the in depth resistivity profile (line (b) in Fig. 9) is different from those obtained at low temperature. In this case, a high resistivity plateau (ρ0= 1012Ω cm) is observed over about
half the ODAfilm thickness (approximately 10 nm), which is in agreement with the significant increase of the impedance modulus at low frequency after the ODA treatment. The physical origin of this high resistivity plateau is not yet understood. One hypothesis could be the incorporation of the ODA molecules in the magnetite layer formed during the treatment at 120 °C, which would lead to the formation of a compact mixed ODA/magnetite layer. This hypothesis is in agreement with previous studies.5 7 It may be noted here that the high resistivity plateau was not observed on the ODA treated magnetite probably because the magnetite layer and the ODAfilm were deposited consecutively.
Finally, for thefilm formed during 2 h at 220 °C with 25 mg kg−1 ODA, thefilm thickness, δ, determined both graphically (Fig. 8c) and by regression with the power law model is equal to 15 nm, which is close to the ODAfilms thickness already obtained for the different treatment conditions. For this system, a slight deviation is visible at high frequency between the experimental and the regressed data (χ2= 0.77). In line (c) in Fig.9, the resistivity profile highlights a high resistivity plateau (1011Ω cm) over about 4 nm thick. The lower resistivity value and the narrower plateau obtained after 2 h at 220 °C with 25 mg kg−1ODA compared with 168 h at 120 °C with 2 mg kg−1ODA might be linked to the influence of the treatment time.
Low frequency part: corrosion inhibition efficiency. In the absence of ODA, the impedance spectra obtained for the carbon
Figure 6. Electrochemical impedance diagrams for the carbon steel samples treated at 275 °C in the steam phase during 2 h and 24 h with ODA (2 mg kg 1in the liquid phase) and without ODA during 2 h. The diagrams are obtained after 2 h of immersion in the 10 3M Na2SO4 solution. (a) Impedance modulus and (b) phase angle.
Figure 7. ODA concentration in the liquid phase at 275 °C as a function of time.
Table III. Regressed parameter values obtained with the power-law model for the ODA layers formed for different treatment conditions (temperature and concentration) on the carbon steel.
Treated carbon steel at 80°C, [ODA] 100 mg kg 1,
30 min Taken from Ref.25
Treated magnetite layer at 80°C, [ODA] 100 mg kg 1,
30 min
Treated carbon steel at 120°C, [ODA] 2 mg kg 1,
168 h
Treated carbon steel at 220°C, [ODA] 25 mg.kg 1, 2 h δ/nm 16 20 18 15 α 0.78 0.67 0.95 0.89 e 2.8 2.8 2.8 2.8 ρ0/Ω cm 1× 10 10 1× 10¹⁰ 9× 10¹¹ 9× 10¹⁰ ρδ/Ω cm 1.6× 10⁶ 1× 10⁷ 8× 10⁷ 1× 10⁶ χ2 0.32 0.24 0.18 0.77
steel samples were characterized by a single time constant (Figs.2,4
and 5c and 5d). This time constant, between 10−1 and 10−2Hz (or 10−3Hz), can be attributed to the processes occurring at the carbon steel/electrolyte interface. The presence of magnetite, which has a high electrical conductivity, has very little influence on the
impedance response.39 On the other hand, the ODA films are
assumed to be strongly adsorbed on the samples surface as suggested by the high resistivity at the metal/film interface (Fig. 9). Nevertheless, the ODAfilms were very thin (about 20 nm) and the corrosion process would occur on a reduced surface area. As afirst
approximation, we can consider that the second time constant observed on the impedance diagrams for the ODA treated samples is due to the charge transfer process at the bottom of the through pores of the ODA layer, at the magnetite/electrolyte interface. Without ODA, the parameters associated with the single time constant were determined with a simple R//CPE circuit (Rt, Qdland
αdl). For the ODA treated samples, the parameters were determined
by using the equivalent circuit shown in Fig.10. The dotted lines in Figs.2, 4and 5c and5d are thefitted curves with the equivalent circuit. As it can be seen, the experimental data are in perfect agreement with thefitted data. The fitted parameter values (Rt, Qdl
andαdl) are reported in TablesIV,VandVI.
From the CPE parameters (αdl and Qdl), the double layer
capacitance (Cdl) values were calculated by using the Brug
formula:40 = a + a- a C Q R R 1 1 6 dl dl e t 1⎛ 1 ⎝ ⎜ ⎞ ⎠ ⎟ [ ] ( ) /
The Rtvalues were used to calculate the instantaneous inhibitive
efficiency (IE) according to the following equation:
= - ´ IE R R R % t 100 7 inh t tinh 0 [ ] with Rt inh
is the charge transfer resistance for the ODA treated samples and Rt0 is the charge transfer resistance for the samples
without ODA.
For the magnetite and for the ODA treated magnetite at 80 °C (Table IV), the Cdl values were 200μF cm−2 and 24μF cm−2,
respectively. With magnetite only, the Cdlvalue is in the order of
magnitude of a double layer capacitance (≈50 μF cm−2), slightly higher. This could be due to an increase of the surface area linked to the presence of pores in the magnetite layer. For the ODA treated magnetite, the accessible surface area at the bottom of the through pores of the ODA film can be estimated from the ratio of the capacitances. A value of 12% was obtained. The calculated IE was equal to 87%, in good agreement with the capacitances ratio.
For the results at 120 °C (TableV) and 220 °C (TableVI), the Cdl
values without ODA are of the same order of magnitude (200 300μF cm−2) as that obtained at 80 °C for the magnetite layer (TableIV). These results are in agreement with the formation of the magnetite layer during the exposure in the autoclave and once again confirms the good conductivity of the magnetite. With ODA, it isfirst important to note that the Rtvalues were determined with a significant margin of
error. However, the Rt values are significantly higher than those
obtained without ODA. Thus, the inhibitive efficiency reached very high level (IE> 99.9%). Secondly, it should be emphasized that the adl values are low. This may be attributed to a porous electrode
behaviour. As a consequence, the Cdl values cannot be accurately
calculated. These results pointed out that the magnetite layers formed at 120 °C and 220 °C combined with the ODA molecules resulted in substantial improvement of the corrosion protection. Additional EIS experiments performed as a function of the exposure time in the Na2SO4 solution (not shown) confirmed the beneficial role of the
magnetite on the stability of the ODA film (the diagrams remained unchanged with immersion time). This confirmed the incorporation of the ODA molecules in the magnetite layer as suggested by the high resistivity values determined at the metal/film interface.
Figure 8. Complex capacitance plots corresponding to the EIS spectra presented in: (a) Fig.2, (b) Fig.4and (c) Figs.5c and5d. The dotted lines are thefitted curves with the power law model (Eq.5).
Table IV. Fitted parameter values obtained from the impedance diagram for the carbon steel covered by the magnetite and from the low-frequency time constant of the ODA treated magnetite.
Re(W cm2) Rt(W cm2) Qdl(F cm 2 s(α 1)) α Cdl(μF cm 2 ) IE (%) χ2 Magnetite 778 3200 4.3× 10 4 0.63 200 0.21 Magnetite+ ODA 1141 24600 1.0× 10 4 0.60 24 87 0.38
11. C.-E. Banica, E. Czempik, C. Vogt, and F. Schneider,“Influence of hot water conditioning on the corrosion behavior of carbon steel.”Mater. Corros., 53, 256 (2002).
12. N. Ochoa, F. Moran, N. Pébère, and B. Tribollet, “Influence of flow on the corrosion inhibition of carbon steel by fatty amines in association with phospho-nocarboxylic acid salts.”Corros. Sci., 47, 593 (2005).
13. W. Kuang, J. A. Mathews, M. L. Taylor, and D. D. Macdonald,“The effect of Anodamine on the corrosion behavior of 1018 mild steel in deionized water: II. electrochemical impedance analysis.”Electrochim. Acta, 136, 493 (2014). 14. E. Pensini, R. Van Lier, F. Cuoq, W. Hater, and T. Halthur,“Enhanced corrosion
resistance of metal surfaces byfilm forming amines: a comparative study between cyclohexanamine and 2-(diethylamino)ethanol based formulations.” Water Resources and Industry, 20, 93 (2018).
15. R. D. Braun, E. E. Lopez, and D. Vollmer,“Low molecular weight straight-chain amines as corrosion inhibitors.”Corros. Sci., 34, 1251 (1993).
16. E. C. Roberto, A. de Oliveira Wanderley Neto, C. A. Martínez-Huitle, J. L. Cardozo Fonseca, T. N. de Castro Dantas, and A. Gurgel,“The effect of type of self-assembled system and pH on the efficiency of corrosion inhibition of carbon steel surfaces.”Prog. Org. Coat., 76, 1308 (2013).
17. E. V. Chernyshev, E. N. Veprov, V. A. Petrov, S. L. Bogdanov, T. Y. Levina, T. I. Petrova, V. I. Kashinskii, A. A. Zonov, and A. E. Verkhovskii,“Increasing the corrosion resistance of equipment due to the use offilm-forming amines.”Power Technol. Eng., 40, 34 (2006).
18. S. A. Cao, J. Y. Hu, J. L. Xie, Q. Q. Liang, and L. Yin,“Research on the film-forming characteristics of octadecylamine at high temperatures.”Anti-Corrosion Methods Mater., 60, 14 (2013).
19. A. V. Kurshakov, A. V. Ryzhenkov, A. A. Bodrov, O. V. Ryzhenkov, A. A. Patakin, and E. F. Chernov, “Heat transfer enhancement in steam-turbine condensers with the use of surface-active substances.”Therm. Eng., 61, 785 (2014). 20. B. M. Fan, G. Wei, Z. Zhang, and N. Qiao,“Characterization of a supramolecular complex based on octadecylamine andβ-cyclodextrin and its corrosion inhibition properties in condensate water.”Corros. Sci., 83, 75 (2014).
21. B. M. Fan, Y. Ma, M. Wang, H. Hao, B. Yang, J. Lv, and H. Sun,“Revealing the assembly mechanism of an octadecylamine based supramolecular complex on mild steel in condensate water: Correlative experimental and theoretical studies.”J. Mol. Liquids, 292, 111446 (2019).
22. K. Sipilä and T. Saario,“Effect of octadecylamine on carbon steel corrosion under PWR secondary side conditions.” VTT., VTT-R-06077 (2014).
23. E. Jäppinen, T. Ikäläinen, S. Järvimäki, T. Saario, K. Sipilä, and M. Bojinov, “Corrosion behavior of carbon steel coated with octadecylamine in the secondary circuit of a pressurized water reactor.”J. Materials Eng. Perform., 26, 6037 (2017). 24. B. N. Khodyrev, A. L. Krichevtsov, and A. A. Sokolyuk,“Studying the processes relating to oxidation of organic substances contained in the coolant of thermal and nuclear power stations.”Therm. Eng., 57, 553 (2010).
25. J. Baux, N. Caussé, J. Esvan, S. Delaunay, J. Tireau, M. Roy, D. You, and N. Pébère,“Impedance analysis of film-forming amines for the corrosion protection of a carbon steel.”Electrochim. Acta, 283, 699 (2018).
26. J. E. Castle and G. M. W. Mann,“The mechanism of a porous oxide film on steel.”
Corros. Sci., 6, 253 (1966).
27. J. H. Ashford, R. Garnsey, and G. M. W. Mann,“Corrosion of mild steel under heat transfer in high temperature aerated sodium chloride solutions.”Corros. Sci., 6, 515 (1974).
28. C. Goujon, T. Pauporté, C. Mansour, S. Delaunay, and J. Bretelle,“Electrochemical deposition of thick iron oxide films on nickel based superalloy substrates.”
Electrochim. Acta, 176, 230 (2015).
29. C. Wood and R. J. M. Konings, “Water Chemistry Control in LWRs.” Comprehensive Nuclear Materials(Elsevier, Amsterdam) 17 (2012).
30. P. Tremaine and J. Leblanc,“The solubility of magnetite and the hydrolysis and oxidation of Fe2+in water to 300 °C.”J. Sol. Chem, 9, 415 (1980).
31. D. Lister and S. Uchida,“Determining water chemistry conditions in nuclear reactor coolants.” J. Nuclear Sci. Technol., 52, 451 (2015).
32. M. E. Orazem, N. Pébère, and B. Tribollet, “Enhanced graphical representation of electrochemical impedance data.”J. Electrochem. Soc., 153, B129 (2006). 33. M. Benoit, C. Bataillon, B. Gwinner, F. Miserque, M. E. Orazem, C. M.
Sánchez-sánchez, B. Tribollet, and V. Vivier, “Comparison of different methods for measuring the passive film thickness on metals.”Electrochim. Acta, 201, 340 (2016).
34. A. S. Nguyen, N. Causse, M. Musiani, M. E. Orazem, N. Pébère, B. Tribollet, and V. Vivier,“Determination of water uptake in organic coatings deposited on 2024 aluminium alloy: Comparison between impedance measurements and gravimetry.”
Prog. Org. Coatings., 112, 93 (2017).
35. S. Chakri, I. Frateur, M. E. Orazem, E. M. M. Sutter, T. T. M. Tran, B. Tribollet, and V. Vivier,“Improved EIS analysis of the electrochemical behaviour of carbon steel in alkaline solution.”Electrochim. Acta, 246, 924 (2017).
36. D. R. Lide, CRC Handbook of Chemistry and Physics (CRC Press, United States of America) 84th ed. (2003).
37. B. Hirschorn, M. E. Orazem, B. Tribollet, V. Vivier, I. Frateur, and M. Musiani, “Constant-phase-element behavior caused by resistivity distributions in films. I: theory.”J. Electrochem. Soc., 157, C452 (2010).
38. B. Hirschorn, M. E. Orazem, B. Tribollet, V. Vivier, I. Frateur, and M. Musiani, “Constant-phase-element behavior caused by resistivity distributions in films. II: applications.”J. Electrochem. Soc., 157, C458 (2010).
39. I. Frateur, C. Deslouis, M. Orazem, and B. Tribollet,“Modeling of the cast iron/ drinking water system by electrochemical impedance spectroscopy.”Electrochim. Acta, 44, 4345 (1999).
40. G. J. Brug, A. L. G. van den Eeden, M. Sluyters-Rehbach, and J. H. Sluyters,“The analysis of electrode impedances complicated by the presence of a constant phase element.”J. Electroanal. Chem., 176, 275 (1984).